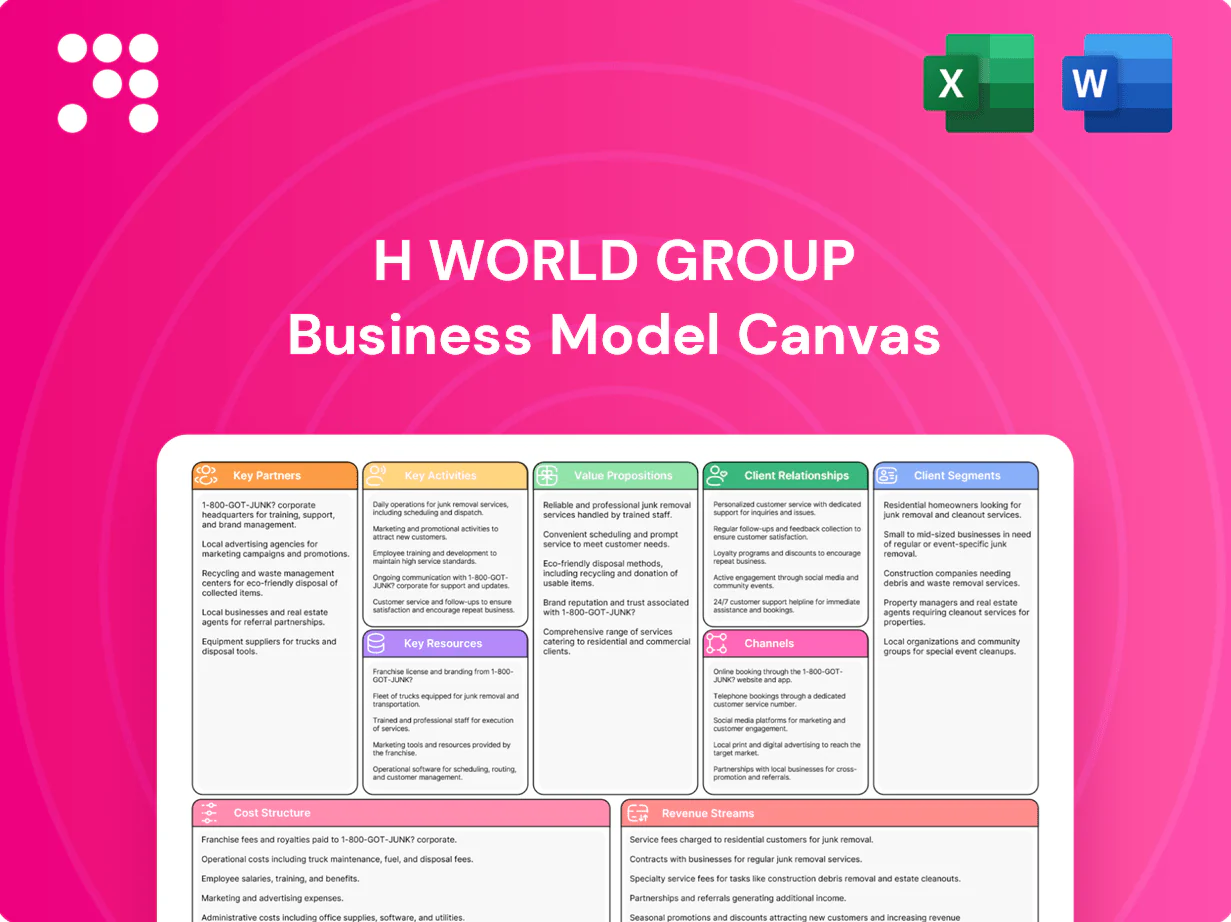
H World Group Business Model Canvas

Preview the Business Model Canvas: strategic playbook for a global hospitality group
Unlock H World Group’s strategic playbook with our concise Business Model Canvas preview. Discover the company’s core value propositions, revenue levers, and partnership network in a clear, actionable format. Buy the full Canvas to get the complete nine-block breakdown—ready for benchmarking, presentations, and execution.
Partnerships

Franchisees and hotel owners
Franchisees supply capital, properties and local market access while adopting H World’s operating standards across a network of over 7,500 hotels (2024), enabling rapid scale. H World supplies brand, tech and operational playbooks that lift occupancy and RevPAR, with management systems and loyalty integration across millions of members. Fee structures align incentives by tying base fees plus performance-linked bonuses to RevPAR growth, and 10–20 year contracts strengthen network stability.
Real estate developers and landlords
Real estate developers and landlords enable H World to grow rapidly through leases, conversions and greenfield projects, supporting a portfolio of over 8,000 hotels by 2024. H World secures favorable lease and conversion terms by delivering reliable demand and strong brand pull to partners. Pipeline visibility — often thousands of rooms planned — reduces market-entry risk and cuts time-to-open (conversions 3–6 months, greenfield 12–18 months). Strategic sites expand market coverage and capture guest loyalty.

Online travel agencies and distribution partners
OTAs, meta-search and GDS partners expand H World Group’s visibility and reach across channels, supporting distribution for over 8,300 hotels as of 2024 and tapping into OTAs’ ~40% share of online hotel bookings globally in 2024. Balanced distribution lowers dependency on any single channel, smoothing customer-acquisition-cost volatility and improving resilience. Data-sharing with partners enhances dynamic pricing, content quality and conversion rates, while preferential placements help fill need periods and new openings.

Technology and payment ecosystem
- Partners: PMS, CRS, cloud, cybersecurity, AI, payments
- Capabilities: mobile check-in, dynamic pricing, fast settlement
- 2024 focus: API-first roadmaps, scalability, compliance
- Outcome: lower operational risk, faster innovation
Corporate travel, MICE, and mobility alliances
Corporate TMCs, airlines, rail operators and local tourism bureaus supplied steady B2B demand for H World in 2024, with corporate/MICE contributing roughly 30% of urban room nights; bundled rates and negotiated contracts improved occupancy mix by an estimated 5–8%, while MICE organizers booked meeting spaces across H World’s multi-brand footprint.
- Corporate share ~30%
- Occupancy lift 5–8%
- MICE cross-brand bookings
- Co-marketing boosts loyalty enrollment
8,300 hotels franchise network: OTAs ~40% bookings, occupancy +5-8%
Franchisees provide capital, properties and local distribution across 8,300 hotels (2024) under 10–20 year contracts enabling rapid scale. H World supplies brand, tech, loyalty and fee+performance models that lift RevPAR; corporate/MICE ≈30% urban room nights, occupancy +5–8%. OTAs (~40% online bookings), tech vendors (API-first) and developers shorten conversions (3–6m) and greenfields (12–18m).
| Partner | Role | 2024 metric |
|---|---|---|
| Franchisees | Capital, ops | 8,300 hotels |
| Developers | Sites, pipeline | Conversions 3–6m |
| OTAs | Distribution | ~40% bookings |
| Corp/MICE | B2B demand | ~30% room nights |
What is included in the product
 Detailed Word Document
A concise, pre-written Business Model Canvas for H World Group detailing customer segments, channels, value propositions, revenue streams, key activities, resources, partners, cost structure, and governance; reflects real-world operations, highlights competitive advantages, and includes SWOT-linked insights to support presentations, funding discussions, and strategic decision-making.

 Customizable Excel Spreadsheet
High-level, editable Business Model Canvas for H World Group that condenses strategy into a single page, saving hours of formatting and helping teams quickly identify and adapt core components for boardrooms, comparisons, or fast deliverables.
Activities

Hotel operations and service delivery
Daily operations at H World ensure consistent room quality, cleanliness and guest experience across a portfolio exceeding 8,000 hotels in 2024; strict SOPs control costs and outcomes, while regular staff training and audits sustain brand standards. Operational excellence underpins higher repeat stays and online reviews, supported by a loyalty program with tens of millions of members and chain-wide occupancy near industry levels.
Franchise and owner support
Onboarding, clear design guidelines, and opening support reduce franchise ramp-up time and leverage H World’s scale—over 8,000 hotels in 2024—to accelerate revenue generation. Ongoing training, centralized procurement, and performance coaching improve unit-level profitability and drive consistency across brands. Central services simplify owner operations by consolidating back-office functions and supplier contracts. Transparent, standardized reporting fosters owner trust and accountability.

Revenue and yield management
Dynamic pricing optimizes RevPAR across seasons, segments and channels, driving yield uplift; H World reported operating over 8,500 hotels and ~600,000 rooms by 2024 to scale pricing leverage. Forecasting and inventory controls balance direct versus OTA demand, reducing commission drag. Promotional calendars and length-of-stay rules smooth occupancy peaks and troughs, while data-driven tactics protect brand rate integrity and ADR.

Brand and product development
H World maintains a multi-brand architecture covering economy to upscale, enabling demand segmentation and yield management. Renovation cycles of 5–7 years and rolling room prototypes keep products competitive and protect RevPAR. Real-time guest insight (NPS, OTA reviews, in-app metrics) drives amenities and digital features while localization adapts concepts to city and traveler profiles by 2024.
- portfolio: multi-brand economy→upscale
- renovation: 5–7 year cycles
- guest-insight: NPS/OTA/in-app
- localization: city & traveler tailoring
Technology and loyalty operations
CRS, PMS, mobile app and API integrations enable seamless booking-to-stay flows for H World (ticker HTHT), supporting digital check-in and 24/7 service; group-wide automation lowered front-desk transactions and industry reports show automation can reduce cost-to-serve by ~25% in hospitality. Loyalty program design increases repeat frequency and share of wallet, while strict data governance (GDPR/China PIPL alignment) turns guest data into actionable insights.
- CRS/PMS/app/integrations: seamless bookings
- Loyalty: boosts frequency and wallet share
- Data governance: privacy + analytics
- Automation: ~25% cost-to-serve reduction
Scaled hotel operator driving RevPAR with SOPs, dynamic pricing, 8,500+ hotels, 600K rooms
H World runs daily ops across >8,500 hotels (~600,000 rooms in 2024), enforcing SOPs, 5–7 year renovations and centralized procurement to protect RevPAR. Dynamic pricing, CRS/PMS/app integrations and automation (~25% cost-to-serve reduction) maximize yield and lower costs. Loyalty (~30M members in 2024), training and owner services speed openings and boost repeat stays.
| Metric | 2024 |
|---|---|
| Hotels | 8,500+ |
| Rooms | ~600,000 |
| Loyalty members | ~30M |
| Automation impact | ~25% cost-to-serve |
Full Document Unlocks After Purchase
Business Model Canvas
The document you're previewing is the actual H World Group Business Model Canvas, not a mockup. When you purchase, you'll receive this exact file with all sections included, ready to edit and present. Delivered in editable formats, it contains the full content and layout shown here—no surprises.

Preview the Business Model Canvas: strategic playbook for a global hospitality group
Unlock H World Group’s strategic playbook with our concise Business Model Canvas preview. Discover the company’s core value propositions, revenue levers, and partnership network in a clear, actionable format. Buy the full Canvas to get the complete nine-block breakdown—ready for benchmarking, presentations, and execution.
Partnerships
Franchisees and hotel owners
Franchisees supply capital, properties and local market access while adopting H World’s operating standards across a network of over 7,500 hotels (2024), enabling rapid scale. H World supplies brand, tech and operational playbooks that lift occupancy and RevPAR, with management systems and loyalty integration across millions of members. Fee structures align incentives by tying base fees plus performance-linked bonuses to RevPAR growth, and 10–20 year contracts strengthen network stability.
Real estate developers and landlords
Real estate developers and landlords enable H World to grow rapidly through leases, conversions and greenfield projects, supporting a portfolio of over 8,000 hotels by 2024. H World secures favorable lease and conversion terms by delivering reliable demand and strong brand pull to partners. Pipeline visibility — often thousands of rooms planned — reduces market-entry risk and cuts time-to-open (conversions 3–6 months, greenfield 12–18 months). Strategic sites expand market coverage and capture guest loyalty.
Online travel agencies and distribution partners
OTAs, meta-search and GDS partners expand H World Group’s visibility and reach across channels, supporting distribution for over 8,300 hotels as of 2024 and tapping into OTAs’ ~40% share of online hotel bookings globally in 2024. Balanced distribution lowers dependency on any single channel, smoothing customer-acquisition-cost volatility and improving resilience. Data-sharing with partners enhances dynamic pricing, content quality and conversion rates, while preferential placements help fill need periods and new openings.
Technology and payment ecosystem
- Partners: PMS, CRS, cloud, cybersecurity, AI, payments
- Capabilities: mobile check-in, dynamic pricing, fast settlement
- 2024 focus: API-first roadmaps, scalability, compliance
- Outcome: lower operational risk, faster innovation
Corporate travel, MICE, and mobility alliances
Corporate TMCs, airlines, rail operators and local tourism bureaus supplied steady B2B demand for H World in 2024, with corporate/MICE contributing roughly 30% of urban room nights; bundled rates and negotiated contracts improved occupancy mix by an estimated 5–8%, while MICE organizers booked meeting spaces across H World’s multi-brand footprint.
- Corporate share ~30%
- Occupancy lift 5–8%
- MICE cross-brand bookings
- Co-marketing boosts loyalty enrollment
8,300 hotels franchise network: OTAs ~40% bookings, occupancy +5-8%
Franchisees provide capital, properties and local distribution across 8,300 hotels (2024) under 10–20 year contracts enabling rapid scale. H World supplies brand, tech, loyalty and fee+performance models that lift RevPAR; corporate/MICE ≈30% urban room nights, occupancy +5–8%. OTAs (~40% online bookings), tech vendors (API-first) and developers shorten conversions (3–6m) and greenfields (12–18m).
| Partner | Role | 2024 metric |
|---|---|---|
| Franchisees | Capital, ops | 8,300 hotels |
| Developers | Sites, pipeline | Conversions 3–6m |
| OTAs | Distribution | ~40% bookings |
| Corp/MICE | B2B demand | ~30% room nights |
What is included in the product
Detailed Word Document
A concise, pre-written Business Model Canvas for H World Group detailing customer segments, channels, value propositions, revenue streams, key activities, resources, partners, cost structure, and governance; reflects real-world operations, highlights competitive advantages, and includes SWOT-linked insights to support presentations, funding discussions, and strategic decision-making.
Customizable Excel Spreadsheet
High-level, editable Business Model Canvas for H World Group that condenses strategy into a single page, saving hours of formatting and helping teams quickly identify and adapt core components for boardrooms, comparisons, or fast deliverables.
Activities
Hotel operations and service delivery
Daily operations at H World ensure consistent room quality, cleanliness and guest experience across a portfolio exceeding 8,000 hotels in 2024; strict SOPs control costs and outcomes, while regular staff training and audits sustain brand standards. Operational excellence underpins higher repeat stays and online reviews, supported by a loyalty program with tens of millions of members and chain-wide occupancy near industry levels.
Franchise and owner support
Onboarding, clear design guidelines, and opening support reduce franchise ramp-up time and leverage H World’s scale—over 8,000 hotels in 2024—to accelerate revenue generation. Ongoing training, centralized procurement, and performance coaching improve unit-level profitability and drive consistency across brands. Central services simplify owner operations by consolidating back-office functions and supplier contracts. Transparent, standardized reporting fosters owner trust and accountability.
Revenue and yield management
Dynamic pricing optimizes RevPAR across seasons, segments and channels, driving yield uplift; H World reported operating over 8,500 hotels and ~600,000 rooms by 2024 to scale pricing leverage. Forecasting and inventory controls balance direct versus OTA demand, reducing commission drag. Promotional calendars and length-of-stay rules smooth occupancy peaks and troughs, while data-driven tactics protect brand rate integrity and ADR.
Brand and product development
H World maintains a multi-brand architecture covering economy to upscale, enabling demand segmentation and yield management. Renovation cycles of 5–7 years and rolling room prototypes keep products competitive and protect RevPAR. Real-time guest insight (NPS, OTA reviews, in-app metrics) drives amenities and digital features while localization adapts concepts to city and traveler profiles by 2024.
- portfolio: multi-brand economy→upscale
- renovation: 5–7 year cycles
- guest-insight: NPS/OTA/in-app
- localization: city & traveler tailoring
Technology and loyalty operations
CRS, PMS, mobile app and API integrations enable seamless booking-to-stay flows for H World (ticker HTHT), supporting digital check-in and 24/7 service; group-wide automation lowered front-desk transactions and industry reports show automation can reduce cost-to-serve by ~25% in hospitality. Loyalty program design increases repeat frequency and share of wallet, while strict data governance (GDPR/China PIPL alignment) turns guest data into actionable insights.
- CRS/PMS/app/integrations: seamless bookings
- Loyalty: boosts frequency and wallet share
- Data governance: privacy + analytics
- Automation: ~25% cost-to-serve reduction
Scaled hotel operator driving RevPAR with SOPs, dynamic pricing, 8,500+ hotels, 600K rooms
H World runs daily ops across >8,500 hotels (~600,000 rooms in 2024), enforcing SOPs, 5–7 year renovations and centralized procurement to protect RevPAR. Dynamic pricing, CRS/PMS/app integrations and automation (~25% cost-to-serve reduction) maximize yield and lower costs. Loyalty (~30M members in 2024), training and owner services speed openings and boost repeat stays.
| Metric | 2024 |
|---|---|
| Hotels | 8,500+ |
| Rooms | ~600,000 |
| Loyalty members | ~30M |
| Automation impact | ~25% cost-to-serve |
Full Document Unlocks After Purchase
Business Model Canvas
The document you're previewing is the actual H World Group Business Model Canvas, not a mockup. When you purchase, you'll receive this exact file with all sections included, ready to edit and present. Delivered in editable formats, it contains the full content and layout shown here—no surprises.
Original: $10.00
-65%$10.00
$3.50Description
Preview the Business Model Canvas: strategic playbook for a global hospitality group
Unlock H World Group’s strategic playbook with our concise Business Model Canvas preview. Discover the company’s core value propositions, revenue levers, and partnership network in a clear, actionable format. Buy the full Canvas to get the complete nine-block breakdown—ready for benchmarking, presentations, and execution.
Partnerships
Franchisees and hotel owners
Franchisees supply capital, properties and local market access while adopting H World’s operating standards across a network of over 7,500 hotels (2024), enabling rapid scale. H World supplies brand, tech and operational playbooks that lift occupancy and RevPAR, with management systems and loyalty integration across millions of members. Fee structures align incentives by tying base fees plus performance-linked bonuses to RevPAR growth, and 10–20 year contracts strengthen network stability.
Real estate developers and landlords
Real estate developers and landlords enable H World to grow rapidly through leases, conversions and greenfield projects, supporting a portfolio of over 8,000 hotels by 2024. H World secures favorable lease and conversion terms by delivering reliable demand and strong brand pull to partners. Pipeline visibility — often thousands of rooms planned — reduces market-entry risk and cuts time-to-open (conversions 3–6 months, greenfield 12–18 months). Strategic sites expand market coverage and capture guest loyalty.
Online travel agencies and distribution partners
OTAs, meta-search and GDS partners expand H World Group’s visibility and reach across channels, supporting distribution for over 8,300 hotels as of 2024 and tapping into OTAs’ ~40% share of online hotel bookings globally in 2024. Balanced distribution lowers dependency on any single channel, smoothing customer-acquisition-cost volatility and improving resilience. Data-sharing with partners enhances dynamic pricing, content quality and conversion rates, while preferential placements help fill need periods and new openings.
Technology and payment ecosystem
- Partners: PMS, CRS, cloud, cybersecurity, AI, payments
- Capabilities: mobile check-in, dynamic pricing, fast settlement
- 2024 focus: API-first roadmaps, scalability, compliance
- Outcome: lower operational risk, faster innovation
Corporate travel, MICE, and mobility alliances
Corporate TMCs, airlines, rail operators and local tourism bureaus supplied steady B2B demand for H World in 2024, with corporate/MICE contributing roughly 30% of urban room nights; bundled rates and negotiated contracts improved occupancy mix by an estimated 5–8%, while MICE organizers booked meeting spaces across H World’s multi-brand footprint.
- Corporate share ~30%
- Occupancy lift 5–8%
- MICE cross-brand bookings
- Co-marketing boosts loyalty enrollment
8,300 hotels franchise network: OTAs ~40% bookings, occupancy +5-8%
Franchisees provide capital, properties and local distribution across 8,300 hotels (2024) under 10–20 year contracts enabling rapid scale. H World supplies brand, tech, loyalty and fee+performance models that lift RevPAR; corporate/MICE ≈30% urban room nights, occupancy +5–8%. OTAs (~40% online bookings), tech vendors (API-first) and developers shorten conversions (3–6m) and greenfields (12–18m).
| Partner | Role | 2024 metric |
|---|---|---|
| Franchisees | Capital, ops | 8,300 hotels |
| Developers | Sites, pipeline | Conversions 3–6m |
| OTAs | Distribution | ~40% bookings |
| Corp/MICE | B2B demand | ~30% room nights |
What is included in the product
Detailed Word Document
A concise, pre-written Business Model Canvas for H World Group detailing customer segments, channels, value propositions, revenue streams, key activities, resources, partners, cost structure, and governance; reflects real-world operations, highlights competitive advantages, and includes SWOT-linked insights to support presentations, funding discussions, and strategic decision-making.
Customizable Excel Spreadsheet
High-level, editable Business Model Canvas for H World Group that condenses strategy into a single page, saving hours of formatting and helping teams quickly identify and adapt core components for boardrooms, comparisons, or fast deliverables.
Activities
Hotel operations and service delivery
Daily operations at H World ensure consistent room quality, cleanliness and guest experience across a portfolio exceeding 8,000 hotels in 2024; strict SOPs control costs and outcomes, while regular staff training and audits sustain brand standards. Operational excellence underpins higher repeat stays and online reviews, supported by a loyalty program with tens of millions of members and chain-wide occupancy near industry levels.
Franchise and owner support
Onboarding, clear design guidelines, and opening support reduce franchise ramp-up time and leverage H World’s scale—over 8,000 hotels in 2024—to accelerate revenue generation. Ongoing training, centralized procurement, and performance coaching improve unit-level profitability and drive consistency across brands. Central services simplify owner operations by consolidating back-office functions and supplier contracts. Transparent, standardized reporting fosters owner trust and accountability.
Revenue and yield management
Dynamic pricing optimizes RevPAR across seasons, segments and channels, driving yield uplift; H World reported operating over 8,500 hotels and ~600,000 rooms by 2024 to scale pricing leverage. Forecasting and inventory controls balance direct versus OTA demand, reducing commission drag. Promotional calendars and length-of-stay rules smooth occupancy peaks and troughs, while data-driven tactics protect brand rate integrity and ADR.
Brand and product development
H World maintains a multi-brand architecture covering economy to upscale, enabling demand segmentation and yield management. Renovation cycles of 5–7 years and rolling room prototypes keep products competitive and protect RevPAR. Real-time guest insight (NPS, OTA reviews, in-app metrics) drives amenities and digital features while localization adapts concepts to city and traveler profiles by 2024.
- portfolio: multi-brand economy→upscale
- renovation: 5–7 year cycles
- guest-insight: NPS/OTA/in-app
- localization: city & traveler tailoring
Technology and loyalty operations
CRS, PMS, mobile app and API integrations enable seamless booking-to-stay flows for H World (ticker HTHT), supporting digital check-in and 24/7 service; group-wide automation lowered front-desk transactions and industry reports show automation can reduce cost-to-serve by ~25% in hospitality. Loyalty program design increases repeat frequency and share of wallet, while strict data governance (GDPR/China PIPL alignment) turns guest data into actionable insights.
- CRS/PMS/app/integrations: seamless bookings
- Loyalty: boosts frequency and wallet share
- Data governance: privacy + analytics
- Automation: ~25% cost-to-serve reduction
Scaled hotel operator driving RevPAR with SOPs, dynamic pricing, 8,500+ hotels, 600K rooms
H World runs daily ops across >8,500 hotels (~600,000 rooms in 2024), enforcing SOPs, 5–7 year renovations and centralized procurement to protect RevPAR. Dynamic pricing, CRS/PMS/app integrations and automation (~25% cost-to-serve reduction) maximize yield and lower costs. Loyalty (~30M members in 2024), training and owner services speed openings and boost repeat stays.
| Metric | 2024 |
|---|---|
| Hotels | 8,500+ |
| Rooms | ~600,000 |
| Loyalty members | ~30M |
| Automation impact | ~25% cost-to-serve |
Full Document Unlocks After Purchase
Business Model Canvas
The document you're previewing is the actual H World Group Business Model Canvas, not a mockup. When you purchase, you'll receive this exact file with all sections included, ready to edit and present. Delivered in editable formats, it contains the full content and layout shown here—no surprises.











