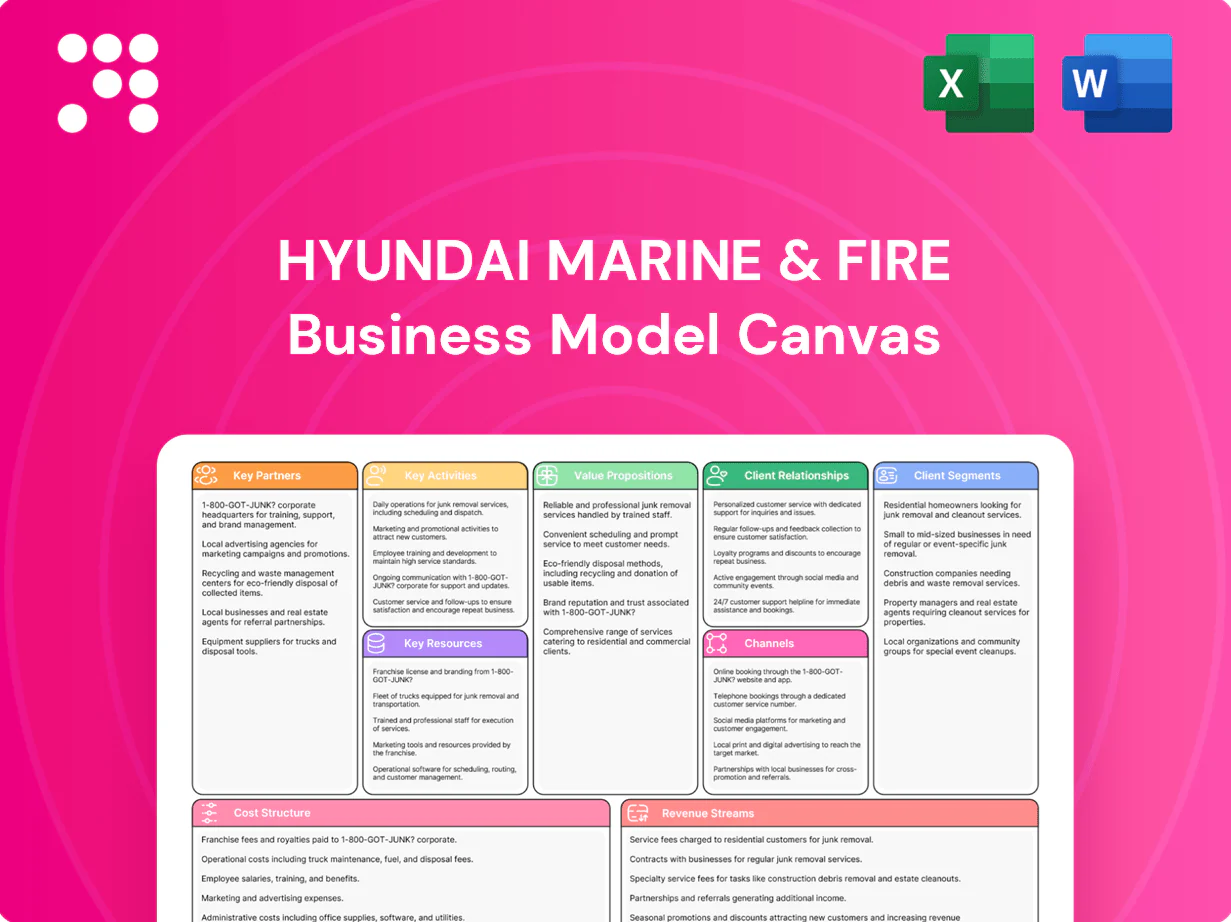
Hyundai Marine & Fire Business Model Canvas

Business Model Canvas: Strategic blueprint for marine and fire insurers
Unlock the strategic blueprint behind Hyundai Marine & Fire with our Business Model Canvas. This concise, actionable canvas maps value propositions, key partners, revenue streams and cost drivers to reveal competitive advantages and growth levers. Ideal for investors, consultants and founders seeking ready-to-use insights. Download the full Word/Excel canvas to benchmark strategy and accelerate decisions.
Partnerships

Reinsurers
Global reinsurance partners help Hyundai Marine & Fire diversify and transfer catastrophic risk across portfolios, stabilizing loss ratios and protecting capital adequacy during large events. Co-developing facultative and treaty structures with reinsurers supports more competitive pricing and tailored capacity. Long-term ties improve claims recoveries and expand underwriting capacity for peak perils.
Auto Ecosystem
OEMs, dealers and repair networks enable bundled auto policies and seamless claims repairs across Hyundai’s channels, with embedded point-of-sale insurance lifting conversion by up to 40% (industry studies, 2024). Preferential parts and labor agreements cut loss costs ~10–15% and repair cycle time ~25%, while telematics partners support usage-based and safe-driving products that reduce claim frequency ~20%.

Agents & Brokers
Tied agents and independent brokers extend Hyundai Marine & Fire’s reach to retail and corporate clients, leveraging its position as a top-five South Korean non-life insurer (2024). They supply local market insight and advisory sales while performance-based agreements align acquisition costs with growth through commission structures tied to retention. Ongoing training and digital tools improve agent productivity and regulatory compliance.

Healthcare & Assist
Hospitals, clinics and assistance providers form medical networks and 24/7 roadside help, linking thousands of provider sites to Hyundai Marine & Fire.
Preferred networks boost customer experience and cost control; direct billing cuts friction and leakage; international assistance covers 150+ countries for travel and marine claims.
- 24/7
- thousands of providers
- 150+ countries
Tech & Data
Insurtechs, data vendors and cloud providers power Hyundai Marine & Fire analytics, fraud detection and digital servicing; API-led integration cuts quote-to-issue and claims cycles by up to 40%. Cybersecurity partners protect sensitive policyholder data as global security spend topped ~200B USD in 2024. Joint R&D accelerates product innovation and personalization, lifting retention 15-25%.
- Insurtechs: rapid ML fraud detection
- APIs: quote-to-issue ≤40% faster
- Cloud: scalable analytics
- Cybersecurity: 2024 spend ~200B USD
Embedded insurance slashes repair time 25%, cuts losses and boosts conversions
Reinsurers stabilize capital and reduce catastrophe exposure, enabling competitive facultative/treaty capacity. OEMs/dealers and repair networks embed insurance at sale, cutting repair time ~25% and loss costs ~10–15%, boosting conversions up to 40% (2024). Brokers, insurtechs and data/cloud/cyber partners drive distribution, analytics and fraud reduction, cutting cycle times ≤40% and supporting global assistance in 150+ countries.
| Partner | Role | Key metric (2024) |
|---|---|---|
| Reinsurers | Risk transfer | Stabilize loss ratios |
| OEMs/Repair | Embedded sales/repairs | Conv +40% / repair -25% |
| Insurtechs/Cloud | Analytics/API | Cycle ≤40% / cyber spend ~200B |
What is included in the product
 Detailed Word Document
A comprehensive, pre-written Business Model Canvas for Hyundai Marine & Fire Insurance detailing customer segments, channels, value propositions, revenue streams, key resources and partnerships across the 9 classic BMC blocks, with linked SWOT and competitive-advantage analysis—designed for presentations, funding discussions, and strategic decision-making.

 Customizable Excel Spreadsheet
Condenses Hyundai Marine & Fire’s insurance strategy into a digestible one-page business snapshot, saving hours of structuring while highlighting key risk pools, distribution channels, and value propositions for fast decision-making and team alignment.
Activities

Underwriting
Underwriting at Hyundai Marine & Fire manages risk selection and pricing across 5 lines: auto, property, casualty, marine and long-term, using actuarial models plus credit and telematics inputs to refine rates. Portfolio steering targets balance between growth and profitability, with underwriting authorities set by product and segment. Continuous monitoring of loss emergence and exposure adjusts acceptance criteria and limits in near real-time.
Claims Handling
End-to-end claims intake, investigation and settlement focus on speed and fairness, leveraging digital FNOL to shorten cycle times—McKinsey reports digital FNOL can cut claim cycle time by 30–50%.
Use of approved repair/medical networks and fraud analytics reduces leakage and indemnity drift; industry studies (Deloitte/McKinsey) show analytics can lower leakage by roughly 15–25%.
Post-loss service, including concierge repairs and rapid indemnity, boosts retention and referral rates, improving customer lifetime value and loss-adjusted retention metrics.

Risk Management
Enterprise risk governance integrates catastrophe modeling and reinsurance optimization to limit peak exposure and preserve capital; capital management targets regulatory solvency ratios and liquidity buffers to meet supervisory requirements; regular stress testing calibrates risk appetite and capital plans; disciplined reserving underpins earnings stability and long-term loss recognition.

Product Development
Design and refine individual and corporate policies with sector-specific endorsements and marine cargo solutions, piloting telematics and pay-how-you-drive bundles to drive retention and loss control. 2024 pilots in Korea showed telematics programs reduced claim frequency by about 18%, supporting A/B test–driven rollouts and iterative product refinement. Use bundled offers and feedback loops to scale profitable segments.
- Policy design: sector endorsements
- Products: marine cargo, corporate
- Telematics: pay-how-you-drive (~18% fewer claims)
- Testing: A/B, feedback loops
Distribution & Marketing
- Agents & branches coordination
- Digital funnels & campaigns
- CRM-driven targeting
- Training & incentives
Telematics and digital FNOL drive lower claims (~18%) and faster settlement (30–50%)
Underwriting, claims, product design, distribution and enterprise risk form core activities, using actuarial models, telematics pilots (2024: ~18% fewer claims) and portfolio steering to balance growth and profitability. Digital FNOL cuts claim cycle time ~30–50% and fraud/analytics lower leakage ~15–25%, supporting fast, fair settlements and retention. Reinsurance, reserving and stress-testing preserve solvency and capital efficiency.
| Activity | Metric | 2024 |
|---|---|---|
| Telematics | Claim frequency reduction | ~18% |
| Digital FNOL | Cycle time reduction | 30–50% |
| Analytics | Leakage reduction | 15–25% |
What You See Is What You Get
Business Model Canvas
The Hyundai Marine & Fire Business Model Canvas shown here is the exact, live document you’ll receive after purchase; it’s not a mockup or sample. Upon completing your order you’ll get the full file—formatted and ready-to-edit in Word and Excel—with all sections included. No surprises, just the same professional deliverable ready for use.

Business Model Canvas: Strategic blueprint for marine and fire insurers
Unlock the strategic blueprint behind Hyundai Marine & Fire with our Business Model Canvas. This concise, actionable canvas maps value propositions, key partners, revenue streams and cost drivers to reveal competitive advantages and growth levers. Ideal for investors, consultants and founders seeking ready-to-use insights. Download the full Word/Excel canvas to benchmark strategy and accelerate decisions.
Partnerships
Reinsurers
Global reinsurance partners help Hyundai Marine & Fire diversify and transfer catastrophic risk across portfolios, stabilizing loss ratios and protecting capital adequacy during large events. Co-developing facultative and treaty structures with reinsurers supports more competitive pricing and tailored capacity. Long-term ties improve claims recoveries and expand underwriting capacity for peak perils.
Auto Ecosystem
OEMs, dealers and repair networks enable bundled auto policies and seamless claims repairs across Hyundai’s channels, with embedded point-of-sale insurance lifting conversion by up to 40% (industry studies, 2024). Preferential parts and labor agreements cut loss costs ~10–15% and repair cycle time ~25%, while telematics partners support usage-based and safe-driving products that reduce claim frequency ~20%.
Agents & Brokers
Tied agents and independent brokers extend Hyundai Marine & Fire’s reach to retail and corporate clients, leveraging its position as a top-five South Korean non-life insurer (2024). They supply local market insight and advisory sales while performance-based agreements align acquisition costs with growth through commission structures tied to retention. Ongoing training and digital tools improve agent productivity and regulatory compliance.
Healthcare & Assist
Hospitals, clinics and assistance providers form medical networks and 24/7 roadside help, linking thousands of provider sites to Hyundai Marine & Fire.
Preferred networks boost customer experience and cost control; direct billing cuts friction and leakage; international assistance covers 150+ countries for travel and marine claims.
- 24/7
- thousands of providers
- 150+ countries
Tech & Data
Insurtechs, data vendors and cloud providers power Hyundai Marine & Fire analytics, fraud detection and digital servicing; API-led integration cuts quote-to-issue and claims cycles by up to 40%. Cybersecurity partners protect sensitive policyholder data as global security spend topped ~200B USD in 2024. Joint R&D accelerates product innovation and personalization, lifting retention 15-25%.
- Insurtechs: rapid ML fraud detection
- APIs: quote-to-issue ≤40% faster
- Cloud: scalable analytics
- Cybersecurity: 2024 spend ~200B USD
Embedded insurance slashes repair time 25%, cuts losses and boosts conversions
Reinsurers stabilize capital and reduce catastrophe exposure, enabling competitive facultative/treaty capacity. OEMs/dealers and repair networks embed insurance at sale, cutting repair time ~25% and loss costs ~10–15%, boosting conversions up to 40% (2024). Brokers, insurtechs and data/cloud/cyber partners drive distribution, analytics and fraud reduction, cutting cycle times ≤40% and supporting global assistance in 150+ countries.
| Partner | Role | Key metric (2024) |
|---|---|---|
| Reinsurers | Risk transfer | Stabilize loss ratios |
| OEMs/Repair | Embedded sales/repairs | Conv +40% / repair -25% |
| Insurtechs/Cloud | Analytics/API | Cycle ≤40% / cyber spend ~200B |
What is included in the product
Detailed Word Document
A comprehensive, pre-written Business Model Canvas for Hyundai Marine & Fire Insurance detailing customer segments, channels, value propositions, revenue streams, key resources and partnerships across the 9 classic BMC blocks, with linked SWOT and competitive-advantage analysis—designed for presentations, funding discussions, and strategic decision-making.
Customizable Excel Spreadsheet
Condenses Hyundai Marine & Fire’s insurance strategy into a digestible one-page business snapshot, saving hours of structuring while highlighting key risk pools, distribution channels, and value propositions for fast decision-making and team alignment.
Activities
Underwriting
Underwriting at Hyundai Marine & Fire manages risk selection and pricing across 5 lines: auto, property, casualty, marine and long-term, using actuarial models plus credit and telematics inputs to refine rates. Portfolio steering targets balance between growth and profitability, with underwriting authorities set by product and segment. Continuous monitoring of loss emergence and exposure adjusts acceptance criteria and limits in near real-time.
Claims Handling
End-to-end claims intake, investigation and settlement focus on speed and fairness, leveraging digital FNOL to shorten cycle times—McKinsey reports digital FNOL can cut claim cycle time by 30–50%.
Use of approved repair/medical networks and fraud analytics reduces leakage and indemnity drift; industry studies (Deloitte/McKinsey) show analytics can lower leakage by roughly 15–25%.
Post-loss service, including concierge repairs and rapid indemnity, boosts retention and referral rates, improving customer lifetime value and loss-adjusted retention metrics.
Risk Management
Enterprise risk governance integrates catastrophe modeling and reinsurance optimization to limit peak exposure and preserve capital; capital management targets regulatory solvency ratios and liquidity buffers to meet supervisory requirements; regular stress testing calibrates risk appetite and capital plans; disciplined reserving underpins earnings stability and long-term loss recognition.
Product Development
Design and refine individual and corporate policies with sector-specific endorsements and marine cargo solutions, piloting telematics and pay-how-you-drive bundles to drive retention and loss control. 2024 pilots in Korea showed telematics programs reduced claim frequency by about 18%, supporting A/B test–driven rollouts and iterative product refinement. Use bundled offers and feedback loops to scale profitable segments.
- Policy design: sector endorsements
- Products: marine cargo, corporate
- Telematics: pay-how-you-drive (~18% fewer claims)
- Testing: A/B, feedback loops
Distribution & Marketing
- Agents & branches coordination
- Digital funnels & campaigns
- CRM-driven targeting
- Training & incentives
Telematics and digital FNOL drive lower claims (~18%) and faster settlement (30–50%)
Underwriting, claims, product design, distribution and enterprise risk form core activities, using actuarial models, telematics pilots (2024: ~18% fewer claims) and portfolio steering to balance growth and profitability. Digital FNOL cuts claim cycle time ~30–50% and fraud/analytics lower leakage ~15–25%, supporting fast, fair settlements and retention. Reinsurance, reserving and stress-testing preserve solvency and capital efficiency.
| Activity | Metric | 2024 |
|---|---|---|
| Telematics | Claim frequency reduction | ~18% |
| Digital FNOL | Cycle time reduction | 30–50% |
| Analytics | Leakage reduction | 15–25% |
What You See Is What You Get
Business Model Canvas
The Hyundai Marine & Fire Business Model Canvas shown here is the exact, live document you’ll receive after purchase; it’s not a mockup or sample. Upon completing your order you’ll get the full file—formatted and ready-to-edit in Word and Excel—with all sections included. No surprises, just the same professional deliverable ready for use.
Original: $10.00
-65%$10.00
$3.50Description
Business Model Canvas: Strategic blueprint for marine and fire insurers
Unlock the strategic blueprint behind Hyundai Marine & Fire with our Business Model Canvas. This concise, actionable canvas maps value propositions, key partners, revenue streams and cost drivers to reveal competitive advantages and growth levers. Ideal for investors, consultants and founders seeking ready-to-use insights. Download the full Word/Excel canvas to benchmark strategy and accelerate decisions.
Partnerships
Reinsurers
Global reinsurance partners help Hyundai Marine & Fire diversify and transfer catastrophic risk across portfolios, stabilizing loss ratios and protecting capital adequacy during large events. Co-developing facultative and treaty structures with reinsurers supports more competitive pricing and tailored capacity. Long-term ties improve claims recoveries and expand underwriting capacity for peak perils.
Auto Ecosystem
OEMs, dealers and repair networks enable bundled auto policies and seamless claims repairs across Hyundai’s channels, with embedded point-of-sale insurance lifting conversion by up to 40% (industry studies, 2024). Preferential parts and labor agreements cut loss costs ~10–15% and repair cycle time ~25%, while telematics partners support usage-based and safe-driving products that reduce claim frequency ~20%.
Agents & Brokers
Tied agents and independent brokers extend Hyundai Marine & Fire’s reach to retail and corporate clients, leveraging its position as a top-five South Korean non-life insurer (2024). They supply local market insight and advisory sales while performance-based agreements align acquisition costs with growth through commission structures tied to retention. Ongoing training and digital tools improve agent productivity and regulatory compliance.
Healthcare & Assist
Hospitals, clinics and assistance providers form medical networks and 24/7 roadside help, linking thousands of provider sites to Hyundai Marine & Fire.
Preferred networks boost customer experience and cost control; direct billing cuts friction and leakage; international assistance covers 150+ countries for travel and marine claims.
- 24/7
- thousands of providers
- 150+ countries
Tech & Data
Insurtechs, data vendors and cloud providers power Hyundai Marine & Fire analytics, fraud detection and digital servicing; API-led integration cuts quote-to-issue and claims cycles by up to 40%. Cybersecurity partners protect sensitive policyholder data as global security spend topped ~200B USD in 2024. Joint R&D accelerates product innovation and personalization, lifting retention 15-25%.
- Insurtechs: rapid ML fraud detection
- APIs: quote-to-issue ≤40% faster
- Cloud: scalable analytics
- Cybersecurity: 2024 spend ~200B USD
Embedded insurance slashes repair time 25%, cuts losses and boosts conversions
Reinsurers stabilize capital and reduce catastrophe exposure, enabling competitive facultative/treaty capacity. OEMs/dealers and repair networks embed insurance at sale, cutting repair time ~25% and loss costs ~10–15%, boosting conversions up to 40% (2024). Brokers, insurtechs and data/cloud/cyber partners drive distribution, analytics and fraud reduction, cutting cycle times ≤40% and supporting global assistance in 150+ countries.
| Partner | Role | Key metric (2024) |
|---|---|---|
| Reinsurers | Risk transfer | Stabilize loss ratios |
| OEMs/Repair | Embedded sales/repairs | Conv +40% / repair -25% |
| Insurtechs/Cloud | Analytics/API | Cycle ≤40% / cyber spend ~200B |
What is included in the product
Detailed Word Document
A comprehensive, pre-written Business Model Canvas for Hyundai Marine & Fire Insurance detailing customer segments, channels, value propositions, revenue streams, key resources and partnerships across the 9 classic BMC blocks, with linked SWOT and competitive-advantage analysis—designed for presentations, funding discussions, and strategic decision-making.
Customizable Excel Spreadsheet
Condenses Hyundai Marine & Fire’s insurance strategy into a digestible one-page business snapshot, saving hours of structuring while highlighting key risk pools, distribution channels, and value propositions for fast decision-making and team alignment.
Activities
Underwriting
Underwriting at Hyundai Marine & Fire manages risk selection and pricing across 5 lines: auto, property, casualty, marine and long-term, using actuarial models plus credit and telematics inputs to refine rates. Portfolio steering targets balance between growth and profitability, with underwriting authorities set by product and segment. Continuous monitoring of loss emergence and exposure adjusts acceptance criteria and limits in near real-time.
Claims Handling
End-to-end claims intake, investigation and settlement focus on speed and fairness, leveraging digital FNOL to shorten cycle times—McKinsey reports digital FNOL can cut claim cycle time by 30–50%.
Use of approved repair/medical networks and fraud analytics reduces leakage and indemnity drift; industry studies (Deloitte/McKinsey) show analytics can lower leakage by roughly 15–25%.
Post-loss service, including concierge repairs and rapid indemnity, boosts retention and referral rates, improving customer lifetime value and loss-adjusted retention metrics.
Risk Management
Enterprise risk governance integrates catastrophe modeling and reinsurance optimization to limit peak exposure and preserve capital; capital management targets regulatory solvency ratios and liquidity buffers to meet supervisory requirements; regular stress testing calibrates risk appetite and capital plans; disciplined reserving underpins earnings stability and long-term loss recognition.
Product Development
Design and refine individual and corporate policies with sector-specific endorsements and marine cargo solutions, piloting telematics and pay-how-you-drive bundles to drive retention and loss control. 2024 pilots in Korea showed telematics programs reduced claim frequency by about 18%, supporting A/B test–driven rollouts and iterative product refinement. Use bundled offers and feedback loops to scale profitable segments.
- Policy design: sector endorsements
- Products: marine cargo, corporate
- Telematics: pay-how-you-drive (~18% fewer claims)
- Testing: A/B, feedback loops
Distribution & Marketing
- Agents & branches coordination
- Digital funnels & campaigns
- CRM-driven targeting
- Training & incentives
Telematics and digital FNOL drive lower claims (~18%) and faster settlement (30–50%)
Underwriting, claims, product design, distribution and enterprise risk form core activities, using actuarial models, telematics pilots (2024: ~18% fewer claims) and portfolio steering to balance growth and profitability. Digital FNOL cuts claim cycle time ~30–50% and fraud/analytics lower leakage ~15–25%, supporting fast, fair settlements and retention. Reinsurance, reserving and stress-testing preserve solvency and capital efficiency.
| Activity | Metric | 2024 |
|---|---|---|
| Telematics | Claim frequency reduction | ~18% |
| Digital FNOL | Cycle time reduction | 30–50% |
| Analytics | Leakage reduction | 15–25% |
What You See Is What You Get
Business Model Canvas
The Hyundai Marine & Fire Business Model Canvas shown here is the exact, live document you’ll receive after purchase; it’s not a mockup or sample. Upon completing your order you’ll get the full file—formatted and ready-to-edit in Word and Excel—with all sections included. No surprises, just the same professional deliverable ready for use.











