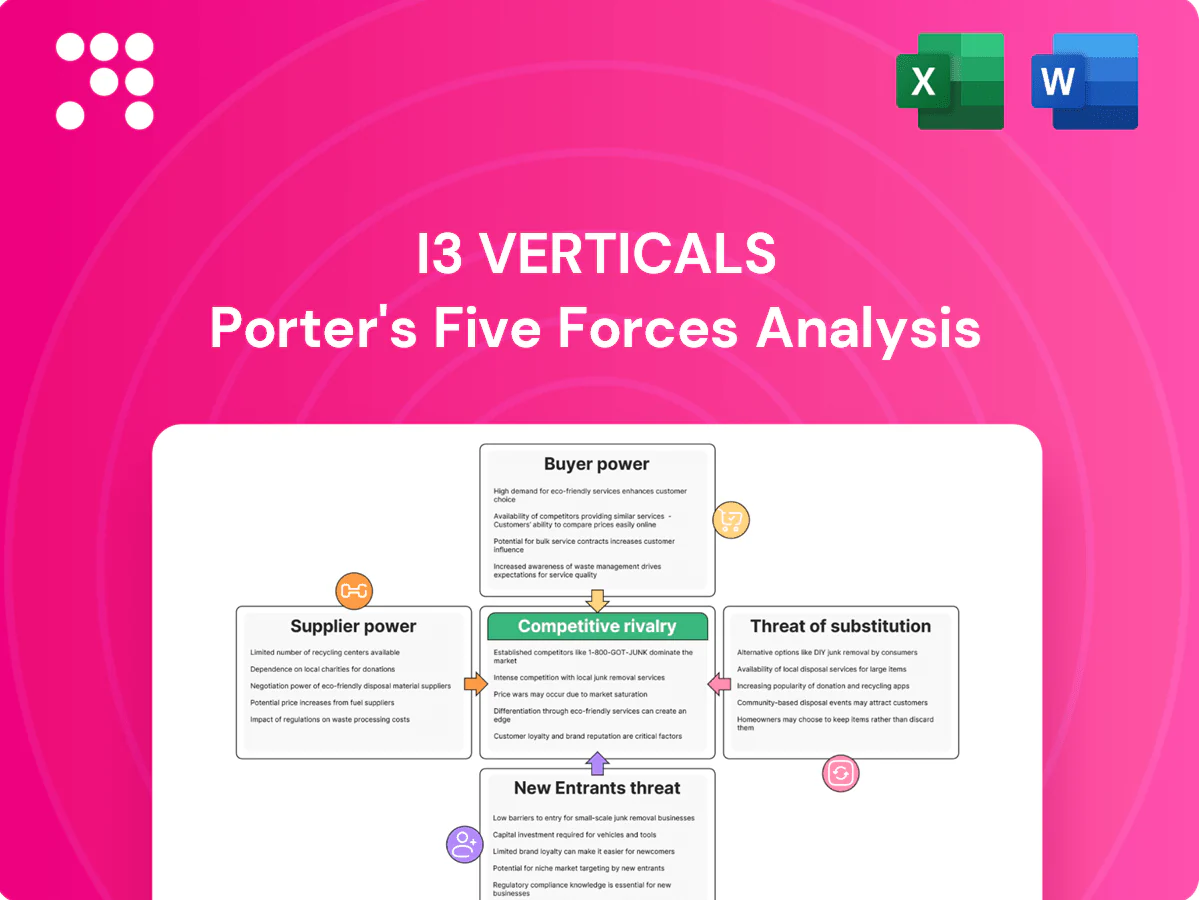
i3 Verticals Porter's Five Forces Analysis

Elevate Your Analysis with the Complete Porter's Five Forces Analysis
i3 Verticals’ Porter’s Five Forces snapshot highlights moderate buyer power, fragmented supplier influence, rising fintech substitutes, and barriers tempering new entrants—painting a nuanced competitive picture. This brief teaser teases actionable risks and strategic levers. Unlock the full Porter’s Five Forces Analysis to get force-by-force ratings, visuals, and tactical recommendations tailored to i3 Verticals.
Suppliers Bargaining Power

Card networks and sponsor banks
i3 Verticals depends on Visa, Mastercard and sponsor/acquiring banks for core rails and licensing, with the two networks controlling roughly 80% of U.S. card purchase volume. Networks and banks impose interchange, assessments and operating rules that typically total about 1.5–3% of transaction value, constraining pricing flexibility. Volume rebates mitigate costs, but negotiating leverage favors the large networks, so any rule or fee change can quickly compress margins.
ISV and POS hardware partners
Integrated software vendors and POS OEMs control critical endpoints and user experience and can demand rev-share, certification priority, or exclusivity within vertical stacks, increasing supplier leverage over i3 Verticals. Fragmentation across hundreds of ISVs tempers this power, though leading niche ISVs and hardware partners can exert outsized influence. Certification and ongoing support obligations create switching frictions and raise integration costs for i3 Verticals.

Cloud and data infrastructure
Dependence on cloud hosting, security and data vendors creates recurring opex for i3 Verticals, with top cloud providers controlling the market (AWS ~32%, Microsoft Azure ~23%, Google Cloud ~11% in 2024 per Synergy Research), constraining pricing power. Providers are substitutable but migration costs and uptime requirements limit switching; premium security/compliance features command higher fees. Outages or sudden price hikes can erode SLAs and gross margins.

Fraud, KYC, and compliance vendors
Third-party AML, KYC and fraud vendors are embedded in i3 Verticals underwriting; their model performance directly shifts approval rates and merchant conversion—studies in 2024 show optimization can lift conversion by 3–7% while reducing chargeback losses similarly.
- 2024 AML/KYC market ~3.2B USD — rising vendor pricing
- Top models command premium fees, raising per-merchant cost
- Regulatory changes (e.g., enhanced CDD) increase vendor dependence
Payment device manufacturers
Certified terminals and peripherals must comply with PCI PTS, PCI PIN and network approvals; these certifications remained mandatory in 2024 for EMV and contactless acceptance, constraining eligible devices. Limited certified form factors give OEMs leverage in pricing and OEM negotiation; lead times and global component shortages have disrupted rollouts. Volume commitments are often required to secure pricing and availability.
- Certification: PCI PTS/PIN required (2024)
- Supplier leverage: limited certified form factors
- Risk: lead-time and component constraints
- Mitigation: volume commitments to lock pricing
Supplier concentration, interchange (1.5–3%) plus cloud & AML costs squeeze margins
i3 Verticals faces strong supplier power from card networks (Visa/Mastercard ~80% U.S. volume) driving interchange/assessments ~1.5–3% that limit pricing. Cloud providers (AWS 32%, Azure 23%, GCP 11% in 2024) and certified terminal OEMs exert leverage via pricing, certifications and lead times. AML/KYC market ~$3.2B (2024) raises per-merchant costs and switching friction.
| Supplier | 2024 Metric | Impact |
|---|---|---|
| Card networks | ~80% U.S. volume; fees 1.5–3% | High pricing pressure |
| Cloud | AWS 32%/Azure 23%/GCP 11% | Opex, switching cost |
| AML/KYC | $3.2B market | Higher per-merchant fees |
| Terminals | PCI PTS/PIN mandatory (2024) | Supply constraints, lead times |
What is included in the product
 Detailed Word Document
Uncovers key drivers of competition, supplier and buyer power, entry barriers, and substitute threats specific to i3 Verticals, with strategic commentary on disruptive risks and defensive levers.

 Customizable Excel Spreadsheet
One-sheet Porter's Five Forces for i3 Verticals—clear, slide-ready summary to speed strategic decisions; instantly visualize competitive pressure with a radar chart and tweak force levels as market data evolves. Clean layout, no macros, and easy integration into decks or Excel dashboards for quick boardroom use.
Customers Bargaining Power

Enterprise and public sector RFPs
Enterprise and public sector RFPs for government, education, and healthcare are highly structured, often requiring SOC 2, PCI DSS and HIPAA compliance and strong referenceability to win; procurement cycles commonly span 9–18 months. Buyers demand custom features, integrations, preferential pricing and concessions on rates and service levels; contract lengths typically run 3–5 years with negotiated discounts and SLAs.
SMBs with multi-homing
SMBs frequently multi-home, keeping bargaining power high as switching costs are modest and industry reports in 2024 cite POS/processor churn around 15–25% annually. Transparent fintech pricing has raised price sensitivity, while month-to-month contracts and free hardware offers further elevate churn risk. Value-add software (e.g., POS integrations, CRM) can lower churn but does not eliminate the underlying price pressure.

Vertical integration stickiness
Where i3 embeds payments into workflow software, customer switching costs rise as data migration, staff retraining and re‑certification create measurable friction; embedded-payments adoption grew about 25% in 2024, reinforcing platform lock‑in. Sticky modules reduce buyer power and support premium bundling and higher ARPU, though buyers still press for feature roadmaps and strict support SLAs.

Interchange pass-through transparency
Many buyers now demand interchange-plus transparency; industry practice in 2024 commonly delivers visible interchange passthrough and negotiable processor markups, driving downward pressure on margins and ancillary fees.
Surcharging and convenience-fee rules shift net economics and merchant tolerance for rates, while plentiful competitors and online price comparisons make competitive quotes easy to obtain, accelerating fee compression.
- Interchange-plus transparency
- Negotiated processor margins
- Surcharging alters economics
- Easy competitive quotes
Demand for omnichannel and uptime
Buyers demand seamless in-person, online, and mobile acceptance, forcing i3 Verticals to invest in omnichannel integrations and high-availability infrastructure.
Stringent SLA and redundancy expectations raise service costs, while penalty clauses for downtime transfer financial and reputational risk to the provider, strengthening buyers’ leverage in contract negotiations.
- omnichannel requirement increases integration spend
- SLA and redundancy drive higher operating costs
- penalty clauses shift downtime risk to provider
- elevated expectations amplify buyer bargaining power
Buyers wield leverage: enterprise RFPs, SMB churn 15–25%, embedded +25%
Buyers exert high leverage: enterprise RFPs (procure 9–18 months) demand SOC2/PCI/HIPAA, 3–5yr contracts and negotiated SLAs; SMBs churn 15–25% (2024) with price sensitivity and month-to-month terms. Embedded-payments adoption rose ~25% in 2024, raising switching costs and ARPU, but interchange-plus transparency and easy quoting compress margins. Omnichannel and strict SLAs push integration and uptime costs, strengthening buyer negotiation power.
| Buyer Segment | Power (0–10) | Key metric (2024) |
|---|---|---|
| Enterprise/Public | 9 | Procure 9–18mo; 3–5yr contracts |
| SMB | 8 | Churn 15–25% |
| Embedded-payments | 6 | Adoption +25% |
Preview the Actual Deliverable
i3 Verticals Porter's Five Forces Analysis
This preview shows the exact i3 Verticals Porter’s Five Forces analysis you'll receive—fully written, formatted and ready to use. No placeholders or samples. Once purchased, you'll get instant access to this identical document. It’s the complete deliverable, prepared for immediate download.

Elevate Your Analysis with the Complete Porter's Five Forces Analysis
i3 Verticals’ Porter’s Five Forces snapshot highlights moderate buyer power, fragmented supplier influence, rising fintech substitutes, and barriers tempering new entrants—painting a nuanced competitive picture. This brief teaser teases actionable risks and strategic levers. Unlock the full Porter’s Five Forces Analysis to get force-by-force ratings, visuals, and tactical recommendations tailored to i3 Verticals.
Suppliers Bargaining Power
Card networks and sponsor banks
i3 Verticals depends on Visa, Mastercard and sponsor/acquiring banks for core rails and licensing, with the two networks controlling roughly 80% of U.S. card purchase volume. Networks and banks impose interchange, assessments and operating rules that typically total about 1.5–3% of transaction value, constraining pricing flexibility. Volume rebates mitigate costs, but negotiating leverage favors the large networks, so any rule or fee change can quickly compress margins.
ISV and POS hardware partners
Integrated software vendors and POS OEMs control critical endpoints and user experience and can demand rev-share, certification priority, or exclusivity within vertical stacks, increasing supplier leverage over i3 Verticals. Fragmentation across hundreds of ISVs tempers this power, though leading niche ISVs and hardware partners can exert outsized influence. Certification and ongoing support obligations create switching frictions and raise integration costs for i3 Verticals.
Cloud and data infrastructure
Dependence on cloud hosting, security and data vendors creates recurring opex for i3 Verticals, with top cloud providers controlling the market (AWS ~32%, Microsoft Azure ~23%, Google Cloud ~11% in 2024 per Synergy Research), constraining pricing power. Providers are substitutable but migration costs and uptime requirements limit switching; premium security/compliance features command higher fees. Outages or sudden price hikes can erode SLAs and gross margins.
Fraud, KYC, and compliance vendors
Third-party AML, KYC and fraud vendors are embedded in i3 Verticals underwriting; their model performance directly shifts approval rates and merchant conversion—studies in 2024 show optimization can lift conversion by 3–7% while reducing chargeback losses similarly.
- 2024 AML/KYC market ~3.2B USD — rising vendor pricing
- Top models command premium fees, raising per-merchant cost
- Regulatory changes (e.g., enhanced CDD) increase vendor dependence
Payment device manufacturers
Certified terminals and peripherals must comply with PCI PTS, PCI PIN and network approvals; these certifications remained mandatory in 2024 for EMV and contactless acceptance, constraining eligible devices. Limited certified form factors give OEMs leverage in pricing and OEM negotiation; lead times and global component shortages have disrupted rollouts. Volume commitments are often required to secure pricing and availability.
- Certification: PCI PTS/PIN required (2024)
- Supplier leverage: limited certified form factors
- Risk: lead-time and component constraints
- Mitigation: volume commitments to lock pricing
Supplier concentration, interchange (1.5–3%) plus cloud & AML costs squeeze margins
i3 Verticals faces strong supplier power from card networks (Visa/Mastercard ~80% U.S. volume) driving interchange/assessments ~1.5–3% that limit pricing. Cloud providers (AWS 32%, Azure 23%, GCP 11% in 2024) and certified terminal OEMs exert leverage via pricing, certifications and lead times. AML/KYC market ~$3.2B (2024) raises per-merchant costs and switching friction.
| Supplier | 2024 Metric | Impact |
|---|---|---|
| Card networks | ~80% U.S. volume; fees 1.5–3% | High pricing pressure |
| Cloud | AWS 32%/Azure 23%/GCP 11% | Opex, switching cost |
| AML/KYC | $3.2B market | Higher per-merchant fees |
| Terminals | PCI PTS/PIN mandatory (2024) | Supply constraints, lead times |
What is included in the product
Detailed Word Document
Uncovers key drivers of competition, supplier and buyer power, entry barriers, and substitute threats specific to i3 Verticals, with strategic commentary on disruptive risks and defensive levers.
Customizable Excel Spreadsheet
One-sheet Porter's Five Forces for i3 Verticals—clear, slide-ready summary to speed strategic decisions; instantly visualize competitive pressure with a radar chart and tweak force levels as market data evolves. Clean layout, no macros, and easy integration into decks or Excel dashboards for quick boardroom use.
Customers Bargaining Power
Enterprise and public sector RFPs
Enterprise and public sector RFPs for government, education, and healthcare are highly structured, often requiring SOC 2, PCI DSS and HIPAA compliance and strong referenceability to win; procurement cycles commonly span 9–18 months. Buyers demand custom features, integrations, preferential pricing and concessions on rates and service levels; contract lengths typically run 3–5 years with negotiated discounts and SLAs.
SMBs with multi-homing
SMBs frequently multi-home, keeping bargaining power high as switching costs are modest and industry reports in 2024 cite POS/processor churn around 15–25% annually. Transparent fintech pricing has raised price sensitivity, while month-to-month contracts and free hardware offers further elevate churn risk. Value-add software (e.g., POS integrations, CRM) can lower churn but does not eliminate the underlying price pressure.
Vertical integration stickiness
Where i3 embeds payments into workflow software, customer switching costs rise as data migration, staff retraining and re‑certification create measurable friction; embedded-payments adoption grew about 25% in 2024, reinforcing platform lock‑in. Sticky modules reduce buyer power and support premium bundling and higher ARPU, though buyers still press for feature roadmaps and strict support SLAs.
Interchange pass-through transparency
Many buyers now demand interchange-plus transparency; industry practice in 2024 commonly delivers visible interchange passthrough and negotiable processor markups, driving downward pressure on margins and ancillary fees.
Surcharging and convenience-fee rules shift net economics and merchant tolerance for rates, while plentiful competitors and online price comparisons make competitive quotes easy to obtain, accelerating fee compression.
- Interchange-plus transparency
- Negotiated processor margins
- Surcharging alters economics
- Easy competitive quotes
Demand for omnichannel and uptime
Buyers demand seamless in-person, online, and mobile acceptance, forcing i3 Verticals to invest in omnichannel integrations and high-availability infrastructure.
Stringent SLA and redundancy expectations raise service costs, while penalty clauses for downtime transfer financial and reputational risk to the provider, strengthening buyers’ leverage in contract negotiations.
- omnichannel requirement increases integration spend
- SLA and redundancy drive higher operating costs
- penalty clauses shift downtime risk to provider
- elevated expectations amplify buyer bargaining power
Buyers wield leverage: enterprise RFPs, SMB churn 15–25%, embedded +25%
Buyers exert high leverage: enterprise RFPs (procure 9–18 months) demand SOC2/PCI/HIPAA, 3–5yr contracts and negotiated SLAs; SMBs churn 15–25% (2024) with price sensitivity and month-to-month terms. Embedded-payments adoption rose ~25% in 2024, raising switching costs and ARPU, but interchange-plus transparency and easy quoting compress margins. Omnichannel and strict SLAs push integration and uptime costs, strengthening buyer negotiation power.
| Buyer Segment | Power (0–10) | Key metric (2024) |
|---|---|---|
| Enterprise/Public | 9 | Procure 9–18mo; 3–5yr contracts |
| SMB | 8 | Churn 15–25% |
| Embedded-payments | 6 | Adoption +25% |
Preview the Actual Deliverable
i3 Verticals Porter's Five Forces Analysis
This preview shows the exact i3 Verticals Porter’s Five Forces analysis you'll receive—fully written, formatted and ready to use. No placeholders or samples. Once purchased, you'll get instant access to this identical document. It’s the complete deliverable, prepared for immediate download.
Original: $10.00
-65%$10.00
$3.50Description
Elevate Your Analysis with the Complete Porter's Five Forces Analysis
i3 Verticals’ Porter’s Five Forces snapshot highlights moderate buyer power, fragmented supplier influence, rising fintech substitutes, and barriers tempering new entrants—painting a nuanced competitive picture. This brief teaser teases actionable risks and strategic levers. Unlock the full Porter’s Five Forces Analysis to get force-by-force ratings, visuals, and tactical recommendations tailored to i3 Verticals.
Suppliers Bargaining Power
Card networks and sponsor banks
i3 Verticals depends on Visa, Mastercard and sponsor/acquiring banks for core rails and licensing, with the two networks controlling roughly 80% of U.S. card purchase volume. Networks and banks impose interchange, assessments and operating rules that typically total about 1.5–3% of transaction value, constraining pricing flexibility. Volume rebates mitigate costs, but negotiating leverage favors the large networks, so any rule or fee change can quickly compress margins.
ISV and POS hardware partners
Integrated software vendors and POS OEMs control critical endpoints and user experience and can demand rev-share, certification priority, or exclusivity within vertical stacks, increasing supplier leverage over i3 Verticals. Fragmentation across hundreds of ISVs tempers this power, though leading niche ISVs and hardware partners can exert outsized influence. Certification and ongoing support obligations create switching frictions and raise integration costs for i3 Verticals.
Cloud and data infrastructure
Dependence on cloud hosting, security and data vendors creates recurring opex for i3 Verticals, with top cloud providers controlling the market (AWS ~32%, Microsoft Azure ~23%, Google Cloud ~11% in 2024 per Synergy Research), constraining pricing power. Providers are substitutable but migration costs and uptime requirements limit switching; premium security/compliance features command higher fees. Outages or sudden price hikes can erode SLAs and gross margins.
Fraud, KYC, and compliance vendors
Third-party AML, KYC and fraud vendors are embedded in i3 Verticals underwriting; their model performance directly shifts approval rates and merchant conversion—studies in 2024 show optimization can lift conversion by 3–7% while reducing chargeback losses similarly.
- 2024 AML/KYC market ~3.2B USD — rising vendor pricing
- Top models command premium fees, raising per-merchant cost
- Regulatory changes (e.g., enhanced CDD) increase vendor dependence
Payment device manufacturers
Certified terminals and peripherals must comply with PCI PTS, PCI PIN and network approvals; these certifications remained mandatory in 2024 for EMV and contactless acceptance, constraining eligible devices. Limited certified form factors give OEMs leverage in pricing and OEM negotiation; lead times and global component shortages have disrupted rollouts. Volume commitments are often required to secure pricing and availability.
- Certification: PCI PTS/PIN required (2024)
- Supplier leverage: limited certified form factors
- Risk: lead-time and component constraints
- Mitigation: volume commitments to lock pricing
Supplier concentration, interchange (1.5–3%) plus cloud & AML costs squeeze margins
i3 Verticals faces strong supplier power from card networks (Visa/Mastercard ~80% U.S. volume) driving interchange/assessments ~1.5–3% that limit pricing. Cloud providers (AWS 32%, Azure 23%, GCP 11% in 2024) and certified terminal OEMs exert leverage via pricing, certifications and lead times. AML/KYC market ~$3.2B (2024) raises per-merchant costs and switching friction.
| Supplier | 2024 Metric | Impact |
|---|---|---|
| Card networks | ~80% U.S. volume; fees 1.5–3% | High pricing pressure |
| Cloud | AWS 32%/Azure 23%/GCP 11% | Opex, switching cost |
| AML/KYC | $3.2B market | Higher per-merchant fees |
| Terminals | PCI PTS/PIN mandatory (2024) | Supply constraints, lead times |
What is included in the product
Detailed Word Document
Uncovers key drivers of competition, supplier and buyer power, entry barriers, and substitute threats specific to i3 Verticals, with strategic commentary on disruptive risks and defensive levers.
Customizable Excel Spreadsheet
One-sheet Porter's Five Forces for i3 Verticals—clear, slide-ready summary to speed strategic decisions; instantly visualize competitive pressure with a radar chart and tweak force levels as market data evolves. Clean layout, no macros, and easy integration into decks or Excel dashboards for quick boardroom use.
Customers Bargaining Power
Enterprise and public sector RFPs
Enterprise and public sector RFPs for government, education, and healthcare are highly structured, often requiring SOC 2, PCI DSS and HIPAA compliance and strong referenceability to win; procurement cycles commonly span 9–18 months. Buyers demand custom features, integrations, preferential pricing and concessions on rates and service levels; contract lengths typically run 3–5 years with negotiated discounts and SLAs.
SMBs with multi-homing
SMBs frequently multi-home, keeping bargaining power high as switching costs are modest and industry reports in 2024 cite POS/processor churn around 15–25% annually. Transparent fintech pricing has raised price sensitivity, while month-to-month contracts and free hardware offers further elevate churn risk. Value-add software (e.g., POS integrations, CRM) can lower churn but does not eliminate the underlying price pressure.
Vertical integration stickiness
Where i3 embeds payments into workflow software, customer switching costs rise as data migration, staff retraining and re‑certification create measurable friction; embedded-payments adoption grew about 25% in 2024, reinforcing platform lock‑in. Sticky modules reduce buyer power and support premium bundling and higher ARPU, though buyers still press for feature roadmaps and strict support SLAs.
Interchange pass-through transparency
Many buyers now demand interchange-plus transparency; industry practice in 2024 commonly delivers visible interchange passthrough and negotiable processor markups, driving downward pressure on margins and ancillary fees.
Surcharging and convenience-fee rules shift net economics and merchant tolerance for rates, while plentiful competitors and online price comparisons make competitive quotes easy to obtain, accelerating fee compression.
- Interchange-plus transparency
- Negotiated processor margins
- Surcharging alters economics
- Easy competitive quotes
Demand for omnichannel and uptime
Buyers demand seamless in-person, online, and mobile acceptance, forcing i3 Verticals to invest in omnichannel integrations and high-availability infrastructure.
Stringent SLA and redundancy expectations raise service costs, while penalty clauses for downtime transfer financial and reputational risk to the provider, strengthening buyers’ leverage in contract negotiations.
- omnichannel requirement increases integration spend
- SLA and redundancy drive higher operating costs
- penalty clauses shift downtime risk to provider
- elevated expectations amplify buyer bargaining power
Buyers wield leverage: enterprise RFPs, SMB churn 15–25%, embedded +25%
Buyers exert high leverage: enterprise RFPs (procure 9–18 months) demand SOC2/PCI/HIPAA, 3–5yr contracts and negotiated SLAs; SMBs churn 15–25% (2024) with price sensitivity and month-to-month terms. Embedded-payments adoption rose ~25% in 2024, raising switching costs and ARPU, but interchange-plus transparency and easy quoting compress margins. Omnichannel and strict SLAs push integration and uptime costs, strengthening buyer negotiation power.
| Buyer Segment | Power (0–10) | Key metric (2024) |
|---|---|---|
| Enterprise/Public | 9 | Procure 9–18mo; 3–5yr contracts |
| SMB | 8 | Churn 15–25% |
| Embedded-payments | 6 | Adoption +25% |
Preview the Actual Deliverable
i3 Verticals Porter's Five Forces Analysis
This preview shows the exact i3 Verticals Porter’s Five Forces analysis you'll receive—fully written, formatted and ready to use. No placeholders or samples. Once purchased, you'll get instant access to this identical document. It’s the complete deliverable, prepared for immediate download.











