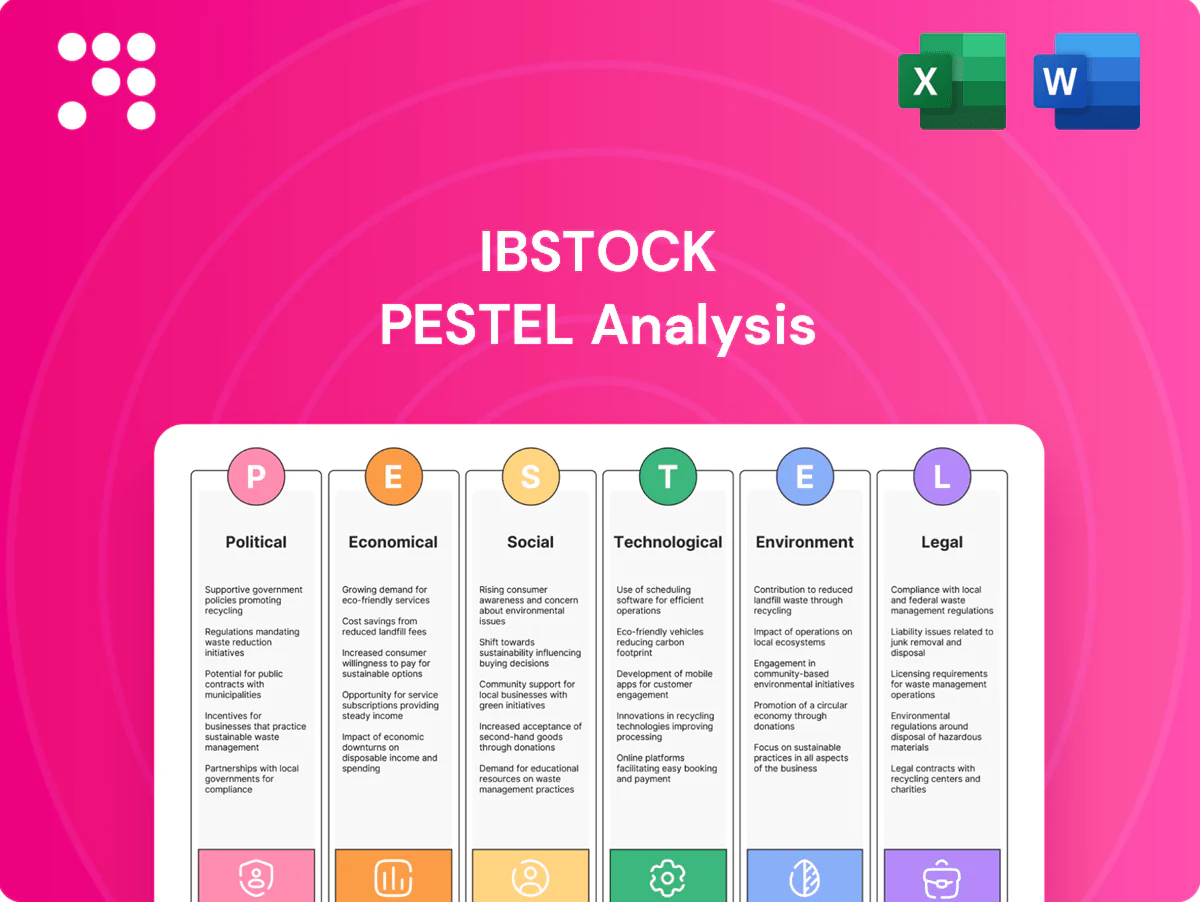
Ibstock PESTLE Analysis

Make Smarter Strategic Decisions with a Complete PESTEL View
Discover how political, economic, social, technological, legal and environmental forces are reshaping Ibstock's market position in our concise PESTLE overview. This snapshot highlights key risks and opportunities to inform investment and strategy decisions. Purchase the full PESTLE to access deep-dive evidence, forecasts and ready-to-use slides for immediate action.
Political factors

UK housing policy direction
Government target of 300,000 new homes p.a. and planning reforms such as the Levelling Up and Regeneration Act shape brick and block demand. The Affordable Homes Programme commits about £11.5bn for 2021–26, which can stabilize volumes during private-market dips. Post-election budget shifts may reallocate funding between infrastructure and housing. Ibstock’s exposure depends on policy execution, not just announcements.
Infrastructure and regional levelling
Public spending on schools and hospitals underpins brick and concrete demand, with the UK Levelling Up Fund totalling about £4.8bn since 2020 capable of directing regional regeneration work to local plants. Levelling Up allocations can lift utilisation at regional Ibstock sites, but project timing and strict procurement rules compress order visibility. Procurement delays or cancellations drive inventory buildups and pressure selling prices and margins.

Trade and import dynamics post‑Brexit
Customs frictions and rules of origin have raised paperwork: ONS data showed UK goods exports to the EU fell about 19% in 2021 versus 2019, while HMRC reported over 1 billion customs declarations since 2021, increasing input lead times for imported bricks and components.
Divergence of UK standards from the EU can shield Ibstock via local protection but risks isolating export markets; regulatory divergence accelerated after 2020 and remains a material strategy factor.
Port congestion and extra paperwork have added 2–4 days of transit on key routes and pushed logistics costs materially higher for both rivals and Ibstock, stressing inventory cycles and working capital.
Clear government policy on customs and standards reduces uncertainty and enables better inventory planning and sourcing decisions for a company with Ibstocks manufacturing footprint across the UK.

Energy and industrial decarbonisation support
- Grants/CFDs: lower transition Opex/Revenue risk
- 10GW H2 by 2030: market opportunity
- CCUS 20–30 MtCO2 by 2030: infrastructure upside
- Price caps/reliefs: kiln margin sensitivity
- Policy volatility: capex timing risk
Carbon border and ETS policy
UK ETS pricing directly affects kiln‑intensive clay operations; UK ETS averaged around £50/t in 2024, making carbon a material input cost for Ibstock. A UK carbon border mechanism would shift competitive parity with imports, mirroring EU CBAM steps toward full scope by 2026. Changes in free allocation year‑to‑year alter cash costs materially, and tightening policy rewards early movers on emissions reduction.
- UK ETS price: ~£50/t (2024)
- EU CBAM full scope: 2026
- Allocation volatility: alters cash cost per t CO2 annually
- Policy tightening: benefits early decarbonisers
Housing drive: 300,000 homes p.a., £11.5bn fuels brick demand
Government targets (300,000 homes p.a.) and the £11.5bn Affordable Homes 2021–26 programme underpin brick demand; Levelling Up Fund £4.8bn since 2020 drives regional work. Customs/friction cut EU exports ~19% (2021 vs 2019) and added 2–4 transit days. Energy policy: UK ETS ~£50/t (2024), 10GW H2 by 2030, CCUS 20–30Mt by 2030; CBAM full scope by 2026.
| Indicator | Value |
|---|---|
| Homes target | 300,000 p.a. |
| Affordable Homes | £11.5bn (2021–26) |
| Levelling Up Fund | £4.8bn |
| UK ETS (2024) | ~£50/t |
| H2 target | 10GW by 2030 |
| CCUS | 20–30 Mt by 2030 |
What is included in the product
 Detailed Word Document
Provides a concise PESTLE review of Ibstock, examining Political, Economic, Social, Technological, Environmental and Legal forces affecting the UK masonry and construction-materials business, with data-backed trends, region-specific regulatory context and forward-looking insights to help executives, investors and strategists identify risks, opportunities and actionable responses.

 Customizable Excel Spreadsheet
A clean, summarized Ibstock PESTLE that relieves prep time by visually segmenting political, economic, social, technological, legal and environmental factors for quick reference and easy inclusion in presentations or team planning sessions.
Economic factors

Housing cycle sensitivity
Brick volumes closely track UK housing starts and mortgage affordability, with rate cuts typically reviving site openings after a 6–12 month lag. Repair, maintenance and improvement spending cushions downside by sustaining demand when new-build slows. A shift from private sale to build-to-rent alters product mix and can exert price pressure in certain regions.
Energy and input cost volatility
Gas, electricity and kiln refractory cost swings drove Ibstock margin variability, with energy costs falling roughly 30% from 2022 peaks by 2024 but remaining a major input pressure in FY2024.
Hedging reduces exposure and smoothed cash flow in 2023–24 but did not eliminate short-term spikes that compressed margins in quarters.
Pass‑through to brick prices faces a lag and UK market competition, so efficiency gains and NPD remain critical to protect margin resilience.

Labour availability and wages
Skilled trades shortages are slowing build‑out rates and deferring brick pull‑through, with CITB and industry surveys flagging multi‑year gaps in bricklayers and carpenters; this constrains demand timing for Ibstock. Wage inflation—regular pay growth around 6–7% in 2024 per ONS—raises plant and logistics costs. Automation offsets labour pressure but needs material capex and 12–24 month ramp‑up, while regional tightness forces dynamic production scheduling.

FX and import competition
Sterling swings alter attractiveness of imported bricks and raw materials, with a weaker GBP reducing import competition but increasing input costs for kiln fuels and additives.
A stronger GBP tightens domestic pricing power, pressuring margins if demand weakens; Ibstock's mix of clay and concrete products provides natural hedge across feedstock and import exposure.
- FX exposure: weaker GBP lowers import pressure yet raises input cost; stronger GBP compresses pricing power; portfolio balance (clay vs concrete) mitigates risk.
Customer consolidation risk
Large housebuilders and merchants hold pricing leverage over suppliers, with the top five UK housebuilders accounting for around 50% of new-build completions in 2023–24, forcing Ibstock into framework agreements that secure volumes but compress margins. Credit risk rises as small contractors face higher insolvency rates in 2023–24, increasing payment delays and bad-debt exposure. Diversification across private, social housing, repair & maintenance and merchant channels reduces concentration risk.
- Concentration: top-5 housebuilders ≈50% of new builds (2023–24)
- Pricing leverage: frameworks = volume security, lower margins
- Credit risk: higher contractor insolvencies in 2023–24
- Mitigation: multi-segment diversification
Housing drive: 300,000 homes p.a., £11.5bn fuels brick demand
Brick volumes remain tied to UK housing starts and mortgage affordability with a 6–12 month policy lag; repair & maintenance cushions downside. Energy costs fell ~30% from 2022 peaks by 2024 but remain a key margin driver. Skilled-trades shortages and wage inflation (~6–7% in 2024) constrain build rates and raise operating costs. Top-5 housebuilders accounted for ≈50% of new-builds in 2023–24, compressing supplier margins.
| Metric | Value |
|---|---|
| Energy cost change | ≈-30% vs 2022 (by 2024) |
| Wage inflation (ONS) | 6–7% (2024) |
| Top-5 housebuilders share | ≈50% (2023–24) |
| Policy lag to volumes | 6–12 months |
What You See Is What You Get
Ibstock PESTLE Analysis
The preview shown here is the exact Ibstock PESTLE Analysis you’ll receive after purchase—fully formatted and ready to use. It contains the same structure, insights, and visuals as the downloadable file, with no placeholders or edits required. After checkout you’ll instantly get this exact document, professionally organized for immediate application.

Make Smarter Strategic Decisions with a Complete PESTEL View
Discover how political, economic, social, technological, legal and environmental forces are reshaping Ibstock's market position in our concise PESTLE overview. This snapshot highlights key risks and opportunities to inform investment and strategy decisions. Purchase the full PESTLE to access deep-dive evidence, forecasts and ready-to-use slides for immediate action.
Political factors
UK housing policy direction
Government target of 300,000 new homes p.a. and planning reforms such as the Levelling Up and Regeneration Act shape brick and block demand. The Affordable Homes Programme commits about £11.5bn for 2021–26, which can stabilize volumes during private-market dips. Post-election budget shifts may reallocate funding between infrastructure and housing. Ibstock’s exposure depends on policy execution, not just announcements.
Infrastructure and regional levelling
Public spending on schools and hospitals underpins brick and concrete demand, with the UK Levelling Up Fund totalling about £4.8bn since 2020 capable of directing regional regeneration work to local plants. Levelling Up allocations can lift utilisation at regional Ibstock sites, but project timing and strict procurement rules compress order visibility. Procurement delays or cancellations drive inventory buildups and pressure selling prices and margins.
Trade and import dynamics post‑Brexit
Customs frictions and rules of origin have raised paperwork: ONS data showed UK goods exports to the EU fell about 19% in 2021 versus 2019, while HMRC reported over 1 billion customs declarations since 2021, increasing input lead times for imported bricks and components.
Divergence of UK standards from the EU can shield Ibstock via local protection but risks isolating export markets; regulatory divergence accelerated after 2020 and remains a material strategy factor.
Port congestion and extra paperwork have added 2–4 days of transit on key routes and pushed logistics costs materially higher for both rivals and Ibstock, stressing inventory cycles and working capital.
Clear government policy on customs and standards reduces uncertainty and enables better inventory planning and sourcing decisions for a company with Ibstocks manufacturing footprint across the UK.
Energy and industrial decarbonisation support
- Grants/CFDs: lower transition Opex/Revenue risk
- 10GW H2 by 2030: market opportunity
- CCUS 20–30 MtCO2 by 2030: infrastructure upside
- Price caps/reliefs: kiln margin sensitivity
- Policy volatility: capex timing risk
Carbon border and ETS policy
UK ETS pricing directly affects kiln‑intensive clay operations; UK ETS averaged around £50/t in 2024, making carbon a material input cost for Ibstock. A UK carbon border mechanism would shift competitive parity with imports, mirroring EU CBAM steps toward full scope by 2026. Changes in free allocation year‑to‑year alter cash costs materially, and tightening policy rewards early movers on emissions reduction.
- UK ETS price: ~£50/t (2024)
- EU CBAM full scope: 2026
- Allocation volatility: alters cash cost per t CO2 annually
- Policy tightening: benefits early decarbonisers
Housing drive: 300,000 homes p.a., £11.5bn fuels brick demand
Government targets (300,000 homes p.a.) and the £11.5bn Affordable Homes 2021–26 programme underpin brick demand; Levelling Up Fund £4.8bn since 2020 drives regional work. Customs/friction cut EU exports ~19% (2021 vs 2019) and added 2–4 transit days. Energy policy: UK ETS ~£50/t (2024), 10GW H2 by 2030, CCUS 20–30Mt by 2030; CBAM full scope by 2026.
| Indicator | Value |
|---|---|
| Homes target | 300,000 p.a. |
| Affordable Homes | £11.5bn (2021–26) |
| Levelling Up Fund | £4.8bn |
| UK ETS (2024) | ~£50/t |
| H2 target | 10GW by 2030 |
| CCUS | 20–30 Mt by 2030 |
What is included in the product
Detailed Word Document
Provides a concise PESTLE review of Ibstock, examining Political, Economic, Social, Technological, Environmental and Legal forces affecting the UK masonry and construction-materials business, with data-backed trends, region-specific regulatory context and forward-looking insights to help executives, investors and strategists identify risks, opportunities and actionable responses.
Customizable Excel Spreadsheet
A clean, summarized Ibstock PESTLE that relieves prep time by visually segmenting political, economic, social, technological, legal and environmental factors for quick reference and easy inclusion in presentations or team planning sessions.
Economic factors
Housing cycle sensitivity
Brick volumes closely track UK housing starts and mortgage affordability, with rate cuts typically reviving site openings after a 6–12 month lag. Repair, maintenance and improvement spending cushions downside by sustaining demand when new-build slows. A shift from private sale to build-to-rent alters product mix and can exert price pressure in certain regions.
Energy and input cost volatility
Gas, electricity and kiln refractory cost swings drove Ibstock margin variability, with energy costs falling roughly 30% from 2022 peaks by 2024 but remaining a major input pressure in FY2024.
Hedging reduces exposure and smoothed cash flow in 2023–24 but did not eliminate short-term spikes that compressed margins in quarters.
Pass‑through to brick prices faces a lag and UK market competition, so efficiency gains and NPD remain critical to protect margin resilience.
Labour availability and wages
Skilled trades shortages are slowing build‑out rates and deferring brick pull‑through, with CITB and industry surveys flagging multi‑year gaps in bricklayers and carpenters; this constrains demand timing for Ibstock. Wage inflation—regular pay growth around 6–7% in 2024 per ONS—raises plant and logistics costs. Automation offsets labour pressure but needs material capex and 12–24 month ramp‑up, while regional tightness forces dynamic production scheduling.
FX and import competition
Sterling swings alter attractiveness of imported bricks and raw materials, with a weaker GBP reducing import competition but increasing input costs for kiln fuels and additives.
A stronger GBP tightens domestic pricing power, pressuring margins if demand weakens; Ibstock's mix of clay and concrete products provides natural hedge across feedstock and import exposure.
- FX exposure: weaker GBP lowers import pressure yet raises input cost; stronger GBP compresses pricing power; portfolio balance (clay vs concrete) mitigates risk.
Customer consolidation risk
Large housebuilders and merchants hold pricing leverage over suppliers, with the top five UK housebuilders accounting for around 50% of new-build completions in 2023–24, forcing Ibstock into framework agreements that secure volumes but compress margins. Credit risk rises as small contractors face higher insolvency rates in 2023–24, increasing payment delays and bad-debt exposure. Diversification across private, social housing, repair & maintenance and merchant channels reduces concentration risk.
- Concentration: top-5 housebuilders ≈50% of new builds (2023–24)
- Pricing leverage: frameworks = volume security, lower margins
- Credit risk: higher contractor insolvencies in 2023–24
- Mitigation: multi-segment diversification
Housing drive: 300,000 homes p.a., £11.5bn fuels brick demand
Brick volumes remain tied to UK housing starts and mortgage affordability with a 6–12 month policy lag; repair & maintenance cushions downside. Energy costs fell ~30% from 2022 peaks by 2024 but remain a key margin driver. Skilled-trades shortages and wage inflation (~6–7% in 2024) constrain build rates and raise operating costs. Top-5 housebuilders accounted for ≈50% of new-builds in 2023–24, compressing supplier margins.
| Metric | Value |
|---|---|
| Energy cost change | ≈-30% vs 2022 (by 2024) |
| Wage inflation (ONS) | 6–7% (2024) |
| Top-5 housebuilders share | ≈50% (2023–24) |
| Policy lag to volumes | 6–12 months |
What You See Is What You Get
Ibstock PESTLE Analysis
The preview shown here is the exact Ibstock PESTLE Analysis you’ll receive after purchase—fully formatted and ready to use. It contains the same structure, insights, and visuals as the downloadable file, with no placeholders or edits required. After checkout you’ll instantly get this exact document, professionally organized for immediate application.
Original: $10.00
-65%$10.00
$3.50Description
Make Smarter Strategic Decisions with a Complete PESTEL View
Discover how political, economic, social, technological, legal and environmental forces are reshaping Ibstock's market position in our concise PESTLE overview. This snapshot highlights key risks and opportunities to inform investment and strategy decisions. Purchase the full PESTLE to access deep-dive evidence, forecasts and ready-to-use slides for immediate action.
Political factors
UK housing policy direction
Government target of 300,000 new homes p.a. and planning reforms such as the Levelling Up and Regeneration Act shape brick and block demand. The Affordable Homes Programme commits about £11.5bn for 2021–26, which can stabilize volumes during private-market dips. Post-election budget shifts may reallocate funding between infrastructure and housing. Ibstock’s exposure depends on policy execution, not just announcements.
Infrastructure and regional levelling
Public spending on schools and hospitals underpins brick and concrete demand, with the UK Levelling Up Fund totalling about £4.8bn since 2020 capable of directing regional regeneration work to local plants. Levelling Up allocations can lift utilisation at regional Ibstock sites, but project timing and strict procurement rules compress order visibility. Procurement delays or cancellations drive inventory buildups and pressure selling prices and margins.
Trade and import dynamics post‑Brexit
Customs frictions and rules of origin have raised paperwork: ONS data showed UK goods exports to the EU fell about 19% in 2021 versus 2019, while HMRC reported over 1 billion customs declarations since 2021, increasing input lead times for imported bricks and components.
Divergence of UK standards from the EU can shield Ibstock via local protection but risks isolating export markets; regulatory divergence accelerated after 2020 and remains a material strategy factor.
Port congestion and extra paperwork have added 2–4 days of transit on key routes and pushed logistics costs materially higher for both rivals and Ibstock, stressing inventory cycles and working capital.
Clear government policy on customs and standards reduces uncertainty and enables better inventory planning and sourcing decisions for a company with Ibstocks manufacturing footprint across the UK.
Energy and industrial decarbonisation support
- Grants/CFDs: lower transition Opex/Revenue risk
- 10GW H2 by 2030: market opportunity
- CCUS 20–30 MtCO2 by 2030: infrastructure upside
- Price caps/reliefs: kiln margin sensitivity
- Policy volatility: capex timing risk
Carbon border and ETS policy
UK ETS pricing directly affects kiln‑intensive clay operations; UK ETS averaged around £50/t in 2024, making carbon a material input cost for Ibstock. A UK carbon border mechanism would shift competitive parity with imports, mirroring EU CBAM steps toward full scope by 2026. Changes in free allocation year‑to‑year alter cash costs materially, and tightening policy rewards early movers on emissions reduction.
- UK ETS price: ~£50/t (2024)
- EU CBAM full scope: 2026
- Allocation volatility: alters cash cost per t CO2 annually
- Policy tightening: benefits early decarbonisers
Housing drive: 300,000 homes p.a., £11.5bn fuels brick demand
Government targets (300,000 homes p.a.) and the £11.5bn Affordable Homes 2021–26 programme underpin brick demand; Levelling Up Fund £4.8bn since 2020 drives regional work. Customs/friction cut EU exports ~19% (2021 vs 2019) and added 2–4 transit days. Energy policy: UK ETS ~£50/t (2024), 10GW H2 by 2030, CCUS 20–30Mt by 2030; CBAM full scope by 2026.
| Indicator | Value |
|---|---|
| Homes target | 300,000 p.a. |
| Affordable Homes | £11.5bn (2021–26) |
| Levelling Up Fund | £4.8bn |
| UK ETS (2024) | ~£50/t |
| H2 target | 10GW by 2030 |
| CCUS | 20–30 Mt by 2030 |
What is included in the product
Detailed Word Document
Provides a concise PESTLE review of Ibstock, examining Political, Economic, Social, Technological, Environmental and Legal forces affecting the UK masonry and construction-materials business, with data-backed trends, region-specific regulatory context and forward-looking insights to help executives, investors and strategists identify risks, opportunities and actionable responses.
Customizable Excel Spreadsheet
A clean, summarized Ibstock PESTLE that relieves prep time by visually segmenting political, economic, social, technological, legal and environmental factors for quick reference and easy inclusion in presentations or team planning sessions.
Economic factors
Housing cycle sensitivity
Brick volumes closely track UK housing starts and mortgage affordability, with rate cuts typically reviving site openings after a 6–12 month lag. Repair, maintenance and improvement spending cushions downside by sustaining demand when new-build slows. A shift from private sale to build-to-rent alters product mix and can exert price pressure in certain regions.
Energy and input cost volatility
Gas, electricity and kiln refractory cost swings drove Ibstock margin variability, with energy costs falling roughly 30% from 2022 peaks by 2024 but remaining a major input pressure in FY2024.
Hedging reduces exposure and smoothed cash flow in 2023–24 but did not eliminate short-term spikes that compressed margins in quarters.
Pass‑through to brick prices faces a lag and UK market competition, so efficiency gains and NPD remain critical to protect margin resilience.
Labour availability and wages
Skilled trades shortages are slowing build‑out rates and deferring brick pull‑through, with CITB and industry surveys flagging multi‑year gaps in bricklayers and carpenters; this constrains demand timing for Ibstock. Wage inflation—regular pay growth around 6–7% in 2024 per ONS—raises plant and logistics costs. Automation offsets labour pressure but needs material capex and 12–24 month ramp‑up, while regional tightness forces dynamic production scheduling.
FX and import competition
Sterling swings alter attractiveness of imported bricks and raw materials, with a weaker GBP reducing import competition but increasing input costs for kiln fuels and additives.
A stronger GBP tightens domestic pricing power, pressuring margins if demand weakens; Ibstock's mix of clay and concrete products provides natural hedge across feedstock and import exposure.
- FX exposure: weaker GBP lowers import pressure yet raises input cost; stronger GBP compresses pricing power; portfolio balance (clay vs concrete) mitigates risk.
Customer consolidation risk
Large housebuilders and merchants hold pricing leverage over suppliers, with the top five UK housebuilders accounting for around 50% of new-build completions in 2023–24, forcing Ibstock into framework agreements that secure volumes but compress margins. Credit risk rises as small contractors face higher insolvency rates in 2023–24, increasing payment delays and bad-debt exposure. Diversification across private, social housing, repair & maintenance and merchant channels reduces concentration risk.
- Concentration: top-5 housebuilders ≈50% of new builds (2023–24)
- Pricing leverage: frameworks = volume security, lower margins
- Credit risk: higher contractor insolvencies in 2023–24
- Mitigation: multi-segment diversification
Housing drive: 300,000 homes p.a., £11.5bn fuels brick demand
Brick volumes remain tied to UK housing starts and mortgage affordability with a 6–12 month policy lag; repair & maintenance cushions downside. Energy costs fell ~30% from 2022 peaks by 2024 but remain a key margin driver. Skilled-trades shortages and wage inflation (~6–7% in 2024) constrain build rates and raise operating costs. Top-5 housebuilders accounted for ≈50% of new-builds in 2023–24, compressing supplier margins.
| Metric | Value |
|---|---|
| Energy cost change | ≈-30% vs 2022 (by 2024) |
| Wage inflation (ONS) | 6–7% (2024) |
| Top-5 housebuilders share | ≈50% (2023–24) |
| Policy lag to volumes | 6–12 months |
What You See Is What You Get
Ibstock PESTLE Analysis
The preview shown here is the exact Ibstock PESTLE Analysis you’ll receive after purchase—fully formatted and ready to use. It contains the same structure, insights, and visuals as the downloadable file, with no placeholders or edits required. After checkout you’ll instantly get this exact document, professionally organized for immediate application.











