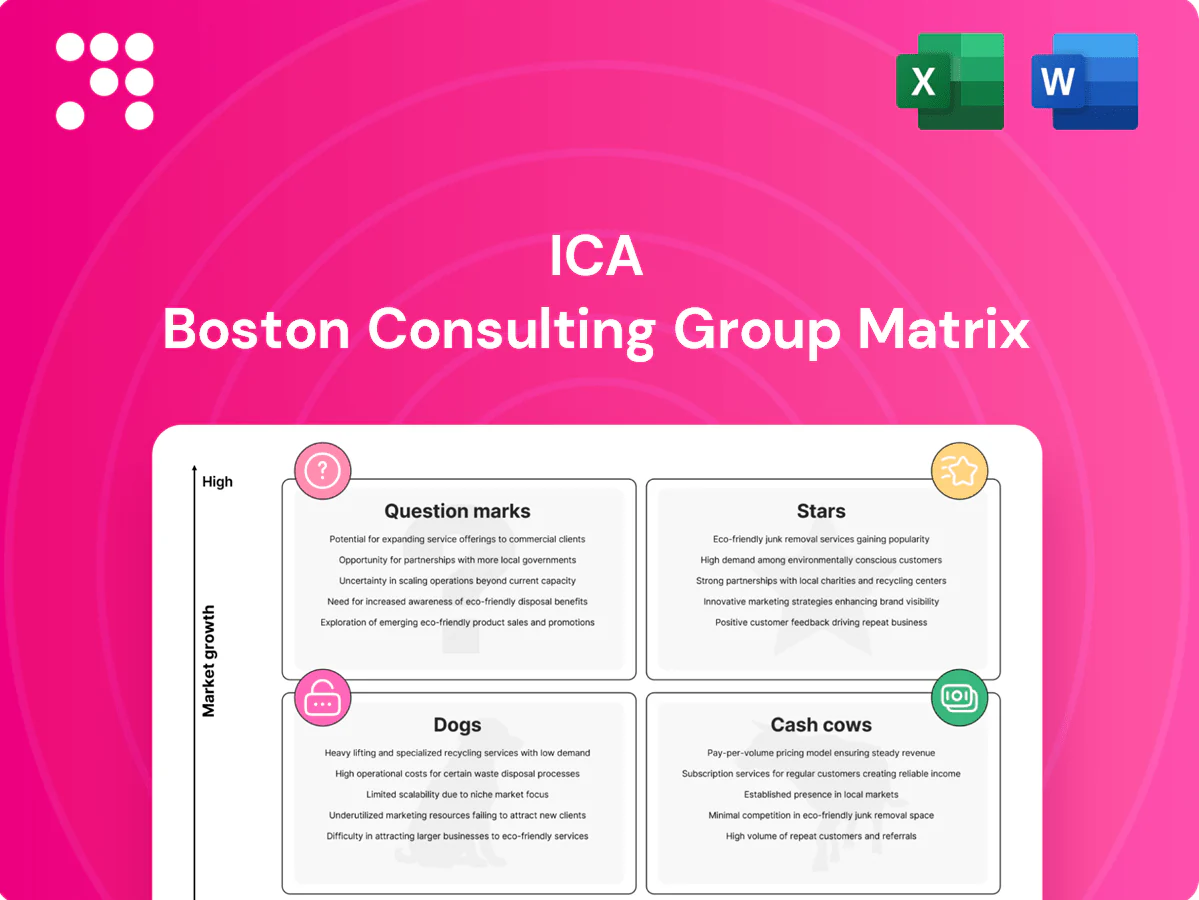
ICA Boston Consulting Group Matrix

Visual. Strategic. Downloadable.
Curious where ICA’s products really sit—Stars, Cash Cows, Dogs or Question Marks? This quick snapshot hints at positioning, but the full BCG Matrix gives you quadrant-by-quadrant clarity, data-backed recommendations, and strategic next steps. Purchase the complete report for a ready-to-use Word brief plus an editable Excel summary and start making sharper investment and product decisions today.
Stars

National-scale transport megaprojects
National-scale transport megaprojects are high-growth 5–10 year corridor builds and multi-year packages where ICA is routinely shortlisted and often leads consortia; projects frequently exceed US$1bn, carry big visibility, big spend, and relentless timelines. Cash in equals cash out due to scale and pace, with heavy early mobilization and tight working-capital cycles. Keep investing to defend share and convert wins into long-lived concessions.
High-growth PPP concessions
High-growth PPP concessions in roads, water and social infra are expanding rapidly in Mexico, with the 2024 national PPP pipeline estimated at about US$10.7bn and growing double digits year-on-year. ICA’s lifecycle know-how—design–build–finance–operate—gives it an edge to win and scale these structured deals. Projects demand heavy upfront capital and promotion, but early leadership positions form market share and pricing power. Nurture aggressively so these Stars can graduate into durable cash cows.

Integrated EPC + O&M bundles
Integrated EPC plus long-term O&M is a Star as design–build paired with multi-year operations captures a heating market (solar PV additions ~300 GW in 2024), locking clients and fending off low-bid rivals through bundled lifetime value. These bundles boost contract stickiness but are working-capital hungry today, while margins remain firm as performance ramps. Double down on delivery excellence to cement market share.

Urban mobility systems
Metros, BRT and tunnels face rising demand as global urbanization reached 56% in 2024 (UN), driving larger city transport pipelines; complex technical, stakeholder and systems interfaces reward experienced primes. These projects consume cash during 3–7 year build cycles but make ICA the go-to partner when visible and fully resourced. Stay visible, staff the A-team, capture the pipeline.
- Priority: win metro/BRT tenders
- Action: maintain A-team bench
- Metric: monitor 3–7y capex cycles
- Goal: capture city pipeline and secure repeat work
Large industrial complexes
Large industrial complexes—plants, terminals and energy civils—capitalize on nearshoring/reshoring momentum, typically involving capex often greater than $100m and build cycles of 18–36 months, yielding learning-curve advantages that reduce unit costs 10–20% over early years.
Construction is cash intensive with 60–80% of spend upfront, but successful delivery compounds reputation and secures long-term contracts; prioritize marquee clients to keep the project flywheel spinning and de-risk revenue profiles.
- Scope: plants, terminals, energy civils
- Typical capex: >$100m
- Build time: 18–36 months
- Upfront spend: 60–80%
- Learning curve: 10–20% cost decline
- Strategy: target marquee clients
Win marquee megaprojects: fund upfront, capture US$10.7bn
ICA Stars: national megaprojects and PPPs (2024 PPP pipeline ~US$10.7bn) drive high growth but require heavy early capital (60–80% upfront) and 3–10y cycles. Bundled EPC+O&M (solar additions ~300 GW in 2024) boosts stickiness; metros/BRT demand rises with 56% urbanization in 2024. Prioritize A-team, marquee clients, and convert wins into long-lived concessions.
| Segment | 2024 metric | Typical capex | Build time |
|---|---|---|---|
| National megaprojects | Visibility, >US$1bn | >US$1bn | 5–10y |
| PPPs | Pipeline US$10.7bn | Varies | 5–15y |
| Industrial | Nearshoring | >US$100m | 18–36m |
What is included in the product
 Detailed Word Document
In-depth review of ICA's portfolio using BCG quadrants, advising where to invest, hold or divest while noting trends and risks.

 Customizable Excel Spreadsheet
One-page ICA BCG Matrix placing each business unit in a quadrant to simplify prioritization and speed strategic decisions.
Cash Cows

Mature toll-road concessions
Mature toll-road concessions show stable traffic broadly recovered to 2019 levels by 2024, with optimized O&M driving predictable free cash flow and high EBITDA conversion. Capex largely behind and yields ahead support low promotional spending; efficiency upside remains via digital tolling and tariff indexing. These assets are cash cows—steady returns while fine-tuning cost and pricing levers.
Long-term maintenance contracts
Long-term maintenance contracts for recurring network upkeep on highways and public assets typically run 3–10 years, delivering high share in defined geographies with low revenue volatility. They are easy to schedule and staff, supporting stable EBITDA and predictable cash conversion. Digitize inspections to reduce downtime and maintain service levels, then bank the cash to fund CAPEX or reduce leverage.

Government building programs
Standardized schools, clinics and admin facilities deliver repeatable scopes and tight delivery playbooks, driving predictable schedules and costs. In 2024 government building work remained a stable backlog source, with sector EBITDA margins around 5–8% and modest annual volume growth near low single digits. Competitive but familiar bidding favors selective pursuit to protect margins and cash generation.

Water treatment operations
Water treatment concessions deliver stable inflows with low cyclic capex; 2024 sector uptime >99% and EBITDA typically 25–40%, allowing cash generation to exceed operating needs. Performance KPIs (availability, NTU, energy kWh/m3) are well standardized. Targeted upgrades in 2024 raised throughput 10–15% and boosted margins by 200–400 bps.
- Stable cash: cash generation > cash needs
- KPIs: uptime >99%
- Margins: EBITDA 25–40%
- Upgrades: throughput +10–15%, margin +200–400 bps
Facilities and asset management
Facilities and asset management delivers steady O&M revenue for public and industrial clients post-build, forming a cash-cow with low growth but sticky relationships; global facilities management market was about $1.3 trillion in 2023 (Statista), underpinning stable demand.
High utilization of existing crews and systems drives strong free cash flow and predictable margins; recurring services often represent roughly 60% of operator revenues, making this business ideal to hold and optimize while funding riskier growth bets.
- Retention: >85% client stickiness
- Revenue mix: ~60% recurring O&M
- Market size: $1.3T (2023)
- Strategy: Hold, optimize, fund growth
Stable cash flow from mature concessions: uptime >99%, EBITDA 25–40%, retention >85%
Mature concessions and recurring O&M generate predictable free cash flow with capex largely behind; traffic broadly recovered to 2019 levels by 2024 and uptime >99%. EBITDA typically 25–40% for utilities, 5–8% for government buildings; client retention >85% and recurring O&M ~60% of revenues. Hold, optimize, and redeploy cash to growth or deleveraging.
| Asset | EBITDA | Cash gen | Retention |
|---|---|---|---|
| Water | 25–40% | FCF >needs | >85% |
| Facilities | 5–15% | Recurring ~60% | >85% |
Preview = Final Product
ICA BCG Matrix
The file you're previewing is the exact ICA BCG Matrix document you'll receive after purchase — no watermarks, no placeholders, just the finished report. It’s been crafted for clear strategic use and formatted for immediate editing, printing, or presenting. Buy once and you get the full, ready-to-use file delivered straight to your inbox. No surprises, no extra steps — just a professional analysis you can act on right away.

Visual. Strategic. Downloadable.
Curious where ICA’s products really sit—Stars, Cash Cows, Dogs or Question Marks? This quick snapshot hints at positioning, but the full BCG Matrix gives you quadrant-by-quadrant clarity, data-backed recommendations, and strategic next steps. Purchase the complete report for a ready-to-use Word brief plus an editable Excel summary and start making sharper investment and product decisions today.
Stars
National-scale transport megaprojects
National-scale transport megaprojects are high-growth 5–10 year corridor builds and multi-year packages where ICA is routinely shortlisted and often leads consortia; projects frequently exceed US$1bn, carry big visibility, big spend, and relentless timelines. Cash in equals cash out due to scale and pace, with heavy early mobilization and tight working-capital cycles. Keep investing to defend share and convert wins into long-lived concessions.
High-growth PPP concessions
High-growth PPP concessions in roads, water and social infra are expanding rapidly in Mexico, with the 2024 national PPP pipeline estimated at about US$10.7bn and growing double digits year-on-year. ICA’s lifecycle know-how—design–build–finance–operate—gives it an edge to win and scale these structured deals. Projects demand heavy upfront capital and promotion, but early leadership positions form market share and pricing power. Nurture aggressively so these Stars can graduate into durable cash cows.
Integrated EPC + O&M bundles
Integrated EPC plus long-term O&M is a Star as design–build paired with multi-year operations captures a heating market (solar PV additions ~300 GW in 2024), locking clients and fending off low-bid rivals through bundled lifetime value. These bundles boost contract stickiness but are working-capital hungry today, while margins remain firm as performance ramps. Double down on delivery excellence to cement market share.
Urban mobility systems
Metros, BRT and tunnels face rising demand as global urbanization reached 56% in 2024 (UN), driving larger city transport pipelines; complex technical, stakeholder and systems interfaces reward experienced primes. These projects consume cash during 3–7 year build cycles but make ICA the go-to partner when visible and fully resourced. Stay visible, staff the A-team, capture the pipeline.
- Priority: win metro/BRT tenders
- Action: maintain A-team bench
- Metric: monitor 3–7y capex cycles
- Goal: capture city pipeline and secure repeat work
Large industrial complexes
Large industrial complexes—plants, terminals and energy civils—capitalize on nearshoring/reshoring momentum, typically involving capex often greater than $100m and build cycles of 18–36 months, yielding learning-curve advantages that reduce unit costs 10–20% over early years.
Construction is cash intensive with 60–80% of spend upfront, but successful delivery compounds reputation and secures long-term contracts; prioritize marquee clients to keep the project flywheel spinning and de-risk revenue profiles.
- Scope: plants, terminals, energy civils
- Typical capex: >$100m
- Build time: 18–36 months
- Upfront spend: 60–80%
- Learning curve: 10–20% cost decline
- Strategy: target marquee clients
Win marquee megaprojects: fund upfront, capture US$10.7bn
ICA Stars: national megaprojects and PPPs (2024 PPP pipeline ~US$10.7bn) drive high growth but require heavy early capital (60–80% upfront) and 3–10y cycles. Bundled EPC+O&M (solar additions ~300 GW in 2024) boosts stickiness; metros/BRT demand rises with 56% urbanization in 2024. Prioritize A-team, marquee clients, and convert wins into long-lived concessions.
| Segment | 2024 metric | Typical capex | Build time |
|---|---|---|---|
| National megaprojects | Visibility, >US$1bn | >US$1bn | 5–10y |
| PPPs | Pipeline US$10.7bn | Varies | 5–15y |
| Industrial | Nearshoring | >US$100m | 18–36m |
What is included in the product
Detailed Word Document
In-depth review of ICA's portfolio using BCG quadrants, advising where to invest, hold or divest while noting trends and risks.
Customizable Excel Spreadsheet
One-page ICA BCG Matrix placing each business unit in a quadrant to simplify prioritization and speed strategic decisions.
Cash Cows
Mature toll-road concessions
Mature toll-road concessions show stable traffic broadly recovered to 2019 levels by 2024, with optimized O&M driving predictable free cash flow and high EBITDA conversion. Capex largely behind and yields ahead support low promotional spending; efficiency upside remains via digital tolling and tariff indexing. These assets are cash cows—steady returns while fine-tuning cost and pricing levers.
Long-term maintenance contracts
Long-term maintenance contracts for recurring network upkeep on highways and public assets typically run 3–10 years, delivering high share in defined geographies with low revenue volatility. They are easy to schedule and staff, supporting stable EBITDA and predictable cash conversion. Digitize inspections to reduce downtime and maintain service levels, then bank the cash to fund CAPEX or reduce leverage.
Government building programs
Standardized schools, clinics and admin facilities deliver repeatable scopes and tight delivery playbooks, driving predictable schedules and costs. In 2024 government building work remained a stable backlog source, with sector EBITDA margins around 5–8% and modest annual volume growth near low single digits. Competitive but familiar bidding favors selective pursuit to protect margins and cash generation.
Water treatment operations
Water treatment concessions deliver stable inflows with low cyclic capex; 2024 sector uptime >99% and EBITDA typically 25–40%, allowing cash generation to exceed operating needs. Performance KPIs (availability, NTU, energy kWh/m3) are well standardized. Targeted upgrades in 2024 raised throughput 10–15% and boosted margins by 200–400 bps.
- Stable cash: cash generation > cash needs
- KPIs: uptime >99%
- Margins: EBITDA 25–40%
- Upgrades: throughput +10–15%, margin +200–400 bps
Facilities and asset management
Facilities and asset management delivers steady O&M revenue for public and industrial clients post-build, forming a cash-cow with low growth but sticky relationships; global facilities management market was about $1.3 trillion in 2023 (Statista), underpinning stable demand.
High utilization of existing crews and systems drives strong free cash flow and predictable margins; recurring services often represent roughly 60% of operator revenues, making this business ideal to hold and optimize while funding riskier growth bets.
- Retention: >85% client stickiness
- Revenue mix: ~60% recurring O&M
- Market size: $1.3T (2023)
- Strategy: Hold, optimize, fund growth
Stable cash flow from mature concessions: uptime >99%, EBITDA 25–40%, retention >85%
Mature concessions and recurring O&M generate predictable free cash flow with capex largely behind; traffic broadly recovered to 2019 levels by 2024 and uptime >99%. EBITDA typically 25–40% for utilities, 5–8% for government buildings; client retention >85% and recurring O&M ~60% of revenues. Hold, optimize, and redeploy cash to growth or deleveraging.
| Asset | EBITDA | Cash gen | Retention |
|---|---|---|---|
| Water | 25–40% | FCF >needs | >85% |
| Facilities | 5–15% | Recurring ~60% | >85% |
Preview = Final Product
ICA BCG Matrix
The file you're previewing is the exact ICA BCG Matrix document you'll receive after purchase — no watermarks, no placeholders, just the finished report. It’s been crafted for clear strategic use and formatted for immediate editing, printing, or presenting. Buy once and you get the full, ready-to-use file delivered straight to your inbox. No surprises, no extra steps — just a professional analysis you can act on right away.
Original: $10.00
-65%$10.00
$3.50Description
Visual. Strategic. Downloadable.
Curious where ICA’s products really sit—Stars, Cash Cows, Dogs or Question Marks? This quick snapshot hints at positioning, but the full BCG Matrix gives you quadrant-by-quadrant clarity, data-backed recommendations, and strategic next steps. Purchase the complete report for a ready-to-use Word brief plus an editable Excel summary and start making sharper investment and product decisions today.
Stars
National-scale transport megaprojects
National-scale transport megaprojects are high-growth 5–10 year corridor builds and multi-year packages where ICA is routinely shortlisted and often leads consortia; projects frequently exceed US$1bn, carry big visibility, big spend, and relentless timelines. Cash in equals cash out due to scale and pace, with heavy early mobilization and tight working-capital cycles. Keep investing to defend share and convert wins into long-lived concessions.
High-growth PPP concessions
High-growth PPP concessions in roads, water and social infra are expanding rapidly in Mexico, with the 2024 national PPP pipeline estimated at about US$10.7bn and growing double digits year-on-year. ICA’s lifecycle know-how—design–build–finance–operate—gives it an edge to win and scale these structured deals. Projects demand heavy upfront capital and promotion, but early leadership positions form market share and pricing power. Nurture aggressively so these Stars can graduate into durable cash cows.
Integrated EPC + O&M bundles
Integrated EPC plus long-term O&M is a Star as design–build paired with multi-year operations captures a heating market (solar PV additions ~300 GW in 2024), locking clients and fending off low-bid rivals through bundled lifetime value. These bundles boost contract stickiness but are working-capital hungry today, while margins remain firm as performance ramps. Double down on delivery excellence to cement market share.
Urban mobility systems
Metros, BRT and tunnels face rising demand as global urbanization reached 56% in 2024 (UN), driving larger city transport pipelines; complex technical, stakeholder and systems interfaces reward experienced primes. These projects consume cash during 3–7 year build cycles but make ICA the go-to partner when visible and fully resourced. Stay visible, staff the A-team, capture the pipeline.
- Priority: win metro/BRT tenders
- Action: maintain A-team bench
- Metric: monitor 3–7y capex cycles
- Goal: capture city pipeline and secure repeat work
Large industrial complexes
Large industrial complexes—plants, terminals and energy civils—capitalize on nearshoring/reshoring momentum, typically involving capex often greater than $100m and build cycles of 18–36 months, yielding learning-curve advantages that reduce unit costs 10–20% over early years.
Construction is cash intensive with 60–80% of spend upfront, but successful delivery compounds reputation and secures long-term contracts; prioritize marquee clients to keep the project flywheel spinning and de-risk revenue profiles.
- Scope: plants, terminals, energy civils
- Typical capex: >$100m
- Build time: 18–36 months
- Upfront spend: 60–80%
- Learning curve: 10–20% cost decline
- Strategy: target marquee clients
Win marquee megaprojects: fund upfront, capture US$10.7bn
ICA Stars: national megaprojects and PPPs (2024 PPP pipeline ~US$10.7bn) drive high growth but require heavy early capital (60–80% upfront) and 3–10y cycles. Bundled EPC+O&M (solar additions ~300 GW in 2024) boosts stickiness; metros/BRT demand rises with 56% urbanization in 2024. Prioritize A-team, marquee clients, and convert wins into long-lived concessions.
| Segment | 2024 metric | Typical capex | Build time |
|---|---|---|---|
| National megaprojects | Visibility, >US$1bn | >US$1bn | 5–10y |
| PPPs | Pipeline US$10.7bn | Varies | 5–15y |
| Industrial | Nearshoring | >US$100m | 18–36m |
What is included in the product
Detailed Word Document
In-depth review of ICA's portfolio using BCG quadrants, advising where to invest, hold or divest while noting trends and risks.
Customizable Excel Spreadsheet
One-page ICA BCG Matrix placing each business unit in a quadrant to simplify prioritization and speed strategic decisions.
Cash Cows
Mature toll-road concessions
Mature toll-road concessions show stable traffic broadly recovered to 2019 levels by 2024, with optimized O&M driving predictable free cash flow and high EBITDA conversion. Capex largely behind and yields ahead support low promotional spending; efficiency upside remains via digital tolling and tariff indexing. These assets are cash cows—steady returns while fine-tuning cost and pricing levers.
Long-term maintenance contracts
Long-term maintenance contracts for recurring network upkeep on highways and public assets typically run 3–10 years, delivering high share in defined geographies with low revenue volatility. They are easy to schedule and staff, supporting stable EBITDA and predictable cash conversion. Digitize inspections to reduce downtime and maintain service levels, then bank the cash to fund CAPEX or reduce leverage.
Government building programs
Standardized schools, clinics and admin facilities deliver repeatable scopes and tight delivery playbooks, driving predictable schedules and costs. In 2024 government building work remained a stable backlog source, with sector EBITDA margins around 5–8% and modest annual volume growth near low single digits. Competitive but familiar bidding favors selective pursuit to protect margins and cash generation.
Water treatment operations
Water treatment concessions deliver stable inflows with low cyclic capex; 2024 sector uptime >99% and EBITDA typically 25–40%, allowing cash generation to exceed operating needs. Performance KPIs (availability, NTU, energy kWh/m3) are well standardized. Targeted upgrades in 2024 raised throughput 10–15% and boosted margins by 200–400 bps.
- Stable cash: cash generation > cash needs
- KPIs: uptime >99%
- Margins: EBITDA 25–40%
- Upgrades: throughput +10–15%, margin +200–400 bps
Facilities and asset management
Facilities and asset management delivers steady O&M revenue for public and industrial clients post-build, forming a cash-cow with low growth but sticky relationships; global facilities management market was about $1.3 trillion in 2023 (Statista), underpinning stable demand.
High utilization of existing crews and systems drives strong free cash flow and predictable margins; recurring services often represent roughly 60% of operator revenues, making this business ideal to hold and optimize while funding riskier growth bets.
- Retention: >85% client stickiness
- Revenue mix: ~60% recurring O&M
- Market size: $1.3T (2023)
- Strategy: Hold, optimize, fund growth
Stable cash flow from mature concessions: uptime >99%, EBITDA 25–40%, retention >85%
Mature concessions and recurring O&M generate predictable free cash flow with capex largely behind; traffic broadly recovered to 2019 levels by 2024 and uptime >99%. EBITDA typically 25–40% for utilities, 5–8% for government buildings; client retention >85% and recurring O&M ~60% of revenues. Hold, optimize, and redeploy cash to growth or deleveraging.
| Asset | EBITDA | Cash gen | Retention |
|---|---|---|---|
| Water | 25–40% | FCF >needs | >85% |
| Facilities | 5–15% | Recurring ~60% | >85% |
Preview = Final Product
ICA BCG Matrix
The file you're previewing is the exact ICA BCG Matrix document you'll receive after purchase — no watermarks, no placeholders, just the finished report. It’s been crafted for clear strategic use and formatted for immediate editing, printing, or presenting. Buy once and you get the full, ready-to-use file delivered straight to your inbox. No surprises, no extra steps — just a professional analysis you can act on right away.











