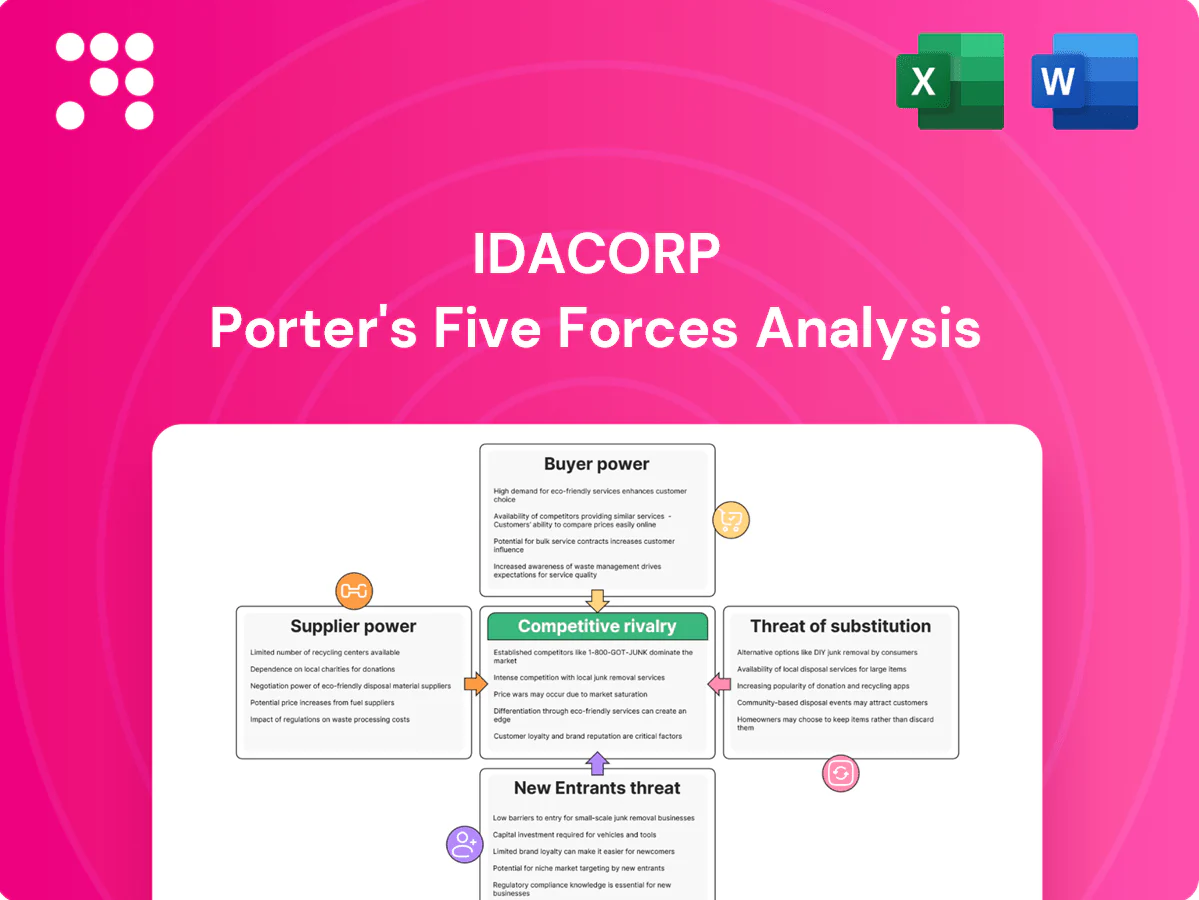
IdaCorp Porter's Five Forces Analysis

Don't Miss the Bigger Picture
IdaCorp faces moderate supplier power, steady buyer demand, and niche competitive rivalry that shapes its pricing and margin potential; regulatory and infrastructure risks add external pressure. This brief snapshot only scratches the surface. Unlock the full Porter's Five Forces Analysis to explore IdaCorp’s competitive dynamics, market pressures, and strategic advantages in detail.
Suppliers Bargaining Power

Concentrated fuel suppliers
Idaho Power sources a majority of generation from hydropower (>50% in 2024) but relies on a concentrated set of natural gas and coal producers/transporters for the remaining thermal ~40%, elevating supplier leverage. Pipeline capacity limits and rail logistics create tangible bottleneck risk for thermal deliveries. Long-term contracts and a diversified fuel mix blunt price spikes, yet market volatility can still pressure fuel costs. Drought risk can quickly shift reliance back to thermal fuels.
OEM and grid equipment dependence
Transformers, turbines and advanced meters come from a few global OEMs (ABB, Siemens, GE/Toshiba/Mitsubishi) with typical lead times of 12–36 months for transformers/turbines and 6–12 months for meters in 2024; supply shocks have driven replacement costs up by double-digit percentages and delayed projects. Standardization and multi-vendor frameworks reduce exposure, but specialty parts remain tight and regulatory reliability mandates constrain deferral of critical purchases.

Renewables and PPA counterparties
Independent power producers deliver solar and wind to IdaCorp via PPAs and gain leverage when project pipelines are tight; 2024 US interconnection queues totaled roughly 1.2 TW, and IRA tax incentives of up to 30% tilt bargaining power toward sellers.
Competitive solicitations and transparent RFPs have pushed median US solar PPA prices to about 25–35 USD/MWh in 2024, tempering seller power.
Contract structures with fixed or indexed rates allocate risk and cap IdaCorp exposure through price floors, escalation clauses, and termination provisions.

Labor and specialized contractors
- Short regional supply
- Overtime-driven wage pressure
- Union-constrained flexibility
- Training mitigates but not removes risk
Water rights and hydrology constraints
Hydropower depends on basin water availability; water rights and environmental rules function as supplier constraints. Droughts shift the dispatch stack and raised marginal costs in 2024 as hydropower provided about 6.5% of US generation. Coordination with agencies restricts operational autonomy; portfolio hedging and storage reduce variability but cannot fully offset it.
- Water availability: basin-level constraint
- 2024: ~6.5% US gen, droughts ↑ marginal costs
- Regulatory coordination limits dispatch
- Hedging/storage mitigate, not eliminate risk
Supplier power rises: hydropower >50%, thermal ~40%, OEM delays
IdaCorp faces elevated supplier power: hydropower >50% (2024) but ~40% thermal reliant on concentrated gas/coal suppliers and constrained pipelines/rail. OEM lead times 12–36 months raised capex; meters 6–12 months. Solar PPA median 25–35 USD/MWh (2024) and 1.2 TW interconnection queue boost IPP leverage. Skilled linemen scarce, union rules and drought-driven water rights amplify supplier influence.
| Metric | 2024 |
|---|---|
| Hydropower share | >50% |
| Thermal reliance | ~40% |
| Transformer lead time | 12–36 mo |
| Solar PPA | 25–35 USD/MWh |
| Interconnection queue | ~1.2 TW |
What is included in the product
 Detailed Word Document
Tailored Porter's Five Forces analysis for IdaCorp, uncovering key drivers of competition, buyer and supplier power, substitution risks, and barriers to entry that shape its profitability and strategic positioning.

 Customizable Excel Spreadsheet
A one-sheet, customizable Porter’s Five Forces for IdaCorp—visual spider chart and editable pressure levels to speed strategic decisions and slide-ready summaries; no macros, easy for non-finance users and seamless to plug into reports or dashboards.
Customers Bargaining Power

Regulated retail customers
Retail customers are effectively captive within Idaho Power's service territory, limiting direct switching and making retail bargaining power low; however regulatory oversight gives them indirect leverage through the Idaho Public Utilities Commission, which approves retail rates. Affordability and service-quality complaints can sway rate rulings and rider approvals. Low short-run price elasticity of demand for electricity (around -0.2) reduces volume risk but increases political sensitivity.
Large C&I key accounts
In 2024 large C&I key accounts exert strong bargaining power over IdaCorp, negotiating special tariffs and incentives to retain high-load operations and influence reliability priorities. Their concentrated load gives them leverage in resource planning and outage mitigation decisions. Threats to relocate or self-generate raise negotiating clout, while bespoke contracts seek to balance local economic development with cost recovery for ratepayers.

Distributed energy adopters
Rooftop solar and behind-the-meter storage let customers offset grid purchases; U.S. residential solar capacity surpassed 30 GW by 2024, boosting customer self-supply. Net metering and interconnection rules in Idaho Power/IDACORP territory materially shape effective customer leverage. Rising DER penetration pressures rate design and revenue stability, while time-of-use and demand charges aim to re-align incentives but face stakeholder scrutiny.

Municipal and cooperative counterparts
Municipal and cooperative counterparts exert strong bargaining power; in 2024 many used contract renewals to force concessions and benchmarked IdaCorp rates against neighboring utilities and market tariffs, squeezing margins. Aggregation of demand across districts amplified negotiating strength, while long-term supply agreements reduced churn but often locked in price concessions.
- renewals: leverage on terms
- benchmarking: regional rate comparisons
- aggregation: pooled demand boosts leverage
- long-term agreements: lower churn, locked concessions
Regulatory and consumer advocates
Intervenors in IDACORP rate cases amplify customer pressure on pricing and ESG, often delaying commission approvals or conditioning capital recovery; settlements frequently trade lower allowed returns for consumer protections, an indirect mechanism that materially compresses realized margins.
- Intervenor leverage: delays/conditions
- Settlement trade: returns for protections
- Impact: compresses realized margins
- IDACORP market cap ~ $7.2B (mid‑2024)
>30 GW solar and C&I renewals compress retail bargaining power
Retail customers have low direct bargaining power due to a captive territory, but ID PUC oversight gives indirect leverage; low price elasticity (~ -0.2) raises political sensitivity. Large C&I, municipal/co-op renewals and aggregation exert strong negotiation leverage. DER uptake (US residential solar >30 GW in 2024) pressures rate design. IDACORP market cap ~ $7.2B (mid-2024).
| Metric | 2024 value | Impact |
|---|---|---|
| Price elasticity | -0.2 | Low volume risk, high political sensitivity |
| Residential solar (US) | >30 GW | Increases self-supply, rate pressure |
| IDACORP market cap | $7.2B | Scale for negotiations |
Full Version Awaits
IdaCorp Porter's Five Forces Analysis
This preview shows the exact IdaCorp Porter's Five Forces analysis you'll receive immediately after purchase—no placeholders or mockups. The document is fully formatted, professionally written, and ready for download and use the moment you complete payment. You're viewing the final deliverable, identical to the file you'll get.

Don't Miss the Bigger Picture
IdaCorp faces moderate supplier power, steady buyer demand, and niche competitive rivalry that shapes its pricing and margin potential; regulatory and infrastructure risks add external pressure. This brief snapshot only scratches the surface. Unlock the full Porter's Five Forces Analysis to explore IdaCorp’s competitive dynamics, market pressures, and strategic advantages in detail.
Suppliers Bargaining Power
Concentrated fuel suppliers
Idaho Power sources a majority of generation from hydropower (>50% in 2024) but relies on a concentrated set of natural gas and coal producers/transporters for the remaining thermal ~40%, elevating supplier leverage. Pipeline capacity limits and rail logistics create tangible bottleneck risk for thermal deliveries. Long-term contracts and a diversified fuel mix blunt price spikes, yet market volatility can still pressure fuel costs. Drought risk can quickly shift reliance back to thermal fuels.
OEM and grid equipment dependence
Transformers, turbines and advanced meters come from a few global OEMs (ABB, Siemens, GE/Toshiba/Mitsubishi) with typical lead times of 12–36 months for transformers/turbines and 6–12 months for meters in 2024; supply shocks have driven replacement costs up by double-digit percentages and delayed projects. Standardization and multi-vendor frameworks reduce exposure, but specialty parts remain tight and regulatory reliability mandates constrain deferral of critical purchases.
Renewables and PPA counterparties
Independent power producers deliver solar and wind to IdaCorp via PPAs and gain leverage when project pipelines are tight; 2024 US interconnection queues totaled roughly 1.2 TW, and IRA tax incentives of up to 30% tilt bargaining power toward sellers.
Competitive solicitations and transparent RFPs have pushed median US solar PPA prices to about 25–35 USD/MWh in 2024, tempering seller power.
Contract structures with fixed or indexed rates allocate risk and cap IdaCorp exposure through price floors, escalation clauses, and termination provisions.
Labor and specialized contractors
- Short regional supply
- Overtime-driven wage pressure
- Union-constrained flexibility
- Training mitigates but not removes risk
Water rights and hydrology constraints
Hydropower depends on basin water availability; water rights and environmental rules function as supplier constraints. Droughts shift the dispatch stack and raised marginal costs in 2024 as hydropower provided about 6.5% of US generation. Coordination with agencies restricts operational autonomy; portfolio hedging and storage reduce variability but cannot fully offset it.
- Water availability: basin-level constraint
- 2024: ~6.5% US gen, droughts ↑ marginal costs
- Regulatory coordination limits dispatch
- Hedging/storage mitigate, not eliminate risk
Supplier power rises: hydropower >50%, thermal ~40%, OEM delays
IdaCorp faces elevated supplier power: hydropower >50% (2024) but ~40% thermal reliant on concentrated gas/coal suppliers and constrained pipelines/rail. OEM lead times 12–36 months raised capex; meters 6–12 months. Solar PPA median 25–35 USD/MWh (2024) and 1.2 TW interconnection queue boost IPP leverage. Skilled linemen scarce, union rules and drought-driven water rights amplify supplier influence.
| Metric | 2024 |
|---|---|
| Hydropower share | >50% |
| Thermal reliance | ~40% |
| Transformer lead time | 12–36 mo |
| Solar PPA | 25–35 USD/MWh |
| Interconnection queue | ~1.2 TW |
What is included in the product
Detailed Word Document
Tailored Porter's Five Forces analysis for IdaCorp, uncovering key drivers of competition, buyer and supplier power, substitution risks, and barriers to entry that shape its profitability and strategic positioning.
Customizable Excel Spreadsheet
A one-sheet, customizable Porter’s Five Forces for IdaCorp—visual spider chart and editable pressure levels to speed strategic decisions and slide-ready summaries; no macros, easy for non-finance users and seamless to plug into reports or dashboards.
Customers Bargaining Power
Regulated retail customers
Retail customers are effectively captive within Idaho Power's service territory, limiting direct switching and making retail bargaining power low; however regulatory oversight gives them indirect leverage through the Idaho Public Utilities Commission, which approves retail rates. Affordability and service-quality complaints can sway rate rulings and rider approvals. Low short-run price elasticity of demand for electricity (around -0.2) reduces volume risk but increases political sensitivity.
Large C&I key accounts
In 2024 large C&I key accounts exert strong bargaining power over IdaCorp, negotiating special tariffs and incentives to retain high-load operations and influence reliability priorities. Their concentrated load gives them leverage in resource planning and outage mitigation decisions. Threats to relocate or self-generate raise negotiating clout, while bespoke contracts seek to balance local economic development with cost recovery for ratepayers.
Distributed energy adopters
Rooftop solar and behind-the-meter storage let customers offset grid purchases; U.S. residential solar capacity surpassed 30 GW by 2024, boosting customer self-supply. Net metering and interconnection rules in Idaho Power/IDACORP territory materially shape effective customer leverage. Rising DER penetration pressures rate design and revenue stability, while time-of-use and demand charges aim to re-align incentives but face stakeholder scrutiny.
Municipal and cooperative counterparts
Municipal and cooperative counterparts exert strong bargaining power; in 2024 many used contract renewals to force concessions and benchmarked IdaCorp rates against neighboring utilities and market tariffs, squeezing margins. Aggregation of demand across districts amplified negotiating strength, while long-term supply agreements reduced churn but often locked in price concessions.
- renewals: leverage on terms
- benchmarking: regional rate comparisons
- aggregation: pooled demand boosts leverage
- long-term agreements: lower churn, locked concessions
Regulatory and consumer advocates
Intervenors in IDACORP rate cases amplify customer pressure on pricing and ESG, often delaying commission approvals or conditioning capital recovery; settlements frequently trade lower allowed returns for consumer protections, an indirect mechanism that materially compresses realized margins.
- Intervenor leverage: delays/conditions
- Settlement trade: returns for protections
- Impact: compresses realized margins
- IDACORP market cap ~ $7.2B (mid‑2024)
>30 GW solar and C&I renewals compress retail bargaining power
Retail customers have low direct bargaining power due to a captive territory, but ID PUC oversight gives indirect leverage; low price elasticity (~ -0.2) raises political sensitivity. Large C&I, municipal/co-op renewals and aggregation exert strong negotiation leverage. DER uptake (US residential solar >30 GW in 2024) pressures rate design. IDACORP market cap ~ $7.2B (mid-2024).
| Metric | 2024 value | Impact |
|---|---|---|
| Price elasticity | -0.2 | Low volume risk, high political sensitivity |
| Residential solar (US) | >30 GW | Increases self-supply, rate pressure |
| IDACORP market cap | $7.2B | Scale for negotiations |
Full Version Awaits
IdaCorp Porter's Five Forces Analysis
This preview shows the exact IdaCorp Porter's Five Forces analysis you'll receive immediately after purchase—no placeholders or mockups. The document is fully formatted, professionally written, and ready for download and use the moment you complete payment. You're viewing the final deliverable, identical to the file you'll get.
Original: $10.00
-65%$10.00
$3.50Description
Don't Miss the Bigger Picture
IdaCorp faces moderate supplier power, steady buyer demand, and niche competitive rivalry that shapes its pricing and margin potential; regulatory and infrastructure risks add external pressure. This brief snapshot only scratches the surface. Unlock the full Porter's Five Forces Analysis to explore IdaCorp’s competitive dynamics, market pressures, and strategic advantages in detail.
Suppliers Bargaining Power
Concentrated fuel suppliers
Idaho Power sources a majority of generation from hydropower (>50% in 2024) but relies on a concentrated set of natural gas and coal producers/transporters for the remaining thermal ~40%, elevating supplier leverage. Pipeline capacity limits and rail logistics create tangible bottleneck risk for thermal deliveries. Long-term contracts and a diversified fuel mix blunt price spikes, yet market volatility can still pressure fuel costs. Drought risk can quickly shift reliance back to thermal fuels.
OEM and grid equipment dependence
Transformers, turbines and advanced meters come from a few global OEMs (ABB, Siemens, GE/Toshiba/Mitsubishi) with typical lead times of 12–36 months for transformers/turbines and 6–12 months for meters in 2024; supply shocks have driven replacement costs up by double-digit percentages and delayed projects. Standardization and multi-vendor frameworks reduce exposure, but specialty parts remain tight and regulatory reliability mandates constrain deferral of critical purchases.
Renewables and PPA counterparties
Independent power producers deliver solar and wind to IdaCorp via PPAs and gain leverage when project pipelines are tight; 2024 US interconnection queues totaled roughly 1.2 TW, and IRA tax incentives of up to 30% tilt bargaining power toward sellers.
Competitive solicitations and transparent RFPs have pushed median US solar PPA prices to about 25–35 USD/MWh in 2024, tempering seller power.
Contract structures with fixed or indexed rates allocate risk and cap IdaCorp exposure through price floors, escalation clauses, and termination provisions.
Labor and specialized contractors
- Short regional supply
- Overtime-driven wage pressure
- Union-constrained flexibility
- Training mitigates but not removes risk
Water rights and hydrology constraints
Hydropower depends on basin water availability; water rights and environmental rules function as supplier constraints. Droughts shift the dispatch stack and raised marginal costs in 2024 as hydropower provided about 6.5% of US generation. Coordination with agencies restricts operational autonomy; portfolio hedging and storage reduce variability but cannot fully offset it.
- Water availability: basin-level constraint
- 2024: ~6.5% US gen, droughts ↑ marginal costs
- Regulatory coordination limits dispatch
- Hedging/storage mitigate, not eliminate risk
Supplier power rises: hydropower >50%, thermal ~40%, OEM delays
IdaCorp faces elevated supplier power: hydropower >50% (2024) but ~40% thermal reliant on concentrated gas/coal suppliers and constrained pipelines/rail. OEM lead times 12–36 months raised capex; meters 6–12 months. Solar PPA median 25–35 USD/MWh (2024) and 1.2 TW interconnection queue boost IPP leverage. Skilled linemen scarce, union rules and drought-driven water rights amplify supplier influence.
| Metric | 2024 |
|---|---|
| Hydropower share | >50% |
| Thermal reliance | ~40% |
| Transformer lead time | 12–36 mo |
| Solar PPA | 25–35 USD/MWh |
| Interconnection queue | ~1.2 TW |
What is included in the product
Detailed Word Document
Tailored Porter's Five Forces analysis for IdaCorp, uncovering key drivers of competition, buyer and supplier power, substitution risks, and barriers to entry that shape its profitability and strategic positioning.
Customizable Excel Spreadsheet
A one-sheet, customizable Porter’s Five Forces for IdaCorp—visual spider chart and editable pressure levels to speed strategic decisions and slide-ready summaries; no macros, easy for non-finance users and seamless to plug into reports or dashboards.
Customers Bargaining Power
Regulated retail customers
Retail customers are effectively captive within Idaho Power's service territory, limiting direct switching and making retail bargaining power low; however regulatory oversight gives them indirect leverage through the Idaho Public Utilities Commission, which approves retail rates. Affordability and service-quality complaints can sway rate rulings and rider approvals. Low short-run price elasticity of demand for electricity (around -0.2) reduces volume risk but increases political sensitivity.
Large C&I key accounts
In 2024 large C&I key accounts exert strong bargaining power over IdaCorp, negotiating special tariffs and incentives to retain high-load operations and influence reliability priorities. Their concentrated load gives them leverage in resource planning and outage mitigation decisions. Threats to relocate or self-generate raise negotiating clout, while bespoke contracts seek to balance local economic development with cost recovery for ratepayers.
Distributed energy adopters
Rooftop solar and behind-the-meter storage let customers offset grid purchases; U.S. residential solar capacity surpassed 30 GW by 2024, boosting customer self-supply. Net metering and interconnection rules in Idaho Power/IDACORP territory materially shape effective customer leverage. Rising DER penetration pressures rate design and revenue stability, while time-of-use and demand charges aim to re-align incentives but face stakeholder scrutiny.
Municipal and cooperative counterparts
Municipal and cooperative counterparts exert strong bargaining power; in 2024 many used contract renewals to force concessions and benchmarked IdaCorp rates against neighboring utilities and market tariffs, squeezing margins. Aggregation of demand across districts amplified negotiating strength, while long-term supply agreements reduced churn but often locked in price concessions.
- renewals: leverage on terms
- benchmarking: regional rate comparisons
- aggregation: pooled demand boosts leverage
- long-term agreements: lower churn, locked concessions
Regulatory and consumer advocates
Intervenors in IDACORP rate cases amplify customer pressure on pricing and ESG, often delaying commission approvals or conditioning capital recovery; settlements frequently trade lower allowed returns for consumer protections, an indirect mechanism that materially compresses realized margins.
- Intervenor leverage: delays/conditions
- Settlement trade: returns for protections
- Impact: compresses realized margins
- IDACORP market cap ~ $7.2B (mid‑2024)
>30 GW solar and C&I renewals compress retail bargaining power
Retail customers have low direct bargaining power due to a captive territory, but ID PUC oversight gives indirect leverage; low price elasticity (~ -0.2) raises political sensitivity. Large C&I, municipal/co-op renewals and aggregation exert strong negotiation leverage. DER uptake (US residential solar >30 GW in 2024) pressures rate design. IDACORP market cap ~ $7.2B (mid-2024).
| Metric | 2024 value | Impact |
|---|---|---|
| Price elasticity | -0.2 | Low volume risk, high political sensitivity |
| Residential solar (US) | >30 GW | Increases self-supply, rate pressure |
| IDACORP market cap | $7.2B | Scale for negotiations |
Full Version Awaits
IdaCorp Porter's Five Forces Analysis
This preview shows the exact IdaCorp Porter's Five Forces analysis you'll receive immediately after purchase—no placeholders or mockups. The document is fully formatted, professionally written, and ready for download and use the moment you complete payment. You're viewing the final deliverable, identical to the file you'll get.











