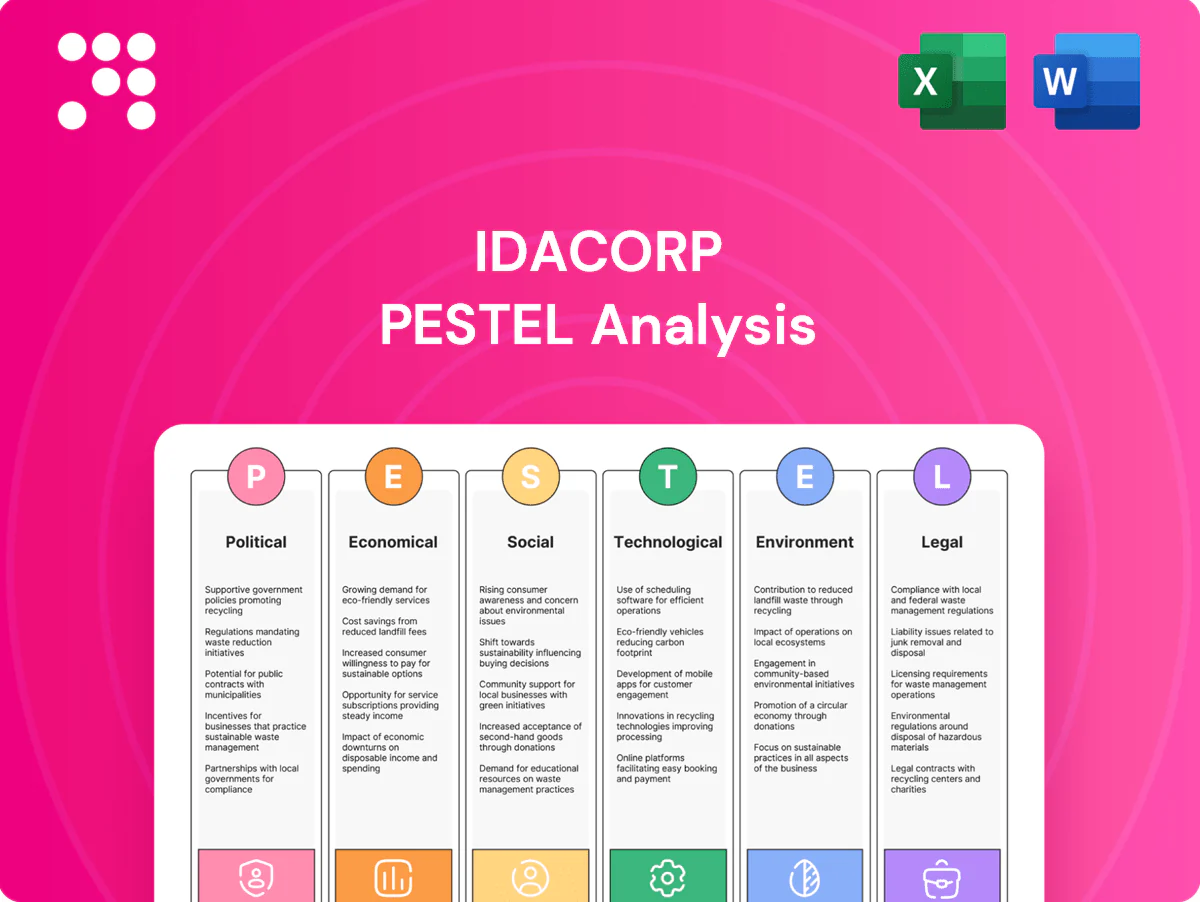
IdaCorp PESTLE Analysis

Your Competitive Advantage Starts with This Report
Discover how political, economic, social, technological, legal and environmental forces are reshaping IdaCorp's strategy and risk profile. Our concise PESTLE highlights key opportunities and threats with data-driven insight for investors and strategists. Purchase the full, editable report now to access the complete analysis and actionable recommendations.
Political factors

State utility regulation and rate setting
Idaho and Oregon public utility commissions oversee rates, resource plans and cost recovery for Idaho Power, which serves about 600,000 customers. Political priorities balancing affordability versus infrastructure investment influence rate outcomes. Leadership changes or legislative directives can shift regulatory stances. Constructive regulation is pivotal for credit profile and timely capex execution.
Federal energy and climate policy direction
Shifts in federal incentives from the 2022 Inflation Reduction Act and expanded ITC/PTC materially change resource-mix economics for IdaCorp by lowering levelized costs for renewables and storage. The US 2030 NDC targets a 50–52% reduction in GHGs vs 2005, which can accelerate clean energy procurement and corporate PPAs. Recent DOE/FERC transmission permitting reforms (2023–24) aim to shorten siting timelines, affecting project schedules and capital deployment. Policy stability remains critical for multi-decade financing and long-term rate forecasts.

Regional power market and transmission policy
FERC oversight (including Order 2222) and regional initiatives such as the Western EIM (21+ participants by 2024) materially shape wholesale pricing and reliability, influencing Idaho Power’s costs across its roughly 600,000-customer territory. Political momentum for enhanced interties—backed by federal grid funding—can expand import/export flexibility, while governance of regional entities affects dispatch and hedging strategies. Policy misalignment raises congestion and procurement risk, increasing exposure to volatile market premiums.

Wildfire prevention and public safety mandates
State emphasis on wildfire mitigation raises operating standards and capital spending for utilities like Idaho Power; utilities nationwide reacted after high-profile liabilities such as PG&E’s ~25 billion dollar 2019 wildfire-related settlement.
Public safety power shutoff policies may expand or tighten, shifting outage and liability risks; coordination with state agencies affects cost and risk allocation.
- Increased standards → higher O&M and capital costs
- PSPS expansion → operational risk and customer impact
- Wildfire cost funding → politically sensitive (liability vs. ratepayer)
- State coordination → influences who bears residual risk
Rural development and economic growth agendas
Policymakers in Idaho and eastern Oregon push electrification and rural industry expansion, supporting potential load growth while requiring grid upgrades; Idaho population ~1.9M and Oregon ~4.2M (2024 est) indicate regional scale. Incentives for data centers and manufacturing alter demand profiles and peak timing. Political support can unlock federal and state grants that lower customer bill impacts.
- Electrification + rural industry → higher load, grid upgrade needs
- Incentives change demand shape (data centers, manufacturing)
- Grants/subsidies can mitigate bill impacts
Idaho and Oregon regulatory tradeoffs reshape rates, renewable build, and wildfire costs
Regulatory decisions in Idaho and Oregon govern rates and cost recovery for Idaho Power (≈600,000 customers) with political tradeoffs between affordability and capex. Federal policies (IRA 2022, US 2030 NDC −50–52% GHG) and FERC reforms speed renewables/storage economics and transmission build. Wildfire/liability and PSPS rules raise O&M and capital demands, affecting rates and credit.
| Metric | Value (2024/25) |
|---|---|
| Idaho population | 1.9M |
| Oregon population | 4.2M |
| Idaho Power customers | ≈600,000 |
What is included in the product
 Detailed Word Document
Explores how macro-environmental factors uniquely affect IdaCorp across Political, Economic, Social, Technological, Environmental, and Legal dimensions, with data-backed trends and forward-looking insights to inform scenario planning and strategy; delivered in clean, report-ready format to help executives, consultants, and investors identify threats, opportunities, and funding-ready narratives.

 Customizable Excel Spreadsheet
A concise, visually segmented PESTLE summary of IdaCorp that’s easy to drop into presentations or share across teams, letting users add notes for their region or business line and supporting external-risk discussions during planning sessions.
Economic factors

Load growth from population and industry
Idaho population grew roughly 17.3% from 2010–2020 and is about 2.0 million (2023 est.), with migration and potential data center or agricultural‑processing projects capable of adding tens to hundreds of MW of new load. Rising peak demand trends — historically roughly 1–2% CAGR in parts of the state — shift timing for capacity additions. Economic cycles can speed or slow these investments, making accurate forecasting essential to reduce stranded‑asset risk.
Interest rates and capital intensity
Utilities fund long-lived assets largely with debt, so rising rates (Fed funds 5.25–5.50% and 10‑yr Treasury ~4.5% mid‑2025) increase revenue requirements. Allowed ROE (commonly ~9–10%) and regulated capital structures (roughly 50–60% equity) set earnings sensitivity to rate changes. Smart timing of bond issuances and tapping the green/sustainability bond market (hundreds of billions annually) can lower costs, while limited ratepayer tolerance constrains capex pacing.

Hydrology and power purchase costs
IdaCorp's hydro output is highly snowpack-dependent; in 2024 Idaho Power reported lower spring runoff that pushed incremental market purchases to cover load.
Tight regional markets drove short-term price spikes—Pacific Northwest day-ahead and real-time prices averaged elevated levels in 2024 with episodic spikes above $200/MWh.
Hedging strategies and a diversified mix of thermal and renewables cushioned volatility, but persistent multi-year drought has raised long-run procurement costs and upward pressure on wholesale contract prices.

Commodity and construction inflation
Prices for transformers, conductors and construction labor materially raise IdaCorp project budgets, while supply-chain bottlenecks push in-service dates beyond planned timelines.
Escalation clauses in contracts and strategic sourcing reduce exposure to commodity and labor inflation, but the ability to passthrough costs to customers depends on regulatory rate mechanisms and timely approval of rider adjustments.
Customer affordability and elasticity
- Median income: $63,942 (2023)
- Avg rate: 12.0¢/kWh (2024)
- High bills → conservation/DER adoption
- Risk: arrearages, political pressure
Idaho and Oregon regulatory tradeoffs reshape rates, renewable build, and wildfire costs
Idaho population ~2.0M (2023); migration and data‑center/ag‑processing projects could add tens–hundreds MW, pushing peak demand growth ~1–2% CAGR. Higher rates (Fed funds 5.25–5.50%, 10‑yr ~4.5% mid‑2025) raise funding costs; median income $63,942 (2023) vs avg rate 12.0¢/kWh (2024) affects affordability; drought/hydro variability and 2024 spikes >$200/MWh increase procurement risk.
| Metric | Value |
|---|---|
| Population | ~2.0M (2023) |
| Fed funds | 5.25–5.50% (2025) |
| 10‑yr Treasury | ~4.5% (mid‑2025) |
| Median income | $63,942 (2023) |
| Avg rate | 12.0¢/kWh (2024) |
Same Document Delivered
IdaCorp PESTLE Analysis
The preview shown here is the exact IdaCorp PESTLE Analysis you’ll receive after purchase—fully formatted, professionally structured, and ready to use. The layout, content, and structure visible in this preview are delivered exactly as shown with no placeholders or teasers. After checkout you’ll be able to download this same finished file immediately.

Your Competitive Advantage Starts with This Report
Discover how political, economic, social, technological, legal and environmental forces are reshaping IdaCorp's strategy and risk profile. Our concise PESTLE highlights key opportunities and threats with data-driven insight for investors and strategists. Purchase the full, editable report now to access the complete analysis and actionable recommendations.
Political factors
State utility regulation and rate setting
Idaho and Oregon public utility commissions oversee rates, resource plans and cost recovery for Idaho Power, which serves about 600,000 customers. Political priorities balancing affordability versus infrastructure investment influence rate outcomes. Leadership changes or legislative directives can shift regulatory stances. Constructive regulation is pivotal for credit profile and timely capex execution.
Federal energy and climate policy direction
Shifts in federal incentives from the 2022 Inflation Reduction Act and expanded ITC/PTC materially change resource-mix economics for IdaCorp by lowering levelized costs for renewables and storage. The US 2030 NDC targets a 50–52% reduction in GHGs vs 2005, which can accelerate clean energy procurement and corporate PPAs. Recent DOE/FERC transmission permitting reforms (2023–24) aim to shorten siting timelines, affecting project schedules and capital deployment. Policy stability remains critical for multi-decade financing and long-term rate forecasts.
Regional power market and transmission policy
FERC oversight (including Order 2222) and regional initiatives such as the Western EIM (21+ participants by 2024) materially shape wholesale pricing and reliability, influencing Idaho Power’s costs across its roughly 600,000-customer territory. Political momentum for enhanced interties—backed by federal grid funding—can expand import/export flexibility, while governance of regional entities affects dispatch and hedging strategies. Policy misalignment raises congestion and procurement risk, increasing exposure to volatile market premiums.
Wildfire prevention and public safety mandates
State emphasis on wildfire mitigation raises operating standards and capital spending for utilities like Idaho Power; utilities nationwide reacted after high-profile liabilities such as PG&E’s ~25 billion dollar 2019 wildfire-related settlement.
Public safety power shutoff policies may expand or tighten, shifting outage and liability risks; coordination with state agencies affects cost and risk allocation.
- Increased standards → higher O&M and capital costs
- PSPS expansion → operational risk and customer impact
- Wildfire cost funding → politically sensitive (liability vs. ratepayer)
- State coordination → influences who bears residual risk
Rural development and economic growth agendas
Policymakers in Idaho and eastern Oregon push electrification and rural industry expansion, supporting potential load growth while requiring grid upgrades; Idaho population ~1.9M and Oregon ~4.2M (2024 est) indicate regional scale. Incentives for data centers and manufacturing alter demand profiles and peak timing. Political support can unlock federal and state grants that lower customer bill impacts.
- Electrification + rural industry → higher load, grid upgrade needs
- Incentives change demand shape (data centers, manufacturing)
- Grants/subsidies can mitigate bill impacts
Idaho and Oregon regulatory tradeoffs reshape rates, renewable build, and wildfire costs
Regulatory decisions in Idaho and Oregon govern rates and cost recovery for Idaho Power (≈600,000 customers) with political tradeoffs between affordability and capex. Federal policies (IRA 2022, US 2030 NDC −50–52% GHG) and FERC reforms speed renewables/storage economics and transmission build. Wildfire/liability and PSPS rules raise O&M and capital demands, affecting rates and credit.
| Metric | Value (2024/25) |
|---|---|
| Idaho population | 1.9M |
| Oregon population | 4.2M |
| Idaho Power customers | ≈600,000 |
What is included in the product
Detailed Word Document
Explores how macro-environmental factors uniquely affect IdaCorp across Political, Economic, Social, Technological, Environmental, and Legal dimensions, with data-backed trends and forward-looking insights to inform scenario planning and strategy; delivered in clean, report-ready format to help executives, consultants, and investors identify threats, opportunities, and funding-ready narratives.
Customizable Excel Spreadsheet
A concise, visually segmented PESTLE summary of IdaCorp that’s easy to drop into presentations or share across teams, letting users add notes for their region or business line and supporting external-risk discussions during planning sessions.
Economic factors
Load growth from population and industry
Idaho population grew roughly 17.3% from 2010–2020 and is about 2.0 million (2023 est.), with migration and potential data center or agricultural‑processing projects capable of adding tens to hundreds of MW of new load. Rising peak demand trends — historically roughly 1–2% CAGR in parts of the state — shift timing for capacity additions. Economic cycles can speed or slow these investments, making accurate forecasting essential to reduce stranded‑asset risk.
Interest rates and capital intensity
Utilities fund long-lived assets largely with debt, so rising rates (Fed funds 5.25–5.50% and 10‑yr Treasury ~4.5% mid‑2025) increase revenue requirements. Allowed ROE (commonly ~9–10%) and regulated capital structures (roughly 50–60% equity) set earnings sensitivity to rate changes. Smart timing of bond issuances and tapping the green/sustainability bond market (hundreds of billions annually) can lower costs, while limited ratepayer tolerance constrains capex pacing.
Hydrology and power purchase costs
IdaCorp's hydro output is highly snowpack-dependent; in 2024 Idaho Power reported lower spring runoff that pushed incremental market purchases to cover load.
Tight regional markets drove short-term price spikes—Pacific Northwest day-ahead and real-time prices averaged elevated levels in 2024 with episodic spikes above $200/MWh.
Hedging strategies and a diversified mix of thermal and renewables cushioned volatility, but persistent multi-year drought has raised long-run procurement costs and upward pressure on wholesale contract prices.
Commodity and construction inflation
Prices for transformers, conductors and construction labor materially raise IdaCorp project budgets, while supply-chain bottlenecks push in-service dates beyond planned timelines.
Escalation clauses in contracts and strategic sourcing reduce exposure to commodity and labor inflation, but the ability to passthrough costs to customers depends on regulatory rate mechanisms and timely approval of rider adjustments.
Customer affordability and elasticity
- Median income: $63,942 (2023)
- Avg rate: 12.0¢/kWh (2024)
- High bills → conservation/DER adoption
- Risk: arrearages, political pressure
Idaho and Oregon regulatory tradeoffs reshape rates, renewable build, and wildfire costs
Idaho population ~2.0M (2023); migration and data‑center/ag‑processing projects could add tens–hundreds MW, pushing peak demand growth ~1–2% CAGR. Higher rates (Fed funds 5.25–5.50%, 10‑yr ~4.5% mid‑2025) raise funding costs; median income $63,942 (2023) vs avg rate 12.0¢/kWh (2024) affects affordability; drought/hydro variability and 2024 spikes >$200/MWh increase procurement risk.
| Metric | Value |
|---|---|
| Population | ~2.0M (2023) |
| Fed funds | 5.25–5.50% (2025) |
| 10‑yr Treasury | ~4.5% (mid‑2025) |
| Median income | $63,942 (2023) |
| Avg rate | 12.0¢/kWh (2024) |
Same Document Delivered
IdaCorp PESTLE Analysis
The preview shown here is the exact IdaCorp PESTLE Analysis you’ll receive after purchase—fully formatted, professionally structured, and ready to use. The layout, content, and structure visible in this preview are delivered exactly as shown with no placeholders or teasers. After checkout you’ll be able to download this same finished file immediately.
Description
Your Competitive Advantage Starts with This Report
Discover how political, economic, social, technological, legal and environmental forces are reshaping IdaCorp's strategy and risk profile. Our concise PESTLE highlights key opportunities and threats with data-driven insight for investors and strategists. Purchase the full, editable report now to access the complete analysis and actionable recommendations.
Political factors
State utility regulation and rate setting
Idaho and Oregon public utility commissions oversee rates, resource plans and cost recovery for Idaho Power, which serves about 600,000 customers. Political priorities balancing affordability versus infrastructure investment influence rate outcomes. Leadership changes or legislative directives can shift regulatory stances. Constructive regulation is pivotal for credit profile and timely capex execution.
Federal energy and climate policy direction
Shifts in federal incentives from the 2022 Inflation Reduction Act and expanded ITC/PTC materially change resource-mix economics for IdaCorp by lowering levelized costs for renewables and storage. The US 2030 NDC targets a 50–52% reduction in GHGs vs 2005, which can accelerate clean energy procurement and corporate PPAs. Recent DOE/FERC transmission permitting reforms (2023–24) aim to shorten siting timelines, affecting project schedules and capital deployment. Policy stability remains critical for multi-decade financing and long-term rate forecasts.
Regional power market and transmission policy
FERC oversight (including Order 2222) and regional initiatives such as the Western EIM (21+ participants by 2024) materially shape wholesale pricing and reliability, influencing Idaho Power’s costs across its roughly 600,000-customer territory. Political momentum for enhanced interties—backed by federal grid funding—can expand import/export flexibility, while governance of regional entities affects dispatch and hedging strategies. Policy misalignment raises congestion and procurement risk, increasing exposure to volatile market premiums.
Wildfire prevention and public safety mandates
State emphasis on wildfire mitigation raises operating standards and capital spending for utilities like Idaho Power; utilities nationwide reacted after high-profile liabilities such as PG&E’s ~25 billion dollar 2019 wildfire-related settlement.
Public safety power shutoff policies may expand or tighten, shifting outage and liability risks; coordination with state agencies affects cost and risk allocation.
- Increased standards → higher O&M and capital costs
- PSPS expansion → operational risk and customer impact
- Wildfire cost funding → politically sensitive (liability vs. ratepayer)
- State coordination → influences who bears residual risk
Rural development and economic growth agendas
Policymakers in Idaho and eastern Oregon push electrification and rural industry expansion, supporting potential load growth while requiring grid upgrades; Idaho population ~1.9M and Oregon ~4.2M (2024 est) indicate regional scale. Incentives for data centers and manufacturing alter demand profiles and peak timing. Political support can unlock federal and state grants that lower customer bill impacts.
- Electrification + rural industry → higher load, grid upgrade needs
- Incentives change demand shape (data centers, manufacturing)
- Grants/subsidies can mitigate bill impacts
Idaho and Oregon regulatory tradeoffs reshape rates, renewable build, and wildfire costs
Regulatory decisions in Idaho and Oregon govern rates and cost recovery for Idaho Power (≈600,000 customers) with political tradeoffs between affordability and capex. Federal policies (IRA 2022, US 2030 NDC −50–52% GHG) and FERC reforms speed renewables/storage economics and transmission build. Wildfire/liability and PSPS rules raise O&M and capital demands, affecting rates and credit.
| Metric | Value (2024/25) |
|---|---|
| Idaho population | 1.9M |
| Oregon population | 4.2M |
| Idaho Power customers | ≈600,000 |
What is included in the product
Detailed Word Document
Explores how macro-environmental factors uniquely affect IdaCorp across Political, Economic, Social, Technological, Environmental, and Legal dimensions, with data-backed trends and forward-looking insights to inform scenario planning and strategy; delivered in clean, report-ready format to help executives, consultants, and investors identify threats, opportunities, and funding-ready narratives.
Customizable Excel Spreadsheet
A concise, visually segmented PESTLE summary of IdaCorp that’s easy to drop into presentations or share across teams, letting users add notes for their region or business line and supporting external-risk discussions during planning sessions.
Economic factors
Load growth from population and industry
Idaho population grew roughly 17.3% from 2010–2020 and is about 2.0 million (2023 est.), with migration and potential data center or agricultural‑processing projects capable of adding tens to hundreds of MW of new load. Rising peak demand trends — historically roughly 1–2% CAGR in parts of the state — shift timing for capacity additions. Economic cycles can speed or slow these investments, making accurate forecasting essential to reduce stranded‑asset risk.
Interest rates and capital intensity
Utilities fund long-lived assets largely with debt, so rising rates (Fed funds 5.25–5.50% and 10‑yr Treasury ~4.5% mid‑2025) increase revenue requirements. Allowed ROE (commonly ~9–10%) and regulated capital structures (roughly 50–60% equity) set earnings sensitivity to rate changes. Smart timing of bond issuances and tapping the green/sustainability bond market (hundreds of billions annually) can lower costs, while limited ratepayer tolerance constrains capex pacing.
Hydrology and power purchase costs
IdaCorp's hydro output is highly snowpack-dependent; in 2024 Idaho Power reported lower spring runoff that pushed incremental market purchases to cover load.
Tight regional markets drove short-term price spikes—Pacific Northwest day-ahead and real-time prices averaged elevated levels in 2024 with episodic spikes above $200/MWh.
Hedging strategies and a diversified mix of thermal and renewables cushioned volatility, but persistent multi-year drought has raised long-run procurement costs and upward pressure on wholesale contract prices.
Commodity and construction inflation
Prices for transformers, conductors and construction labor materially raise IdaCorp project budgets, while supply-chain bottlenecks push in-service dates beyond planned timelines.
Escalation clauses in contracts and strategic sourcing reduce exposure to commodity and labor inflation, but the ability to passthrough costs to customers depends on regulatory rate mechanisms and timely approval of rider adjustments.
Customer affordability and elasticity
- Median income: $63,942 (2023)
- Avg rate: 12.0¢/kWh (2024)
- High bills → conservation/DER adoption
- Risk: arrearages, political pressure
Idaho and Oregon regulatory tradeoffs reshape rates, renewable build, and wildfire costs
Idaho population ~2.0M (2023); migration and data‑center/ag‑processing projects could add tens–hundreds MW, pushing peak demand growth ~1–2% CAGR. Higher rates (Fed funds 5.25–5.50%, 10‑yr ~4.5% mid‑2025) raise funding costs; median income $63,942 (2023) vs avg rate 12.0¢/kWh (2024) affects affordability; drought/hydro variability and 2024 spikes >$200/MWh increase procurement risk.
| Metric | Value |
|---|---|
| Population | ~2.0M (2023) |
| Fed funds | 5.25–5.50% (2025) |
| 10‑yr Treasury | ~4.5% (mid‑2025) |
| Median income | $63,942 (2023) |
| Avg rate | 12.0¢/kWh (2024) |
Same Document Delivered
IdaCorp PESTLE Analysis
The preview shown here is the exact IdaCorp PESTLE Analysis you’ll receive after purchase—fully formatted, professionally structured, and ready to use. The layout, content, and structure visible in this preview are delivered exactly as shown with no placeholders or teasers. After checkout you’ll be able to download this same finished file immediately.











