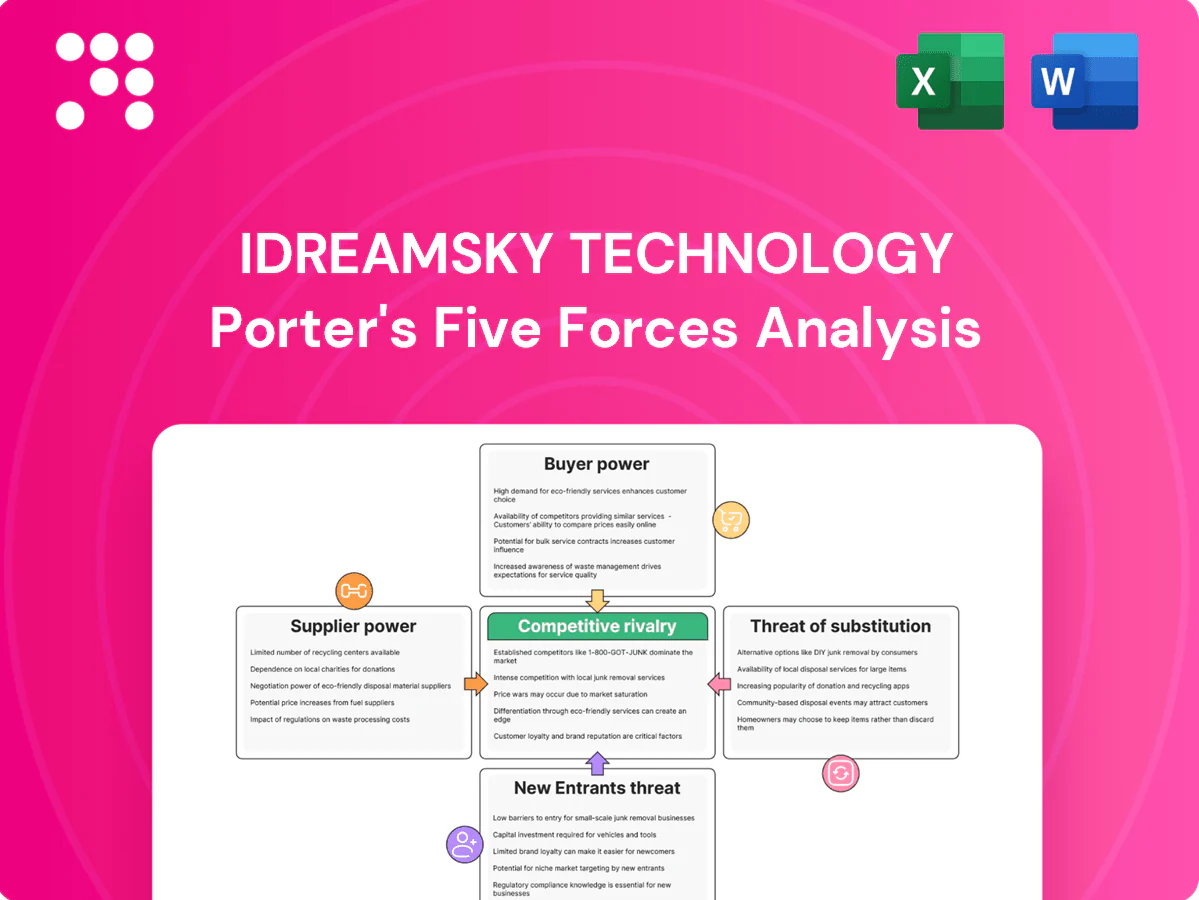
iDreamSky Technology Porter's Five Forces Analysis

A Must-Have Tool for Decision-Makers
iDreamSky Technology faces evolving competitive forces—from concentrated publishers and platform dependency to moderate new-entrant risk as mobile gaming scales globally. Supplier bargaining (ad networks, app stores) and substitute entertainment heighten margin pressure, while buyer power from gamers and advertisers demands innovation. This brief snapshot only scratches the surface; unlock the full Porter's Five Forces Analysis to explore force-by-force ratings, visuals, and strategic implications.
Suppliers Bargaining Power

Concentrated IP licensors
Concentrated IP licensors — few hit franchises and global owners (console/PC brands, anime/comics) wield outsized leverage, routinely securing upfront guarantees often in the $1–10M range and revenue shares or royalties of 20–40% plus marketing commitments. Losing a marquee IP can cut catalog attractiveness materially; top-tier licensed titles can drive double-digit percentage swings in quarterly downloads and revenue. This concentration raises supplier power sharply against publishers like iDreamSky.
Gatekeeping app stores/platforms
Distribution in China is dominated by major Android stores, Tencent channels and Apple, with third-party Android stores driving over 70% of installs while Apple maintains a 30% standard commission. Store algorithms and paid promotion slots shape traffic and CPI, often inflating UA costs. Mandatory SDK/payment integration and compliance requirements raise switching costs, skewing negotiation leverage to platforms due to discovery dependence.

Engine, cloud, and tool vendors
Game engines, analytics, ads-mediation and CDN/cloud providers are somewhat substitutable but switching mid-live is costly and risks player churn; Unity and Unreal together account for the majority of engine use per 2024 developer surveys. Cloud market concentration (AWS 32%, Azure 23%, GCP 10% in 2024, Synergy) enables volume pricing but premium features create lock-in. Outages or policy shifts directly dent DAU and monetization, producing moderate supplier power via technical dependence.

Specialized external studios
Third-party studios with proven hits can dictate milestone, royalty, and live-ops support terms, elevating supplier leverage; in 2024 China remained the world's second-largest mobile games market, keeping demand for proven partners high. Scarcity of teams skilled in China localization and regulatory compliance further strengthens their position, though performance-based deals and diversified pipelines reduce single-studio exposure.
- Proven studios dictate terms
- China localization scarcity = higher bargaining
- Performance-based deals align incentives
- Pipeline diversification cuts single-studio risk
Regulatory/licensing gatekeepers
High supplier power: $1–10M IP guarantees, 20–40% royalties; stores & regulators dominate discovery
iDreamSky faces high supplier power: concentrated IP licensors demand $1–10M guarantees and 20–40% royalties; distribution platforms (third-party Android >70% installs, Apple 30% fee) control discovery and CPI; engines/cloud (Unity+Unreal majority; AWS 32%/Azure 23%/GCP 10% in 2024) and top studios command premium terms; NPPA and data laws add non-market leverage and compliance costs.
| Supplier | Power | 2024 Metric |
|---|---|---|
| IP licensors | High | $1–10M guarantees; 20–40% royalties |
| Stores | High | Third-party Android >70% installs; Apple 30% fee |
| Tech/Cloud | Moderate | Unity/Unreal majority; AWS 32%/Azure 23%/GCP 10% |
| Studios | Moderate–High | Premium milestone/royalty terms; China = #2 market |
| Regulators | High | NPPA approvals; Data Security & PIPL (2021) |
What is included in the product
 Detailed Word Document
Comprehensive Porter's Five Forces analysis of iDreamSky Technology highlighting competitive rivalry, buyer and supplier power, threat of new entrants and substitutes, and strategic barriers protecting incumbent positioning. Actionable insights identify disruptive threats, pricing pressures, and defensive moves to sustain profitability and market share.

 Customizable Excel Spreadsheet
One-sheet Porter’s Five Forces for iDreamSky—quickly visualizes competitive pressures with an editable spider chart and customizable force levels, ideal for board decks and scenario comparisons.
Customers Bargaining Power

Low switching costs for gamers
Players can switch between free-to-play titles across Apple App Store and Google Play with minimal friction, and industry averages show day-1 retention around 30% and day-30 near 5%, amplifying churn risk. Content fatigue and event cycles accelerate player flight during lulls, forcing publishers to sustain frequent drops. Retention therefore depends on continual content releases and active community management. This dynamic gives users implicit power over monetization cadence.
Price sensitivity to IAP/ads
Whales (top 1% of players) drove roughly 60% of IAP revenue in 2024, but remain highly value‑sensitive to gacha odds, skins and battle passes. Community backlash in 2024 forced multiple publishers to adjust pricing, odds or offer refunds after social campaigns. Ad load tolerance materially affects LTV and session length; rewarded ads lifted session time ~15–25% in 2024. Transparent mechanics and fair grind reduce pushback and churn.

Multi-homing across platforms
Users routinely multi-home, with mobile accounting for 52% of global gaming revenue in 2024 and many players engaging across three or more titles, fragmenting attention and spend as competing live events and streams vie for time. Cross-promos and IP tie-ins (licensed titles boosting retention by reported mid-double digits) help iDreamSky defend wallet share. Nonetheless, fragmented attention increases buyer leverage over monetization and promotion timing.

Retail shoppers of IP goods
Retail shoppers of IP goods rapidly compare design, authenticity and price across offline and online channels; in China e-commerce penetration reached about 38% of retail sales in 2024, increasing price transparency and markdown risk as trend cycles shorten. Limited-edition drops can reduce price sensitivity and boost sell-through, while reviews and social media (short-video platforms with hundreds of millions of users) rapidly amplify demand shifts.
- compare: design/authenticity/price
- e-penetration 2024 ≈ 38%
- short trend cycles → higher markdown risk
- limited editions curb sensitivity
- reviews + social media amplify shifts
B2B channel/brand partners
Merchandise licensors and retail landlords can extract revenue shares and placement fees, commonly in the 10–30% range, while console and platform partners dictate launch windows and pricing, directly affecting monetization; iDreamSky’s dependence on channel/brand partners creates concentrated pockets of buyer power that compress margins and constrain promotional flexibility.
High churn and whale-driven IAP force rapid content cadence, mobile fragmentation
High churn (day‑1 ~30%, day‑30 ~5% in 2024) forces continuous content drops, giving users leverage over monetization cadence. Whales (~1%) delivered ~60% of IAP in 2024, making value sensitivity critical. Multi‑homing and mobile share (52% of global gaming revenue, 2024) fragment spend and increase buyer bargaining. Channel partners (licensors/landlords 10–30% rev share) compress margins.
| Metric | 2024 |
|---|---|
| Day‑1 / Day‑30 retention | ~30% / ~5% |
| Whale revenue share | ~60% |
| Mobile revenue share | 52% |
| China e‑commerce penetration | ~38% |
| Licensor/landlord rev share | 10–30% |
Preview the Actual Deliverable
iDreamSky Technology Porter's Five Forces Analysis
This preview shows the exact iDreamSky Technology Porter's Five Forces Analysis you'll receive—fully formatted, comprehensive, and ready for immediate use. No mockups or placeholders: the file displayed here is the same document available for instant download after purchase. You'll get the complete, professional analysis with all data and insights included.

A Must-Have Tool for Decision-Makers
iDreamSky Technology faces evolving competitive forces—from concentrated publishers and platform dependency to moderate new-entrant risk as mobile gaming scales globally. Supplier bargaining (ad networks, app stores) and substitute entertainment heighten margin pressure, while buyer power from gamers and advertisers demands innovation. This brief snapshot only scratches the surface; unlock the full Porter's Five Forces Analysis to explore force-by-force ratings, visuals, and strategic implications.
Suppliers Bargaining Power
Concentrated IP licensors
Concentrated IP licensors — few hit franchises and global owners (console/PC brands, anime/comics) wield outsized leverage, routinely securing upfront guarantees often in the $1–10M range and revenue shares or royalties of 20–40% plus marketing commitments. Losing a marquee IP can cut catalog attractiveness materially; top-tier licensed titles can drive double-digit percentage swings in quarterly downloads and revenue. This concentration raises supplier power sharply against publishers like iDreamSky.
Gatekeeping app stores/platforms
Distribution in China is dominated by major Android stores, Tencent channels and Apple, with third-party Android stores driving over 70% of installs while Apple maintains a 30% standard commission. Store algorithms and paid promotion slots shape traffic and CPI, often inflating UA costs. Mandatory SDK/payment integration and compliance requirements raise switching costs, skewing negotiation leverage to platforms due to discovery dependence.
Engine, cloud, and tool vendors
Game engines, analytics, ads-mediation and CDN/cloud providers are somewhat substitutable but switching mid-live is costly and risks player churn; Unity and Unreal together account for the majority of engine use per 2024 developer surveys. Cloud market concentration (AWS 32%, Azure 23%, GCP 10% in 2024, Synergy) enables volume pricing but premium features create lock-in. Outages or policy shifts directly dent DAU and monetization, producing moderate supplier power via technical dependence.
Specialized external studios
Third-party studios with proven hits can dictate milestone, royalty, and live-ops support terms, elevating supplier leverage; in 2024 China remained the world's second-largest mobile games market, keeping demand for proven partners high. Scarcity of teams skilled in China localization and regulatory compliance further strengthens their position, though performance-based deals and diversified pipelines reduce single-studio exposure.
- Proven studios dictate terms
- China localization scarcity = higher bargaining
- Performance-based deals align incentives
- Pipeline diversification cuts single-studio risk
Regulatory/licensing gatekeepers
High supplier power: $1–10M IP guarantees, 20–40% royalties; stores & regulators dominate discovery
iDreamSky faces high supplier power: concentrated IP licensors demand $1–10M guarantees and 20–40% royalties; distribution platforms (third-party Android >70% installs, Apple 30% fee) control discovery and CPI; engines/cloud (Unity+Unreal majority; AWS 32%/Azure 23%/GCP 10% in 2024) and top studios command premium terms; NPPA and data laws add non-market leverage and compliance costs.
| Supplier | Power | 2024 Metric |
|---|---|---|
| IP licensors | High | $1–10M guarantees; 20–40% royalties |
| Stores | High | Third-party Android >70% installs; Apple 30% fee |
| Tech/Cloud | Moderate | Unity/Unreal majority; AWS 32%/Azure 23%/GCP 10% |
| Studios | Moderate–High | Premium milestone/royalty terms; China = #2 market |
| Regulators | High | NPPA approvals; Data Security & PIPL (2021) |
What is included in the product
Detailed Word Document
Comprehensive Porter's Five Forces analysis of iDreamSky Technology highlighting competitive rivalry, buyer and supplier power, threat of new entrants and substitutes, and strategic barriers protecting incumbent positioning. Actionable insights identify disruptive threats, pricing pressures, and defensive moves to sustain profitability and market share.
Customizable Excel Spreadsheet
One-sheet Porter’s Five Forces for iDreamSky—quickly visualizes competitive pressures with an editable spider chart and customizable force levels, ideal for board decks and scenario comparisons.
Customers Bargaining Power
Low switching costs for gamers
Players can switch between free-to-play titles across Apple App Store and Google Play with minimal friction, and industry averages show day-1 retention around 30% and day-30 near 5%, amplifying churn risk. Content fatigue and event cycles accelerate player flight during lulls, forcing publishers to sustain frequent drops. Retention therefore depends on continual content releases and active community management. This dynamic gives users implicit power over monetization cadence.
Price sensitivity to IAP/ads
Whales (top 1% of players) drove roughly 60% of IAP revenue in 2024, but remain highly value‑sensitive to gacha odds, skins and battle passes. Community backlash in 2024 forced multiple publishers to adjust pricing, odds or offer refunds after social campaigns. Ad load tolerance materially affects LTV and session length; rewarded ads lifted session time ~15–25% in 2024. Transparent mechanics and fair grind reduce pushback and churn.
Multi-homing across platforms
Users routinely multi-home, with mobile accounting for 52% of global gaming revenue in 2024 and many players engaging across three or more titles, fragmenting attention and spend as competing live events and streams vie for time. Cross-promos and IP tie-ins (licensed titles boosting retention by reported mid-double digits) help iDreamSky defend wallet share. Nonetheless, fragmented attention increases buyer leverage over monetization and promotion timing.
Retail shoppers of IP goods
Retail shoppers of IP goods rapidly compare design, authenticity and price across offline and online channels; in China e-commerce penetration reached about 38% of retail sales in 2024, increasing price transparency and markdown risk as trend cycles shorten. Limited-edition drops can reduce price sensitivity and boost sell-through, while reviews and social media (short-video platforms with hundreds of millions of users) rapidly amplify demand shifts.
- compare: design/authenticity/price
- e-penetration 2024 ≈ 38%
- short trend cycles → higher markdown risk
- limited editions curb sensitivity
- reviews + social media amplify shifts
B2B channel/brand partners
Merchandise licensors and retail landlords can extract revenue shares and placement fees, commonly in the 10–30% range, while console and platform partners dictate launch windows and pricing, directly affecting monetization; iDreamSky’s dependence on channel/brand partners creates concentrated pockets of buyer power that compress margins and constrain promotional flexibility.
High churn and whale-driven IAP force rapid content cadence, mobile fragmentation
High churn (day‑1 ~30%, day‑30 ~5% in 2024) forces continuous content drops, giving users leverage over monetization cadence. Whales (~1%) delivered ~60% of IAP in 2024, making value sensitivity critical. Multi‑homing and mobile share (52% of global gaming revenue, 2024) fragment spend and increase buyer bargaining. Channel partners (licensors/landlords 10–30% rev share) compress margins.
| Metric | 2024 |
|---|---|
| Day‑1 / Day‑30 retention | ~30% / ~5% |
| Whale revenue share | ~60% |
| Mobile revenue share | 52% |
| China e‑commerce penetration | ~38% |
| Licensor/landlord rev share | 10–30% |
Preview the Actual Deliverable
iDreamSky Technology Porter's Five Forces Analysis
This preview shows the exact iDreamSky Technology Porter's Five Forces Analysis you'll receive—fully formatted, comprehensive, and ready for immediate use. No mockups or placeholders: the file displayed here is the same document available for instant download after purchase. You'll get the complete, professional analysis with all data and insights included.
Original: $10.00
-65%$10.00
$3.50Description
A Must-Have Tool for Decision-Makers
iDreamSky Technology faces evolving competitive forces—from concentrated publishers and platform dependency to moderate new-entrant risk as mobile gaming scales globally. Supplier bargaining (ad networks, app stores) and substitute entertainment heighten margin pressure, while buyer power from gamers and advertisers demands innovation. This brief snapshot only scratches the surface; unlock the full Porter's Five Forces Analysis to explore force-by-force ratings, visuals, and strategic implications.
Suppliers Bargaining Power
Concentrated IP licensors
Concentrated IP licensors — few hit franchises and global owners (console/PC brands, anime/comics) wield outsized leverage, routinely securing upfront guarantees often in the $1–10M range and revenue shares or royalties of 20–40% plus marketing commitments. Losing a marquee IP can cut catalog attractiveness materially; top-tier licensed titles can drive double-digit percentage swings in quarterly downloads and revenue. This concentration raises supplier power sharply against publishers like iDreamSky.
Gatekeeping app stores/platforms
Distribution in China is dominated by major Android stores, Tencent channels and Apple, with third-party Android stores driving over 70% of installs while Apple maintains a 30% standard commission. Store algorithms and paid promotion slots shape traffic and CPI, often inflating UA costs. Mandatory SDK/payment integration and compliance requirements raise switching costs, skewing negotiation leverage to platforms due to discovery dependence.
Engine, cloud, and tool vendors
Game engines, analytics, ads-mediation and CDN/cloud providers are somewhat substitutable but switching mid-live is costly and risks player churn; Unity and Unreal together account for the majority of engine use per 2024 developer surveys. Cloud market concentration (AWS 32%, Azure 23%, GCP 10% in 2024, Synergy) enables volume pricing but premium features create lock-in. Outages or policy shifts directly dent DAU and monetization, producing moderate supplier power via technical dependence.
Specialized external studios
Third-party studios with proven hits can dictate milestone, royalty, and live-ops support terms, elevating supplier leverage; in 2024 China remained the world's second-largest mobile games market, keeping demand for proven partners high. Scarcity of teams skilled in China localization and regulatory compliance further strengthens their position, though performance-based deals and diversified pipelines reduce single-studio exposure.
- Proven studios dictate terms
- China localization scarcity = higher bargaining
- Performance-based deals align incentives
- Pipeline diversification cuts single-studio risk
Regulatory/licensing gatekeepers
High supplier power: $1–10M IP guarantees, 20–40% royalties; stores & regulators dominate discovery
iDreamSky faces high supplier power: concentrated IP licensors demand $1–10M guarantees and 20–40% royalties; distribution platforms (third-party Android >70% installs, Apple 30% fee) control discovery and CPI; engines/cloud (Unity+Unreal majority; AWS 32%/Azure 23%/GCP 10% in 2024) and top studios command premium terms; NPPA and data laws add non-market leverage and compliance costs.
| Supplier | Power | 2024 Metric |
|---|---|---|
| IP licensors | High | $1–10M guarantees; 20–40% royalties |
| Stores | High | Third-party Android >70% installs; Apple 30% fee |
| Tech/Cloud | Moderate | Unity/Unreal majority; AWS 32%/Azure 23%/GCP 10% |
| Studios | Moderate–High | Premium milestone/royalty terms; China = #2 market |
| Regulators | High | NPPA approvals; Data Security & PIPL (2021) |
What is included in the product
Detailed Word Document
Comprehensive Porter's Five Forces analysis of iDreamSky Technology highlighting competitive rivalry, buyer and supplier power, threat of new entrants and substitutes, and strategic barriers protecting incumbent positioning. Actionable insights identify disruptive threats, pricing pressures, and defensive moves to sustain profitability and market share.
Customizable Excel Spreadsheet
One-sheet Porter’s Five Forces for iDreamSky—quickly visualizes competitive pressures with an editable spider chart and customizable force levels, ideal for board decks and scenario comparisons.
Customers Bargaining Power
Low switching costs for gamers
Players can switch between free-to-play titles across Apple App Store and Google Play with minimal friction, and industry averages show day-1 retention around 30% and day-30 near 5%, amplifying churn risk. Content fatigue and event cycles accelerate player flight during lulls, forcing publishers to sustain frequent drops. Retention therefore depends on continual content releases and active community management. This dynamic gives users implicit power over monetization cadence.
Price sensitivity to IAP/ads
Whales (top 1% of players) drove roughly 60% of IAP revenue in 2024, but remain highly value‑sensitive to gacha odds, skins and battle passes. Community backlash in 2024 forced multiple publishers to adjust pricing, odds or offer refunds after social campaigns. Ad load tolerance materially affects LTV and session length; rewarded ads lifted session time ~15–25% in 2024. Transparent mechanics and fair grind reduce pushback and churn.
Multi-homing across platforms
Users routinely multi-home, with mobile accounting for 52% of global gaming revenue in 2024 and many players engaging across three or more titles, fragmenting attention and spend as competing live events and streams vie for time. Cross-promos and IP tie-ins (licensed titles boosting retention by reported mid-double digits) help iDreamSky defend wallet share. Nonetheless, fragmented attention increases buyer leverage over monetization and promotion timing.
Retail shoppers of IP goods
Retail shoppers of IP goods rapidly compare design, authenticity and price across offline and online channels; in China e-commerce penetration reached about 38% of retail sales in 2024, increasing price transparency and markdown risk as trend cycles shorten. Limited-edition drops can reduce price sensitivity and boost sell-through, while reviews and social media (short-video platforms with hundreds of millions of users) rapidly amplify demand shifts.
- compare: design/authenticity/price
- e-penetration 2024 ≈ 38%
- short trend cycles → higher markdown risk
- limited editions curb sensitivity
- reviews + social media amplify shifts
B2B channel/brand partners
Merchandise licensors and retail landlords can extract revenue shares and placement fees, commonly in the 10–30% range, while console and platform partners dictate launch windows and pricing, directly affecting monetization; iDreamSky’s dependence on channel/brand partners creates concentrated pockets of buyer power that compress margins and constrain promotional flexibility.
High churn and whale-driven IAP force rapid content cadence, mobile fragmentation
High churn (day‑1 ~30%, day‑30 ~5% in 2024) forces continuous content drops, giving users leverage over monetization cadence. Whales (~1%) delivered ~60% of IAP in 2024, making value sensitivity critical. Multi‑homing and mobile share (52% of global gaming revenue, 2024) fragment spend and increase buyer bargaining. Channel partners (licensors/landlords 10–30% rev share) compress margins.
| Metric | 2024 |
|---|---|
| Day‑1 / Day‑30 retention | ~30% / ~5% |
| Whale revenue share | ~60% |
| Mobile revenue share | 52% |
| China e‑commerce penetration | ~38% |
| Licensor/landlord rev share | 10–30% |
Preview the Actual Deliverable
iDreamSky Technology Porter's Five Forces Analysis
This preview shows the exact iDreamSky Technology Porter's Five Forces Analysis you'll receive—fully formatted, comprehensive, and ready for immediate use. No mockups or placeholders: the file displayed here is the same document available for instant download after purchase. You'll get the complete, professional analysis with all data and insights included.











