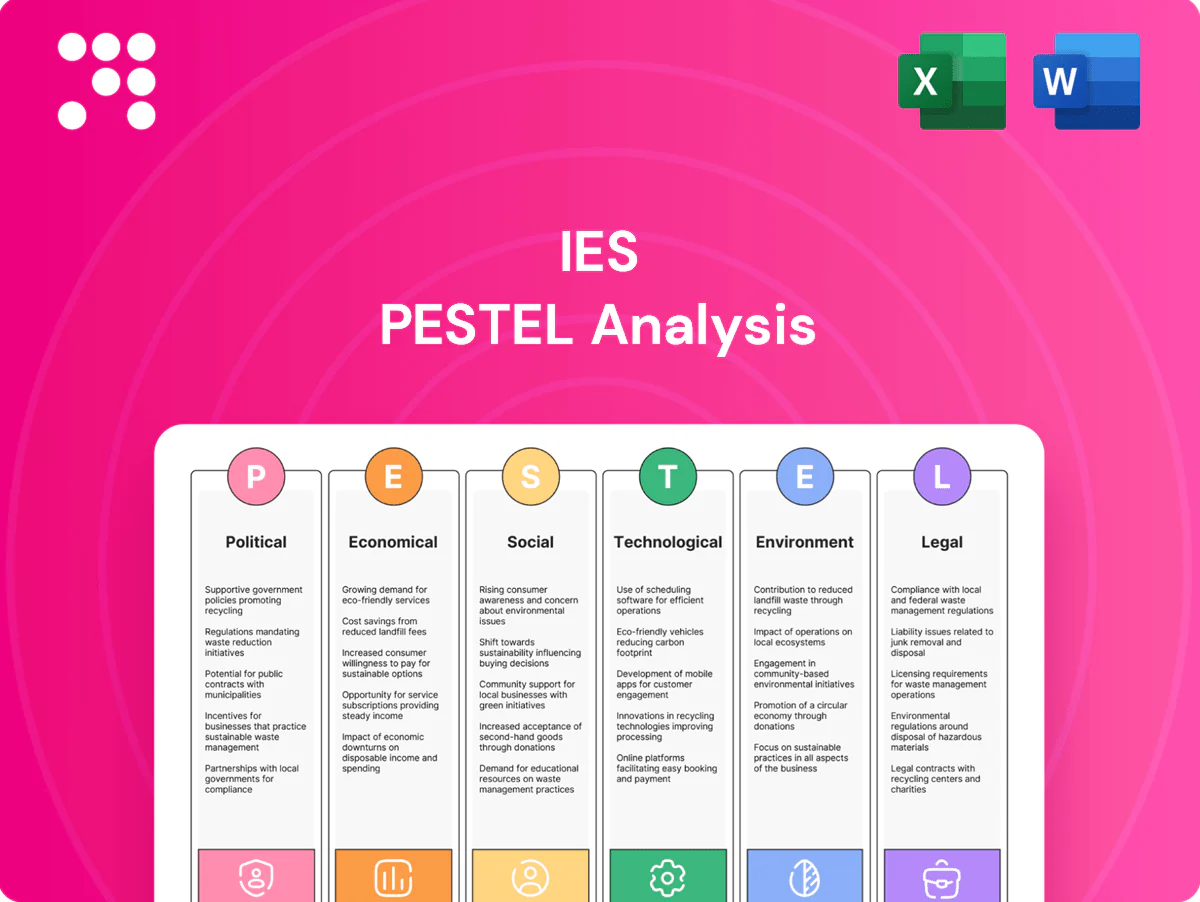
IES PESTLE Analysis

Your Competitive Advantage Starts with This Report
Gain a strategic advantage with our concise PESTLE Analysis of IES—uncover how political, economic, social, technological, legal, and environmental forces are shaping its outlook. Ideal for investors and strategists, this report translates trends into actionable insights. Save time and strengthen your forecasts with ready-to-use findings. Purchase the full analysis for the complete, editable breakdown.
Political factors

Infrastructure funding
Federal and state infrastructure bills—notably the 2021 IIJA totaling 1.2 trillion USD with roughly 550 billion USD in new spending—sharpen backlog visibility and boost contractors pricing power. Shifts in appropriations or the 2024 election cycle can accelerate or delay projects. Public-private partnerships expand bid flow but add stakeholder complexity; monitoring earmarks and agency pipelines is critical.
Permitting and zoning
Local permitting and zoning approvals directly set project start dates, scope, and capital allocation; in practice permits commonly add 3–12 months and can raise upfront costs by 5–25% on IES projects. Tightening codes or slow permitting elongate cycle times and working capital needs, while multi-jurisdictional harmonization strains project management. Early engagement with authorities mitigates delays and reduces contingency spend.

Trade and supply chains
Tariffs on electrical and mechanical components, notably US Section 301 duties of up to 25%, squeeze margins and raise bid prices across projects. Geopolitical tensions have disrupted imports of switchgear, cable and semiconductors, increasing lead times and cost volatility. Buy America rules (Build America, Buy America Act 2021 and expanded IRA requirements) are reshaping sourcing and vendor lists; diversified suppliers and buffer stocks mitigate these risks.

Labor and immigration policy
- H-2B cap: 66,000
- Bipartisan Infrastructure Law: 1.2 trillion USD
- Risks: penalties, lost contract awards
Energy and industrial policy
Energy and industrial policy—driven by US IRA tax credits (up to 30% for many clean investments), CHIPS Act reshoring incentives (~52 billion USD), and record renewable capacity additions (roughly 540 GW globally in 2023)—boosts demand for grid upgrades, renewables, and electrification; policy reversals can abruptly stall multi-year capital programs and project IRRs.
- Support for grid upgrades raises CAPEX pipelines
- Tax credits (IRA up to 30%) improve customer ROI
- Reshoring (CHIPS ~52B) lifts industrial electrification demand
- Policy flips can halt sector investments
IIJA funding, tariffs and permitting delays drive 2024–25 project starts, pricing and sourcing
Federal/state funding (IIJA 1.2 trillion; ~550B new) and 2024–25 election timing drive project starts and pricing; PPPs and earmarks expand bids but add stakeholders. Permitting commonly delays 3–12 months and raises upfront costs 5–25%. Tariffs (Section 301 up to 25%), Buy America, H-2B cap 66,000, IRA tax credits (~30%) and CHIPS (~52B) reshape sourcing, labor and demand.
| Item | 2024–25 metric | Impact |
|---|---|---|
| IIJA | 1.2 trillion; ~550B new | Higher backlog, pricing power |
| Permitting | +3–12 months | ↑CAPEX, working capital |
| Tariffs/Buy America | Section 301 up to 25% | Cost/lead-time volatility |
What is included in the product
 Detailed Word Document
Explores how external macro-environmental factors uniquely affect the IES across Political, Economic, Social, Technological, Environmental and Legal dimensions, with data-backed trends and region-specific regulatory context to identify threats and opportunities. Delivered in clean, investor-ready format with forward-looking insights and detailed sub-points to support strategy, scenario planning and funding discussions.

 Customizable Excel Spreadsheet
IES PESTLE Analysis condenses complex external factors into a clean, visually segmented summary that’s editable for local context and easily dropped into presentations, enabling fast team alignment and focused risk and market-positioning discussions.
Economic factors

Construction cycles
Commercial, industrial and residential demand swings drive backlog volatility—IES backlogs can shift ~25% year-over-year as project pipelines tighten. Recessions compress bid margins and extend receivables, reducing gross margins by several hundred basis points in 2020–24 downturns. Diversified end-markets smooth cyclicality across portfolios. ISM PMI (avg 49.8 in 2024) and US housing starts (~1.3M annualized in 2024) guide capacity planning.
Interest rates
Higher interest rates—US federal funds near 5.25% and 10-year Treasury around 4% in 2024–25—raise bond and construction finance costs, damping new development and pushing customers to delay or downscale projects. Working capital financing becomes pricier as bank spreads widen, so strict cash discipline and milestone billing preserve returns and liquidity.

Commodity prices
Copper at about $9,500/ton (LME July 2025), steel HRC near $800/ton and US PE ~ $1,100/ton materially drive costs on fixed-price projects, making margins sensitive. Volatility in these commodities creates bid risk when contracts lack indexation. Supplier agreements and hedging (futures/options) can stabilize gross margins. Rapid contract repricing capability is a clear competitive edge in 2024–25 markets.

Labor costs
- Wage inflation: 4–6% (2024)
- Overtime premium: +15–30%
- Offset: apprenticeships, automation
- Action: precise labor forecasting for bids
Customer capex trends
Industrial expansions, utilities and data centers drove larger project scopes in 2024 as data center capex reached roughly $200 billion and hyperscalers continued heavy buildouts, while softer housing demand cut residential volumes, with US housing starts down about 10% year‑over‑year in 2024. Budget cycles and CFO caution compressed release timing into late‑2024/2025 windows. A balanced portfolio mix preserved utilization across IES assets.
- data_center_capex_2024: ~$200B
- us_housing_starts_yoy_2024: -10%
- cfo_timing: delayed discretionary releases into 2025
- portfolio_mix: mitigated utilization risk
IIJA funding, tariffs and permitting delays drive 2024–25 project starts, pricing and sourcing
Demand swings drive ~25% YoY backlog volatility; ISM PMI 49.8 and US housing starts ~1.3M (2024) guide capacity. Fed funds ~5.25% and 10y ~4% (2024–25) raise financing costs, delaying projects. Copper ~$9,500/t, HRC ~$800/t, PE ~$1,100/t (mid‑2025) and 4–6% wage inflation (2024) compress fixed‑price margins.
| Metric | Value |
|---|---|
| Backlog volatility | ~25% YoY |
| ISM PMI (2024) | 49.8 |
| Housing starts (2024) | ~1.3M (-10%) |
| Rates | Fed ~5.25% / 10y ~4% |
| Key commodities | Cu $9,500; HRC $800; PE $1,100 |
| Wage inflation | 4–6% |
What You See Is What You Get
IES PESTLE Analysis
The preview shown here is the exact IES PESTLE Analysis document you’ll receive after purchase—fully formatted, professionally structured, and ready to use. No placeholders or teasers: the content, layout, and insights visible are included in the final file. After checkout you can download this exact document immediately.

Your Competitive Advantage Starts with This Report
Gain a strategic advantage with our concise PESTLE Analysis of IES—uncover how political, economic, social, technological, legal, and environmental forces are shaping its outlook. Ideal for investors and strategists, this report translates trends into actionable insights. Save time and strengthen your forecasts with ready-to-use findings. Purchase the full analysis for the complete, editable breakdown.
Political factors
Infrastructure funding
Federal and state infrastructure bills—notably the 2021 IIJA totaling 1.2 trillion USD with roughly 550 billion USD in new spending—sharpen backlog visibility and boost contractors pricing power. Shifts in appropriations or the 2024 election cycle can accelerate or delay projects. Public-private partnerships expand bid flow but add stakeholder complexity; monitoring earmarks and agency pipelines is critical.
Permitting and zoning
Local permitting and zoning approvals directly set project start dates, scope, and capital allocation; in practice permits commonly add 3–12 months and can raise upfront costs by 5–25% on IES projects. Tightening codes or slow permitting elongate cycle times and working capital needs, while multi-jurisdictional harmonization strains project management. Early engagement with authorities mitigates delays and reduces contingency spend.
Trade and supply chains
Tariffs on electrical and mechanical components, notably US Section 301 duties of up to 25%, squeeze margins and raise bid prices across projects. Geopolitical tensions have disrupted imports of switchgear, cable and semiconductors, increasing lead times and cost volatility. Buy America rules (Build America, Buy America Act 2021 and expanded IRA requirements) are reshaping sourcing and vendor lists; diversified suppliers and buffer stocks mitigate these risks.
Labor and immigration policy
- H-2B cap: 66,000
- Bipartisan Infrastructure Law: 1.2 trillion USD
- Risks: penalties, lost contract awards
Energy and industrial policy
Energy and industrial policy—driven by US IRA tax credits (up to 30% for many clean investments), CHIPS Act reshoring incentives (~52 billion USD), and record renewable capacity additions (roughly 540 GW globally in 2023)—boosts demand for grid upgrades, renewables, and electrification; policy reversals can abruptly stall multi-year capital programs and project IRRs.
- Support for grid upgrades raises CAPEX pipelines
- Tax credits (IRA up to 30%) improve customer ROI
- Reshoring (CHIPS ~52B) lifts industrial electrification demand
- Policy flips can halt sector investments
IIJA funding, tariffs and permitting delays drive 2024–25 project starts, pricing and sourcing
Federal/state funding (IIJA 1.2 trillion; ~550B new) and 2024–25 election timing drive project starts and pricing; PPPs and earmarks expand bids but add stakeholders. Permitting commonly delays 3–12 months and raises upfront costs 5–25%. Tariffs (Section 301 up to 25%), Buy America, H-2B cap 66,000, IRA tax credits (~30%) and CHIPS (~52B) reshape sourcing, labor and demand.
| Item | 2024–25 metric | Impact |
|---|---|---|
| IIJA | 1.2 trillion; ~550B new | Higher backlog, pricing power |
| Permitting | +3–12 months | ↑CAPEX, working capital |
| Tariffs/Buy America | Section 301 up to 25% | Cost/lead-time volatility |
What is included in the product
Detailed Word Document
Explores how external macro-environmental factors uniquely affect the IES across Political, Economic, Social, Technological, Environmental and Legal dimensions, with data-backed trends and region-specific regulatory context to identify threats and opportunities. Delivered in clean, investor-ready format with forward-looking insights and detailed sub-points to support strategy, scenario planning and funding discussions.
Customizable Excel Spreadsheet
IES PESTLE Analysis condenses complex external factors into a clean, visually segmented summary that’s editable for local context and easily dropped into presentations, enabling fast team alignment and focused risk and market-positioning discussions.
Economic factors
Construction cycles
Commercial, industrial and residential demand swings drive backlog volatility—IES backlogs can shift ~25% year-over-year as project pipelines tighten. Recessions compress bid margins and extend receivables, reducing gross margins by several hundred basis points in 2020–24 downturns. Diversified end-markets smooth cyclicality across portfolios. ISM PMI (avg 49.8 in 2024) and US housing starts (~1.3M annualized in 2024) guide capacity planning.
Interest rates
Higher interest rates—US federal funds near 5.25% and 10-year Treasury around 4% in 2024–25—raise bond and construction finance costs, damping new development and pushing customers to delay or downscale projects. Working capital financing becomes pricier as bank spreads widen, so strict cash discipline and milestone billing preserve returns and liquidity.
Commodity prices
Copper at about $9,500/ton (LME July 2025), steel HRC near $800/ton and US PE ~ $1,100/ton materially drive costs on fixed-price projects, making margins sensitive. Volatility in these commodities creates bid risk when contracts lack indexation. Supplier agreements and hedging (futures/options) can stabilize gross margins. Rapid contract repricing capability is a clear competitive edge in 2024–25 markets.
Labor costs
- Wage inflation: 4–6% (2024)
- Overtime premium: +15–30%
- Offset: apprenticeships, automation
- Action: precise labor forecasting for bids
Customer capex trends
Industrial expansions, utilities and data centers drove larger project scopes in 2024 as data center capex reached roughly $200 billion and hyperscalers continued heavy buildouts, while softer housing demand cut residential volumes, with US housing starts down about 10% year‑over‑year in 2024. Budget cycles and CFO caution compressed release timing into late‑2024/2025 windows. A balanced portfolio mix preserved utilization across IES assets.
- data_center_capex_2024: ~$200B
- us_housing_starts_yoy_2024: -10%
- cfo_timing: delayed discretionary releases into 2025
- portfolio_mix: mitigated utilization risk
IIJA funding, tariffs and permitting delays drive 2024–25 project starts, pricing and sourcing
Demand swings drive ~25% YoY backlog volatility; ISM PMI 49.8 and US housing starts ~1.3M (2024) guide capacity. Fed funds ~5.25% and 10y ~4% (2024–25) raise financing costs, delaying projects. Copper ~$9,500/t, HRC ~$800/t, PE ~$1,100/t (mid‑2025) and 4–6% wage inflation (2024) compress fixed‑price margins.
| Metric | Value |
|---|---|
| Backlog volatility | ~25% YoY |
| ISM PMI (2024) | 49.8 |
| Housing starts (2024) | ~1.3M (-10%) |
| Rates | Fed ~5.25% / 10y ~4% |
| Key commodities | Cu $9,500; HRC $800; PE $1,100 |
| Wage inflation | 4–6% |
What You See Is What You Get
IES PESTLE Analysis
The preview shown here is the exact IES PESTLE Analysis document you’ll receive after purchase—fully formatted, professionally structured, and ready to use. No placeholders or teasers: the content, layout, and insights visible are included in the final file. After checkout you can download this exact document immediately.
Description
Your Competitive Advantage Starts with This Report
Gain a strategic advantage with our concise PESTLE Analysis of IES—uncover how political, economic, social, technological, legal, and environmental forces are shaping its outlook. Ideal for investors and strategists, this report translates trends into actionable insights. Save time and strengthen your forecasts with ready-to-use findings. Purchase the full analysis for the complete, editable breakdown.
Political factors
Infrastructure funding
Federal and state infrastructure bills—notably the 2021 IIJA totaling 1.2 trillion USD with roughly 550 billion USD in new spending—sharpen backlog visibility and boost contractors pricing power. Shifts in appropriations or the 2024 election cycle can accelerate or delay projects. Public-private partnerships expand bid flow but add stakeholder complexity; monitoring earmarks and agency pipelines is critical.
Permitting and zoning
Local permitting and zoning approvals directly set project start dates, scope, and capital allocation; in practice permits commonly add 3–12 months and can raise upfront costs by 5–25% on IES projects. Tightening codes or slow permitting elongate cycle times and working capital needs, while multi-jurisdictional harmonization strains project management. Early engagement with authorities mitigates delays and reduces contingency spend.
Trade and supply chains
Tariffs on electrical and mechanical components, notably US Section 301 duties of up to 25%, squeeze margins and raise bid prices across projects. Geopolitical tensions have disrupted imports of switchgear, cable and semiconductors, increasing lead times and cost volatility. Buy America rules (Build America, Buy America Act 2021 and expanded IRA requirements) are reshaping sourcing and vendor lists; diversified suppliers and buffer stocks mitigate these risks.
Labor and immigration policy
- H-2B cap: 66,000
- Bipartisan Infrastructure Law: 1.2 trillion USD
- Risks: penalties, lost contract awards
Energy and industrial policy
Energy and industrial policy—driven by US IRA tax credits (up to 30% for many clean investments), CHIPS Act reshoring incentives (~52 billion USD), and record renewable capacity additions (roughly 540 GW globally in 2023)—boosts demand for grid upgrades, renewables, and electrification; policy reversals can abruptly stall multi-year capital programs and project IRRs.
- Support for grid upgrades raises CAPEX pipelines
- Tax credits (IRA up to 30%) improve customer ROI
- Reshoring (CHIPS ~52B) lifts industrial electrification demand
- Policy flips can halt sector investments
IIJA funding, tariffs and permitting delays drive 2024–25 project starts, pricing and sourcing
Federal/state funding (IIJA 1.2 trillion; ~550B new) and 2024–25 election timing drive project starts and pricing; PPPs and earmarks expand bids but add stakeholders. Permitting commonly delays 3–12 months and raises upfront costs 5–25%. Tariffs (Section 301 up to 25%), Buy America, H-2B cap 66,000, IRA tax credits (~30%) and CHIPS (~52B) reshape sourcing, labor and demand.
| Item | 2024–25 metric | Impact |
|---|---|---|
| IIJA | 1.2 trillion; ~550B new | Higher backlog, pricing power |
| Permitting | +3–12 months | ↑CAPEX, working capital |
| Tariffs/Buy America | Section 301 up to 25% | Cost/lead-time volatility |
What is included in the product
Detailed Word Document
Explores how external macro-environmental factors uniquely affect the IES across Political, Economic, Social, Technological, Environmental and Legal dimensions, with data-backed trends and region-specific regulatory context to identify threats and opportunities. Delivered in clean, investor-ready format with forward-looking insights and detailed sub-points to support strategy, scenario planning and funding discussions.
Customizable Excel Spreadsheet
IES PESTLE Analysis condenses complex external factors into a clean, visually segmented summary that’s editable for local context and easily dropped into presentations, enabling fast team alignment and focused risk and market-positioning discussions.
Economic factors
Construction cycles
Commercial, industrial and residential demand swings drive backlog volatility—IES backlogs can shift ~25% year-over-year as project pipelines tighten. Recessions compress bid margins and extend receivables, reducing gross margins by several hundred basis points in 2020–24 downturns. Diversified end-markets smooth cyclicality across portfolios. ISM PMI (avg 49.8 in 2024) and US housing starts (~1.3M annualized in 2024) guide capacity planning.
Interest rates
Higher interest rates—US federal funds near 5.25% and 10-year Treasury around 4% in 2024–25—raise bond and construction finance costs, damping new development and pushing customers to delay or downscale projects. Working capital financing becomes pricier as bank spreads widen, so strict cash discipline and milestone billing preserve returns and liquidity.
Commodity prices
Copper at about $9,500/ton (LME July 2025), steel HRC near $800/ton and US PE ~ $1,100/ton materially drive costs on fixed-price projects, making margins sensitive. Volatility in these commodities creates bid risk when contracts lack indexation. Supplier agreements and hedging (futures/options) can stabilize gross margins. Rapid contract repricing capability is a clear competitive edge in 2024–25 markets.
Labor costs
- Wage inflation: 4–6% (2024)
- Overtime premium: +15–30%
- Offset: apprenticeships, automation
- Action: precise labor forecasting for bids
Customer capex trends
Industrial expansions, utilities and data centers drove larger project scopes in 2024 as data center capex reached roughly $200 billion and hyperscalers continued heavy buildouts, while softer housing demand cut residential volumes, with US housing starts down about 10% year‑over‑year in 2024. Budget cycles and CFO caution compressed release timing into late‑2024/2025 windows. A balanced portfolio mix preserved utilization across IES assets.
- data_center_capex_2024: ~$200B
- us_housing_starts_yoy_2024: -10%
- cfo_timing: delayed discretionary releases into 2025
- portfolio_mix: mitigated utilization risk
IIJA funding, tariffs and permitting delays drive 2024–25 project starts, pricing and sourcing
Demand swings drive ~25% YoY backlog volatility; ISM PMI 49.8 and US housing starts ~1.3M (2024) guide capacity. Fed funds ~5.25% and 10y ~4% (2024–25) raise financing costs, delaying projects. Copper ~$9,500/t, HRC ~$800/t, PE ~$1,100/t (mid‑2025) and 4–6% wage inflation (2024) compress fixed‑price margins.
| Metric | Value |
|---|---|
| Backlog volatility | ~25% YoY |
| ISM PMI (2024) | 49.8 |
| Housing starts (2024) | ~1.3M (-10%) |
| Rates | Fed ~5.25% / 10y ~4% |
| Key commodities | Cu $9,500; HRC $800; PE $1,100 |
| Wage inflation | 4–6% |
What You See Is What You Get
IES PESTLE Analysis
The preview shown here is the exact IES PESTLE Analysis document you’ll receive after purchase—fully formatted, professionally structured, and ready to use. No placeholders or teasers: the content, layout, and insights visible are included in the final file. After checkout you can download this exact document immediately.











