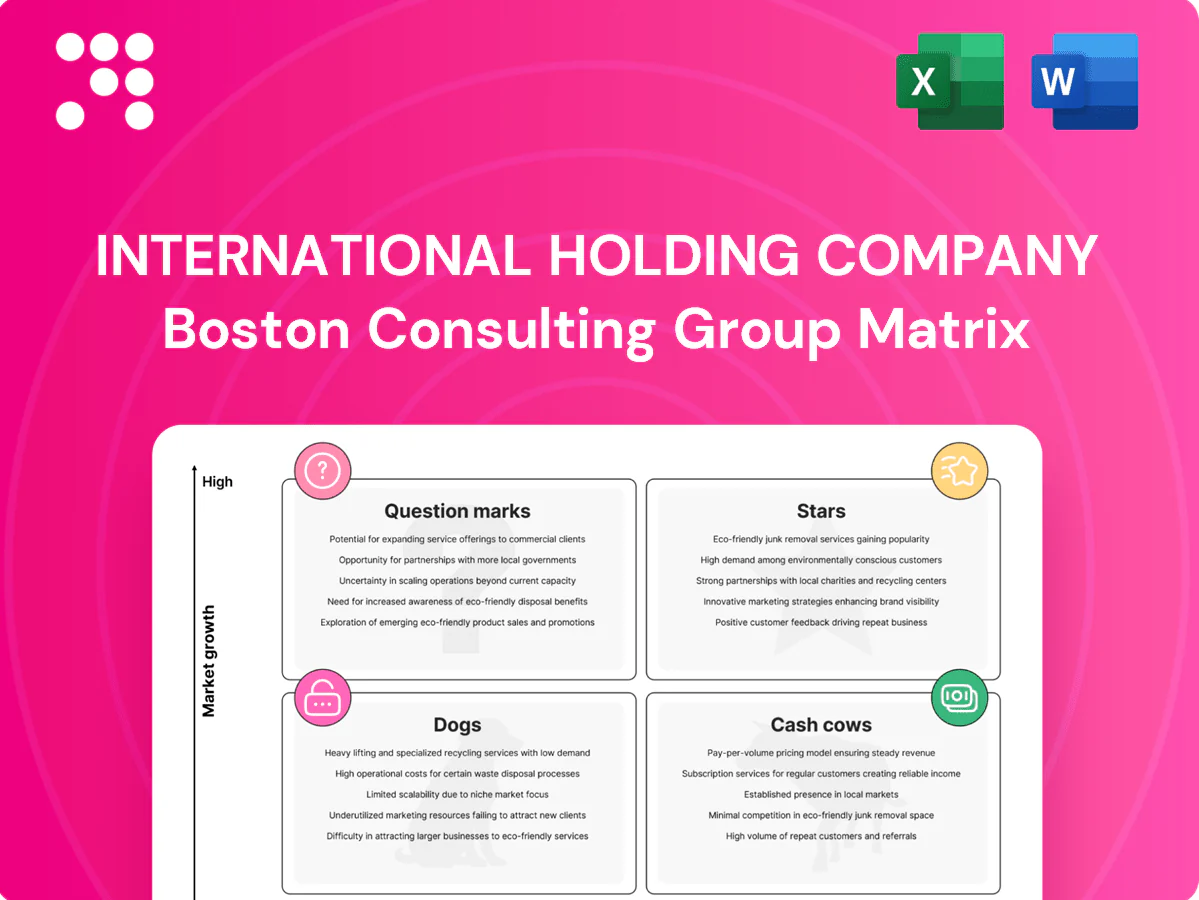
International Holding Company Boston Consulting Group Matrix

Download Your Competitive Advantage
Peek at the International Holding Company BCG Matrix to see which businesses are winning, which are cash machines, and which need a hard look. This preview scratches the surface—buy the full BCG Matrix for quadrant-by-quadrant placements, clear data-backed recommendations, and a strategic roadmap you can act on. Get the complete report in polished Word and Excel formats for instant use in presentations and planning. Purchase now to stop guessing and start reallocating capital with confidence.
Stars

UAE healthcare platforms
High growth demand and strong regional share place IHC’s UAE healthcare platforms squarely in the Star box: UAE population ~9.99 million in 2024 underpins rising care demand. They lead locally but need heavy spend on clinicians, digital tech, and new sites to scale capacity. Keep the promotional and placement flywheel running so these Stars can convert into high-margin cash cows.
Food security & agri-tech scale-ups
Food and agriculture are strategic in the UAE — the country imports about 85% of its food, giving IHC strong policy tailwinds as one of the UAE’s largest listed conglomerates. Market growth is high and scale advantages are forming, but capex and working-capital burn are real, so keep investing to cement share before competitors catch up. Sustain momentum and this lane can convert to a cash cow later.

Industrial services tied to megaprojects
GCC construction pipeline exceeded $2.3tn in 2024, and IHC-backed industrial services have captured an outsized share of megaproject packages across Saudi and UAE programs. The pipeline is deep, but sustained execution, specialized talent and heavy equipment require ongoing cash allocation. Prioritize operational excellence and tight project controls to lock in leadership. As regional growth normalizes, defend share and convert scale into dependable cash flow.

Regional F&B brands with distribution muscle
Regional F&B Stars leverage GCC consumption dynamics (GCC population ~57 million in 2024) and owned distribution to accelerate share gains; awareness and shelf wars demand sustained marketing and placement spend to defend momentum. Protect core SKUs, push new formats, and scale aggressively in KSA (population ~36.6 million in 2024) until growth normalizes.
- Distribution edge: faster market rollout
- Marketing: required to win shelf share
- SKU defense: protect margins
- KSA expansion: priority for scale
Tech-enabled healthcare diagnostics
Tech-enabled healthcare diagnostics are high-growth Stars as diagnostics volumes rose ~9% YoY in 2024, driven by preventive-care policies; early leadership and network effects (scale of labs/platform users) are decisive, but expanding labs and digital platforms requires capex and working capital. Double down on geographic coverage, payer contracts, and sub-24h turnaround times; if share holds, EBITDA margins can compound, expanding ~300 bps as growth eases.
- 2024 market growth ~9% YoY
- Focus: coverage, payer ties, <24h TAT
- Invest: labs + digital platforms
- Potential: +300 bps EBITDA as share stabilizes
UAE health & diagnostics: rapid growth but capex burn; food & F&B need sustained investment
IHC Stars: UAE healthcare (population 9.99m in 2024) and tech diagnostics (volumes +9% YoY in 2024) show high growth but heavy capex and working-capital burn; food & ag (UAE imports ~85% of food) and regional F&B (GCC pop ~57m; KSA 36.6m) need sustained investment to cement share before maturity.
| Sector | 2024 Metric | Implication |
|---|---|---|
| UAE Healthcare | Pop 9.99m; high demand | Scale via sites & clinicians |
| Diagnostics | Vol +9% YoY | Invest labs+digital |
| Food & Ag | Imports ~85% | Policy tailwinds, capex |
| Regional F&B | GCC pop 57m; KSA 36.6m | Marketing & distribution spend |
What is included in the product
 Detailed Word Document
Comprehensive BCG Matrix review of International Holding Company's units, with strategic recommendations for investment, retention, or divestment.

 Customizable Excel Spreadsheet
One-page BCG matrix placing each holding unit in a quadrant, simplifying portfolio decisions for C-levels.
Cash Cows

Income-generating real estate
Mature income-generating real estate in IHCs function as cash cows: high occupancy (around 92% in 2024) and locked-in leases spin steady cash, with NOI up roughly 4% year-over-year. Modest capex (typically low single-digit percent of asset value) and operational efficiencies compound returns. Use this cash to fund growth bets and service debt while optimizing ops and selectively recycling capital.
Established staple F&B lines
Established staple F&B lines hold entrenched shelf space and predictable daily demand, driving stable revenue and low churn. Pricing power plus scale purchasing supports healthy EBITDA margins typically in the mid-teens to mid-20s (15–25%) for staple categories in 2024. Low single-digit promo spend sustains velocity while allowing skim-through pricing. Milk the category and trim the SKU tail to concentrate margin-rich SKUs and cut complexity.

Facilities management & support services
Facilities management & support services sit on a large installed client base with recurring contracts often accounting for over 70% of revenues and reported churn below 10%, making cash flows highly predictable. Process improvements typically translate directly to cash flow, with efficiency gains boosting operating cash by double-digit percentages in benchmark studies. Maintain service quality, avoid price wars, and focus on upselling bundled services to protect margins. The global FM market was roughly USD 1.2 trillion in 2023.

Logistics and warehousing concessions
Logistics and warehousing concessions are mature cash cows—occupancy at c.95% in 2024 with WALT ~7 years provides strong revenue visibility. Moderate reinvestment (c.8% of NOI) sustains high utilization while yield optimization and automation target a 150–200 bps rent uplift. Annual cash throw-off ~US$140m funds the pipeline and selective redeployments.
- Occupancy: c.95%
- WALT: ~7 years
- Reinvestment: ~8% of NOI
- Target yield uplift: 150–200 bps
- Annual cash throw-off: ~US$140m
Utilities-adjacent industrials
Utilities-adjacent industrials exhibit stable demand and regulated or quasi-regulated dynamics, creating scale moats and predictable operations; typically low growth but high free cash generation, with 2024 sector free cash flow yield around 6–8% and dividend yields near 3–5%. Keep reliability high and costs low; ideal for dividends and internal funding.
- Stable demand
- Regulated/quasi-regulated
- Scale moats
- Low growth, high FCF (2024: ~6–8% yield)
- Dividend/internal funding fit
Cash cows: RE 92%, logistics 95%, US$140m
Cash cows: RE occ 92% (2024), NOI +4% YoY; logistics occ 95%, WALT 7y, cash throw-off US$140m; F&B EBITDA 15–25% (2024); utilities FCF yield 6–8%. Prioritize dividends, debt service and selective capital recycling.
| Asset | 2024 metric |
|---|---|
| Real estate | Occ 92% | NOI +4% |
| Logistics | Occ 95% | WALT 7y | US$140m |
| F&B | EBITDA 15–25% |
| Utilities | FCF yield 6–8% |
What You See Is What You Get
International Holding Company BCG Matrix
The file you're previewing here is the exact BCG Matrix report you'll receive after purchase—no watermarks, no placeholders, just the finalized, fully formatted document. It’s crafted for strategic clarity and market-led insight, ready to drop into your planning, pitch decks, or client meetings. Once bought, the full file is immediately downloadable and editable—no surprises, no extra edits needed. This is the real deliverable, straight from our analysts to your inbox.

Download Your Competitive Advantage
Peek at the International Holding Company BCG Matrix to see which businesses are winning, which are cash machines, and which need a hard look. This preview scratches the surface—buy the full BCG Matrix for quadrant-by-quadrant placements, clear data-backed recommendations, and a strategic roadmap you can act on. Get the complete report in polished Word and Excel formats for instant use in presentations and planning. Purchase now to stop guessing and start reallocating capital with confidence.
Stars
UAE healthcare platforms
High growth demand and strong regional share place IHC’s UAE healthcare platforms squarely in the Star box: UAE population ~9.99 million in 2024 underpins rising care demand. They lead locally but need heavy spend on clinicians, digital tech, and new sites to scale capacity. Keep the promotional and placement flywheel running so these Stars can convert into high-margin cash cows.
Food security & agri-tech scale-ups
Food and agriculture are strategic in the UAE — the country imports about 85% of its food, giving IHC strong policy tailwinds as one of the UAE’s largest listed conglomerates. Market growth is high and scale advantages are forming, but capex and working-capital burn are real, so keep investing to cement share before competitors catch up. Sustain momentum and this lane can convert to a cash cow later.
Industrial services tied to megaprojects
GCC construction pipeline exceeded $2.3tn in 2024, and IHC-backed industrial services have captured an outsized share of megaproject packages across Saudi and UAE programs. The pipeline is deep, but sustained execution, specialized talent and heavy equipment require ongoing cash allocation. Prioritize operational excellence and tight project controls to lock in leadership. As regional growth normalizes, defend share and convert scale into dependable cash flow.
Regional F&B brands with distribution muscle
Regional F&B Stars leverage GCC consumption dynamics (GCC population ~57 million in 2024) and owned distribution to accelerate share gains; awareness and shelf wars demand sustained marketing and placement spend to defend momentum. Protect core SKUs, push new formats, and scale aggressively in KSA (population ~36.6 million in 2024) until growth normalizes.
- Distribution edge: faster market rollout
- Marketing: required to win shelf share
- SKU defense: protect margins
- KSA expansion: priority for scale
Tech-enabled healthcare diagnostics
Tech-enabled healthcare diagnostics are high-growth Stars as diagnostics volumes rose ~9% YoY in 2024, driven by preventive-care policies; early leadership and network effects (scale of labs/platform users) are decisive, but expanding labs and digital platforms requires capex and working capital. Double down on geographic coverage, payer contracts, and sub-24h turnaround times; if share holds, EBITDA margins can compound, expanding ~300 bps as growth eases.
- 2024 market growth ~9% YoY
- Focus: coverage, payer ties, <24h TAT
- Invest: labs + digital platforms
- Potential: +300 bps EBITDA as share stabilizes
UAE health & diagnostics: rapid growth but capex burn; food & F&B need sustained investment
IHC Stars: UAE healthcare (population 9.99m in 2024) and tech diagnostics (volumes +9% YoY in 2024) show high growth but heavy capex and working-capital burn; food & ag (UAE imports ~85% of food) and regional F&B (GCC pop ~57m; KSA 36.6m) need sustained investment to cement share before maturity.
| Sector | 2024 Metric | Implication |
|---|---|---|
| UAE Healthcare | Pop 9.99m; high demand | Scale via sites & clinicians |
| Diagnostics | Vol +9% YoY | Invest labs+digital |
| Food & Ag | Imports ~85% | Policy tailwinds, capex |
| Regional F&B | GCC pop 57m; KSA 36.6m | Marketing & distribution spend |
What is included in the product
Detailed Word Document
Comprehensive BCG Matrix review of International Holding Company's units, with strategic recommendations for investment, retention, or divestment.
Customizable Excel Spreadsheet
One-page BCG matrix placing each holding unit in a quadrant, simplifying portfolio decisions for C-levels.
Cash Cows
Income-generating real estate
Mature income-generating real estate in IHCs function as cash cows: high occupancy (around 92% in 2024) and locked-in leases spin steady cash, with NOI up roughly 4% year-over-year. Modest capex (typically low single-digit percent of asset value) and operational efficiencies compound returns. Use this cash to fund growth bets and service debt while optimizing ops and selectively recycling capital.
Established staple F&B lines
Established staple F&B lines hold entrenched shelf space and predictable daily demand, driving stable revenue and low churn. Pricing power plus scale purchasing supports healthy EBITDA margins typically in the mid-teens to mid-20s (15–25%) for staple categories in 2024. Low single-digit promo spend sustains velocity while allowing skim-through pricing. Milk the category and trim the SKU tail to concentrate margin-rich SKUs and cut complexity.
Facilities management & support services
Facilities management & support services sit on a large installed client base with recurring contracts often accounting for over 70% of revenues and reported churn below 10%, making cash flows highly predictable. Process improvements typically translate directly to cash flow, with efficiency gains boosting operating cash by double-digit percentages in benchmark studies. Maintain service quality, avoid price wars, and focus on upselling bundled services to protect margins. The global FM market was roughly USD 1.2 trillion in 2023.
Logistics and warehousing concessions
Logistics and warehousing concessions are mature cash cows—occupancy at c.95% in 2024 with WALT ~7 years provides strong revenue visibility. Moderate reinvestment (c.8% of NOI) sustains high utilization while yield optimization and automation target a 150–200 bps rent uplift. Annual cash throw-off ~US$140m funds the pipeline and selective redeployments.
- Occupancy: c.95%
- WALT: ~7 years
- Reinvestment: ~8% of NOI
- Target yield uplift: 150–200 bps
- Annual cash throw-off: ~US$140m
Utilities-adjacent industrials
Utilities-adjacent industrials exhibit stable demand and regulated or quasi-regulated dynamics, creating scale moats and predictable operations; typically low growth but high free cash generation, with 2024 sector free cash flow yield around 6–8% and dividend yields near 3–5%. Keep reliability high and costs low; ideal for dividends and internal funding.
- Stable demand
- Regulated/quasi-regulated
- Scale moats
- Low growth, high FCF (2024: ~6–8% yield)
- Dividend/internal funding fit
Cash cows: RE 92%, logistics 95%, US$140m
Cash cows: RE occ 92% (2024), NOI +4% YoY; logistics occ 95%, WALT 7y, cash throw-off US$140m; F&B EBITDA 15–25% (2024); utilities FCF yield 6–8%. Prioritize dividends, debt service and selective capital recycling.
| Asset | 2024 metric |
|---|---|
| Real estate | Occ 92% | NOI +4% |
| Logistics | Occ 95% | WALT 7y | US$140m |
| F&B | EBITDA 15–25% |
| Utilities | FCF yield 6–8% |
What You See Is What You Get
International Holding Company BCG Matrix
The file you're previewing here is the exact BCG Matrix report you'll receive after purchase—no watermarks, no placeholders, just the finalized, fully formatted document. It’s crafted for strategic clarity and market-led insight, ready to drop into your planning, pitch decks, or client meetings. Once bought, the full file is immediately downloadable and editable—no surprises, no extra edits needed. This is the real deliverable, straight from our analysts to your inbox.
Original: $10.00
-65%$10.00
$3.50Description
Download Your Competitive Advantage
Peek at the International Holding Company BCG Matrix to see which businesses are winning, which are cash machines, and which need a hard look. This preview scratches the surface—buy the full BCG Matrix for quadrant-by-quadrant placements, clear data-backed recommendations, and a strategic roadmap you can act on. Get the complete report in polished Word and Excel formats for instant use in presentations and planning. Purchase now to stop guessing and start reallocating capital with confidence.
Stars
UAE healthcare platforms
High growth demand and strong regional share place IHC’s UAE healthcare platforms squarely in the Star box: UAE population ~9.99 million in 2024 underpins rising care demand. They lead locally but need heavy spend on clinicians, digital tech, and new sites to scale capacity. Keep the promotional and placement flywheel running so these Stars can convert into high-margin cash cows.
Food security & agri-tech scale-ups
Food and agriculture are strategic in the UAE — the country imports about 85% of its food, giving IHC strong policy tailwinds as one of the UAE’s largest listed conglomerates. Market growth is high and scale advantages are forming, but capex and working-capital burn are real, so keep investing to cement share before competitors catch up. Sustain momentum and this lane can convert to a cash cow later.
Industrial services tied to megaprojects
GCC construction pipeline exceeded $2.3tn in 2024, and IHC-backed industrial services have captured an outsized share of megaproject packages across Saudi and UAE programs. The pipeline is deep, but sustained execution, specialized talent and heavy equipment require ongoing cash allocation. Prioritize operational excellence and tight project controls to lock in leadership. As regional growth normalizes, defend share and convert scale into dependable cash flow.
Regional F&B brands with distribution muscle
Regional F&B Stars leverage GCC consumption dynamics (GCC population ~57 million in 2024) and owned distribution to accelerate share gains; awareness and shelf wars demand sustained marketing and placement spend to defend momentum. Protect core SKUs, push new formats, and scale aggressively in KSA (population ~36.6 million in 2024) until growth normalizes.
- Distribution edge: faster market rollout
- Marketing: required to win shelf share
- SKU defense: protect margins
- KSA expansion: priority for scale
Tech-enabled healthcare diagnostics
Tech-enabled healthcare diagnostics are high-growth Stars as diagnostics volumes rose ~9% YoY in 2024, driven by preventive-care policies; early leadership and network effects (scale of labs/platform users) are decisive, but expanding labs and digital platforms requires capex and working capital. Double down on geographic coverage, payer contracts, and sub-24h turnaround times; if share holds, EBITDA margins can compound, expanding ~300 bps as growth eases.
- 2024 market growth ~9% YoY
- Focus: coverage, payer ties, <24h TAT
- Invest: labs + digital platforms
- Potential: +300 bps EBITDA as share stabilizes
UAE health & diagnostics: rapid growth but capex burn; food & F&B need sustained investment
IHC Stars: UAE healthcare (population 9.99m in 2024) and tech diagnostics (volumes +9% YoY in 2024) show high growth but heavy capex and working-capital burn; food & ag (UAE imports ~85% of food) and regional F&B (GCC pop ~57m; KSA 36.6m) need sustained investment to cement share before maturity.
| Sector | 2024 Metric | Implication |
|---|---|---|
| UAE Healthcare | Pop 9.99m; high demand | Scale via sites & clinicians |
| Diagnostics | Vol +9% YoY | Invest labs+digital |
| Food & Ag | Imports ~85% | Policy tailwinds, capex |
| Regional F&B | GCC pop 57m; KSA 36.6m | Marketing & distribution spend |
What is included in the product
Detailed Word Document
Comprehensive BCG Matrix review of International Holding Company's units, with strategic recommendations for investment, retention, or divestment.
Customizable Excel Spreadsheet
One-page BCG matrix placing each holding unit in a quadrant, simplifying portfolio decisions for C-levels.
Cash Cows
Income-generating real estate
Mature income-generating real estate in IHCs function as cash cows: high occupancy (around 92% in 2024) and locked-in leases spin steady cash, with NOI up roughly 4% year-over-year. Modest capex (typically low single-digit percent of asset value) and operational efficiencies compound returns. Use this cash to fund growth bets and service debt while optimizing ops and selectively recycling capital.
Established staple F&B lines
Established staple F&B lines hold entrenched shelf space and predictable daily demand, driving stable revenue and low churn. Pricing power plus scale purchasing supports healthy EBITDA margins typically in the mid-teens to mid-20s (15–25%) for staple categories in 2024. Low single-digit promo spend sustains velocity while allowing skim-through pricing. Milk the category and trim the SKU tail to concentrate margin-rich SKUs and cut complexity.
Facilities management & support services
Facilities management & support services sit on a large installed client base with recurring contracts often accounting for over 70% of revenues and reported churn below 10%, making cash flows highly predictable. Process improvements typically translate directly to cash flow, with efficiency gains boosting operating cash by double-digit percentages in benchmark studies. Maintain service quality, avoid price wars, and focus on upselling bundled services to protect margins. The global FM market was roughly USD 1.2 trillion in 2023.
Logistics and warehousing concessions
Logistics and warehousing concessions are mature cash cows—occupancy at c.95% in 2024 with WALT ~7 years provides strong revenue visibility. Moderate reinvestment (c.8% of NOI) sustains high utilization while yield optimization and automation target a 150–200 bps rent uplift. Annual cash throw-off ~US$140m funds the pipeline and selective redeployments.
- Occupancy: c.95%
- WALT: ~7 years
- Reinvestment: ~8% of NOI
- Target yield uplift: 150–200 bps
- Annual cash throw-off: ~US$140m
Utilities-adjacent industrials
Utilities-adjacent industrials exhibit stable demand and regulated or quasi-regulated dynamics, creating scale moats and predictable operations; typically low growth but high free cash generation, with 2024 sector free cash flow yield around 6–8% and dividend yields near 3–5%. Keep reliability high and costs low; ideal for dividends and internal funding.
- Stable demand
- Regulated/quasi-regulated
- Scale moats
- Low growth, high FCF (2024: ~6–8% yield)
- Dividend/internal funding fit
Cash cows: RE 92%, logistics 95%, US$140m
Cash cows: RE occ 92% (2024), NOI +4% YoY; logistics occ 95%, WALT 7y, cash throw-off US$140m; F&B EBITDA 15–25% (2024); utilities FCF yield 6–8%. Prioritize dividends, debt service and selective capital recycling.
| Asset | 2024 metric |
|---|---|
| Real estate | Occ 92% | NOI +4% |
| Logistics | Occ 95% | WALT 7y | US$140m |
| F&B | EBITDA 15–25% |
| Utilities | FCF yield 6–8% |
What You See Is What You Get
International Holding Company BCG Matrix
The file you're previewing here is the exact BCG Matrix report you'll receive after purchase—no watermarks, no placeholders, just the finalized, fully formatted document. It’s crafted for strategic clarity and market-led insight, ready to drop into your planning, pitch decks, or client meetings. Once bought, the full file is immediately downloadable and editable—no surprises, no extra edits needed. This is the real deliverable, straight from our analysts to your inbox.











