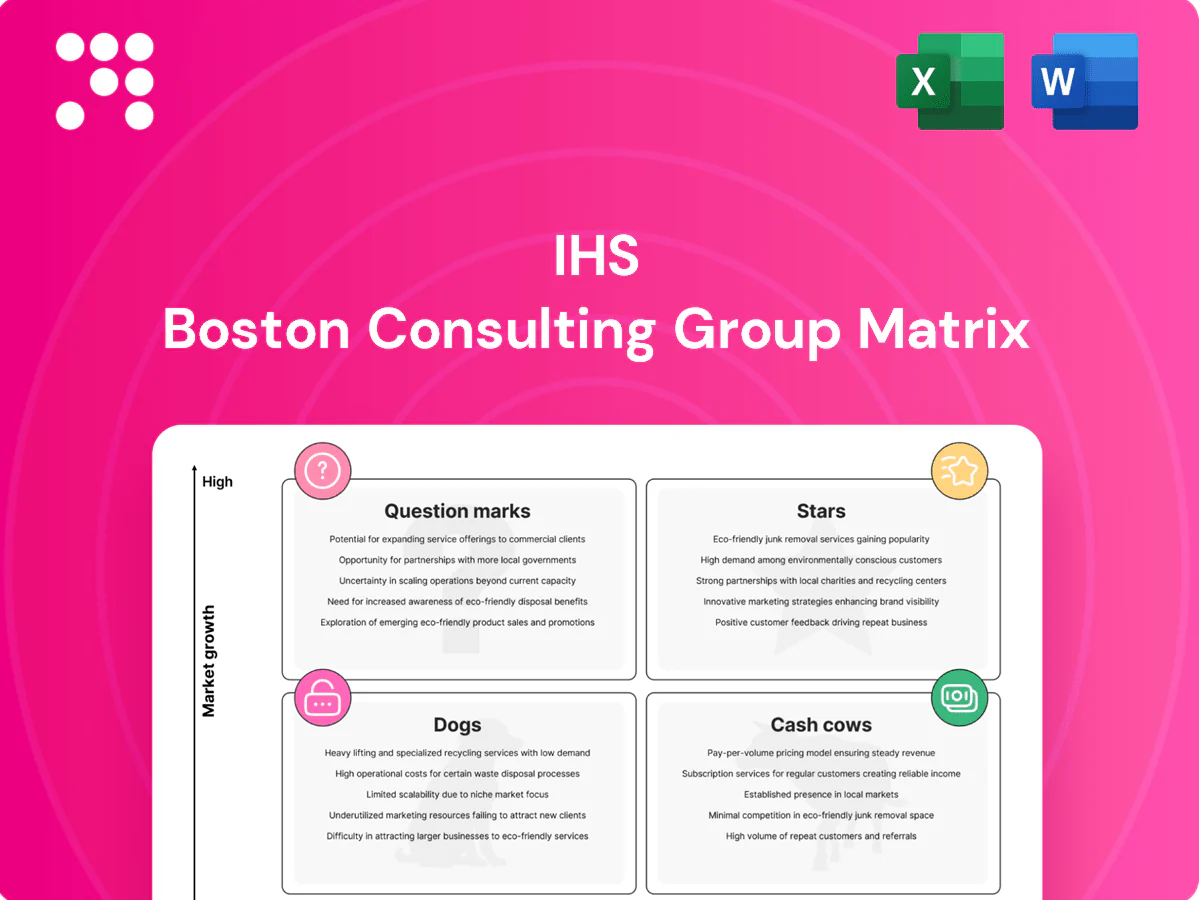
IHS Boston Consulting Group Matrix

See the Bigger Picture
Get a quick read on this company’s BCG Matrix and see which products are Stars, Cash Cows, Dogs, or Question Marks—this preview just scratches the surface. Buy the full BCG Matrix for quadrant-by-quadrant placements, data-backed recommendations, and clear next steps you can act on now. You’ll get a detailed Word report plus a high-level Excel summary—ready to present to your board or use for investment decisions. Purchase now for a practical, time-saving strategic tool that cuts through the noise.
Stars

High-growth SSA tower co-location
IHS’s core tower leasing in fast‑growing Sub‑Saharan markets is scaling hard with 4G densification and early 5G, its portfolio reaching about 20,000 sites in 2024 and multi‑tenant ratio near 1.3 tenants/site; demand is outpacing supply and multi‑tenant adds sustain EBITDA margins despite high capex (~$8–12k per greenfield site). Keep fueling build‑to‑suit and selective acquisitions to defend share; if momentum holds as growth moderates, this can migrate into Cash Cow territory.
Urban multi-tenant anchor clusters
City clusters hosting multiple blue‑chip MNO tenants delivered 20–30% higher site utilization and roughly 10–15% lower tenant churn in 2024 industry surveys, driving stable cash flows. High‑traffic zones support premium rents with steady 5–8% annual escalators and justify capital allocation to prime locations. Commercial pitch focuses on tighter SLAs (99.99% target) and <30‑day speed‑to‑onboard; protecting permits and 99.95% power uptime locks leadership.

Power-as-a-service for co-located sites
Reliable energy at tower sites is a must-have and a differentiator in growth markets; a typical co‑located site draws 1–5 kW and in 2024 energy represented roughly 30–50% of tower opex. Bundling power with lease contracts increases stickiness and uplifts per‑site revenue while lowering churn. It consumes working capital but secures market share where grids are shaky; scale hybrid (solar+storage+gen) solutions to cap opex and defend leadership.

Build-to-suit programs with anchor tenants
Build-to-suit programs with anchor tenants use pre-committed builds by top operators to de-risk deployments and speed coverage expansion; in 2024 operators increasingly favored such deals to accelerate rollouts. Clear pipeline visibility keeps crews continuously occupied and capex more efficient, setting the pace of market expansion and crowding out smaller rivals. Maintain priority access to spectrum roadmaps to stay one step ahead.
- Pre-committed builds: de-risking
- Pipeline visibility: capex efficiency
- Market pace: crowding out rivals
- Spectrum roadmap access: strategic edge
Strategic government and enterprise sites
Strategic government and enterprise sites form defensible nodes with long tenures thanks to high-profile coverage obligations and protected enterprise corridors; many contracts include enhanced compliance and right-of-way protections, and deployments in 2024 grew ~18% year-over-year as digital policies accelerated connectivity.
- Long-tenure nodes
- Stronger compliance/ROW
- 2024 deployments +18% YoY
- Recommend continued capex to secure preferred-partner status
Tower demand: ~20,000 sites, utilization +20-30% drives rents +5-8% p.a.
IHS Stars: ~20,000 sites in 2024 with multi‑tenant ratio ~1.3; rapid 4G/early 5G demand drives high utilization (+20–30%) and lower churn (‑10–15%), supporting premium rents (5–8% escalators). High capex (~$8–12k/greenfield) and energy (30–50% of opex) weigh on margins but multi‑tenant adds and build‑to‑suit pipeline (deployments +18% YoY) sustain EBITDA growth.
| Metric | 2024 Value |
|---|---|
| Sites | ~20,000 |
| Multi‑tenant | 1.3 tenants/site |
| Capex per greenfield | $8–12k |
| Energy share of opex | 30–50% |
| Utilization uplift | +20–30% |
| Deployments YoY | +18% |
| Rent escalator | 5–8% p.a. |
What is included in the product
 Detailed Word Document
Concise IHS BCG Matrix overview: evaluates Stars, Cash Cows, Question Marks, Dogs to guide invest, hold or divest decisions.

 Customizable Excel Spreadsheet
One-page IHS BCG Matrix that quickly highlights portfolio pain points and priorities for fast executive decisions
Cash Cows

Mature macro towers with high tenancy
Mature macro towers in stable corridors now yield predictable cash with minimal growth capex, typically showing tenancy rates around 90–95% and steady FCF generation. Lease-up is complete; operational focus is uptime and timely renewals to preserve revenue. Indexation and annual escalators of roughly 2–4% (CPI-linked in many markets) sustain cashflows. Remote monitoring and lean field ops cut truck rolls up to 30%, protecting EBITDA (towerco ranges ~55–65% in 2024).
Long-term MLAs with top MNOs
Long-term MLAs with top MNOs (typically 3–5 year terms) lock in volumes and simplify pricing mechanics, with framework agreements enabling predictable revenue streams; enterprise churn under such contracts is generally low (often below 5% annually) and collections are reliable. Spreading admin costs over large bases can boost margins by several hundred basis points. Maintain service quality and avoid over-investing beyond contractual SLAs to protect returns.

Rooftop portfolios in dense zones
Rooftop portfolios in mature urban markets deliver steady tenancy with minimal build costs because sites are acquired and fit-outs are low; commercial rooftop O&M typically runs about 1–2% of capex annually (industry 2024 benchmark). Incremental tenants flow nearly straight to EBITDA, often boosting portfolio margins while optimizing structural load and keeping municipal permitting and lease records current reduces operational friction.

Passive infrastructure maintenance services
Standardized O&M on stabilized sites is repeatable and efficient, driving predictable schedules, fewer surprises and 2024 O&M margins of roughly 15–25%. Small tech upgrades in 2024 pilots cut truck rolls up to 50% and diesel use about 30%. Invest just enough to protect reliability and capture SLA bonuses typically worth 1–3% of contract value in 2024.
- Repeatability → 15–25% margins (2024)
- Truck rolls − up to 50% (2024 pilots)
- Diesel − ~30% savings (2024)
- SLA bonuses 1–3% of revenue (2024)
Co-location renewals and lease escalations
Co-location renewals and lease escalations are steady cash cows: annual escalators in the sector run around 2–3% (or CPI+1) and 2024 industry renewal rates exceeded 90%, producing low-risk, recurring cash since the asset is in the ground and paperwork drives revenue. Reliable metering and usage data justify fair increases; retention and clean billing sustain the flywheel.
- Annual escalators: 2–3% / CPI+1
- 2024 renewal rates: >90%
- Driver: metered usage data
- Focus: retention + accurate billing
Mature sites: tenancy 90–95%, EBITDA 55–65%, MLAs 3–5yr
Mature sites yield predictable free cash with tenancy 90–95%, annual escalators 2–4% and renewal rates >90%, driving 2024 towerco EBITDA ~55–65% while O&M margins run 15–25%. Long MLAs (3–5yr) cut churn <5% and capex is minimal; incremental tenants flow nearly straight to EBITDA.
| Metric | 2024 Value |
|---|---|
| Tenancy | 90–95% |
| EBITDA (towerco) | 55–65% |
| O&M margin | 15–25% |
| Escalators | 2–4% |
| Renewal rate | >90% |
Delivered as Shown
IHS BCG Matrix
The file you're previewing here is the exact BCG Matrix document you'll receive after purchase. No watermarks, no demo text—just the fully formatted, analysis-ready report built for clarity. After buying, the same file is sent straight to your inbox and is immediately editable, printable, and presentable. No surprises—just plug-and-play strategy material from day one.

See the Bigger Picture
Get a quick read on this company’s BCG Matrix and see which products are Stars, Cash Cows, Dogs, or Question Marks—this preview just scratches the surface. Buy the full BCG Matrix for quadrant-by-quadrant placements, data-backed recommendations, and clear next steps you can act on now. You’ll get a detailed Word report plus a high-level Excel summary—ready to present to your board or use for investment decisions. Purchase now for a practical, time-saving strategic tool that cuts through the noise.
Stars
High-growth SSA tower co-location
IHS’s core tower leasing in fast‑growing Sub‑Saharan markets is scaling hard with 4G densification and early 5G, its portfolio reaching about 20,000 sites in 2024 and multi‑tenant ratio near 1.3 tenants/site; demand is outpacing supply and multi‑tenant adds sustain EBITDA margins despite high capex (~$8–12k per greenfield site). Keep fueling build‑to‑suit and selective acquisitions to defend share; if momentum holds as growth moderates, this can migrate into Cash Cow territory.
Urban multi-tenant anchor clusters
City clusters hosting multiple blue‑chip MNO tenants delivered 20–30% higher site utilization and roughly 10–15% lower tenant churn in 2024 industry surveys, driving stable cash flows. High‑traffic zones support premium rents with steady 5–8% annual escalators and justify capital allocation to prime locations. Commercial pitch focuses on tighter SLAs (99.99% target) and <30‑day speed‑to‑onboard; protecting permits and 99.95% power uptime locks leadership.
Power-as-a-service for co-located sites
Reliable energy at tower sites is a must-have and a differentiator in growth markets; a typical co‑located site draws 1–5 kW and in 2024 energy represented roughly 30–50% of tower opex. Bundling power with lease contracts increases stickiness and uplifts per‑site revenue while lowering churn. It consumes working capital but secures market share where grids are shaky; scale hybrid (solar+storage+gen) solutions to cap opex and defend leadership.
Build-to-suit programs with anchor tenants
Build-to-suit programs with anchor tenants use pre-committed builds by top operators to de-risk deployments and speed coverage expansion; in 2024 operators increasingly favored such deals to accelerate rollouts. Clear pipeline visibility keeps crews continuously occupied and capex more efficient, setting the pace of market expansion and crowding out smaller rivals. Maintain priority access to spectrum roadmaps to stay one step ahead.
- Pre-committed builds: de-risking
- Pipeline visibility: capex efficiency
- Market pace: crowding out rivals
- Spectrum roadmap access: strategic edge
Strategic government and enterprise sites
Strategic government and enterprise sites form defensible nodes with long tenures thanks to high-profile coverage obligations and protected enterprise corridors; many contracts include enhanced compliance and right-of-way protections, and deployments in 2024 grew ~18% year-over-year as digital policies accelerated connectivity.
- Long-tenure nodes
- Stronger compliance/ROW
- 2024 deployments +18% YoY
- Recommend continued capex to secure preferred-partner status
Tower demand: ~20,000 sites, utilization +20-30% drives rents +5-8% p.a.
IHS Stars: ~20,000 sites in 2024 with multi‑tenant ratio ~1.3; rapid 4G/early 5G demand drives high utilization (+20–30%) and lower churn (‑10–15%), supporting premium rents (5–8% escalators). High capex (~$8–12k/greenfield) and energy (30–50% of opex) weigh on margins but multi‑tenant adds and build‑to‑suit pipeline (deployments +18% YoY) sustain EBITDA growth.
| Metric | 2024 Value |
|---|---|
| Sites | ~20,000 |
| Multi‑tenant | 1.3 tenants/site |
| Capex per greenfield | $8–12k |
| Energy share of opex | 30–50% |
| Utilization uplift | +20–30% |
| Deployments YoY | +18% |
| Rent escalator | 5–8% p.a. |
What is included in the product
Detailed Word Document
Concise IHS BCG Matrix overview: evaluates Stars, Cash Cows, Question Marks, Dogs to guide invest, hold or divest decisions.
Customizable Excel Spreadsheet
One-page IHS BCG Matrix that quickly highlights portfolio pain points and priorities for fast executive decisions
Cash Cows
Mature macro towers with high tenancy
Mature macro towers in stable corridors now yield predictable cash with minimal growth capex, typically showing tenancy rates around 90–95% and steady FCF generation. Lease-up is complete; operational focus is uptime and timely renewals to preserve revenue. Indexation and annual escalators of roughly 2–4% (CPI-linked in many markets) sustain cashflows. Remote monitoring and lean field ops cut truck rolls up to 30%, protecting EBITDA (towerco ranges ~55–65% in 2024).
Long-term MLAs with top MNOs
Long-term MLAs with top MNOs (typically 3–5 year terms) lock in volumes and simplify pricing mechanics, with framework agreements enabling predictable revenue streams; enterprise churn under such contracts is generally low (often below 5% annually) and collections are reliable. Spreading admin costs over large bases can boost margins by several hundred basis points. Maintain service quality and avoid over-investing beyond contractual SLAs to protect returns.
Rooftop portfolios in dense zones
Rooftop portfolios in mature urban markets deliver steady tenancy with minimal build costs because sites are acquired and fit-outs are low; commercial rooftop O&M typically runs about 1–2% of capex annually (industry 2024 benchmark). Incremental tenants flow nearly straight to EBITDA, often boosting portfolio margins while optimizing structural load and keeping municipal permitting and lease records current reduces operational friction.
Passive infrastructure maintenance services
Standardized O&M on stabilized sites is repeatable and efficient, driving predictable schedules, fewer surprises and 2024 O&M margins of roughly 15–25%. Small tech upgrades in 2024 pilots cut truck rolls up to 50% and diesel use about 30%. Invest just enough to protect reliability and capture SLA bonuses typically worth 1–3% of contract value in 2024.
- Repeatability → 15–25% margins (2024)
- Truck rolls − up to 50% (2024 pilots)
- Diesel − ~30% savings (2024)
- SLA bonuses 1–3% of revenue (2024)
Co-location renewals and lease escalations
Co-location renewals and lease escalations are steady cash cows: annual escalators in the sector run around 2–3% (or CPI+1) and 2024 industry renewal rates exceeded 90%, producing low-risk, recurring cash since the asset is in the ground and paperwork drives revenue. Reliable metering and usage data justify fair increases; retention and clean billing sustain the flywheel.
- Annual escalators: 2–3% / CPI+1
- 2024 renewal rates: >90%
- Driver: metered usage data
- Focus: retention + accurate billing
Mature sites: tenancy 90–95%, EBITDA 55–65%, MLAs 3–5yr
Mature sites yield predictable free cash with tenancy 90–95%, annual escalators 2–4% and renewal rates >90%, driving 2024 towerco EBITDA ~55–65% while O&M margins run 15–25%. Long MLAs (3–5yr) cut churn <5% and capex is minimal; incremental tenants flow nearly straight to EBITDA.
| Metric | 2024 Value |
|---|---|
| Tenancy | 90–95% |
| EBITDA (towerco) | 55–65% |
| O&M margin | 15–25% |
| Escalators | 2–4% |
| Renewal rate | >90% |
Delivered as Shown
IHS BCG Matrix
The file you're previewing here is the exact BCG Matrix document you'll receive after purchase. No watermarks, no demo text—just the fully formatted, analysis-ready report built for clarity. After buying, the same file is sent straight to your inbox and is immediately editable, printable, and presentable. No surprises—just plug-and-play strategy material from day one.
Description
See the Bigger Picture
Get a quick read on this company’s BCG Matrix and see which products are Stars, Cash Cows, Dogs, or Question Marks—this preview just scratches the surface. Buy the full BCG Matrix for quadrant-by-quadrant placements, data-backed recommendations, and clear next steps you can act on now. You’ll get a detailed Word report plus a high-level Excel summary—ready to present to your board or use for investment decisions. Purchase now for a practical, time-saving strategic tool that cuts through the noise.
Stars
High-growth SSA tower co-location
IHS’s core tower leasing in fast‑growing Sub‑Saharan markets is scaling hard with 4G densification and early 5G, its portfolio reaching about 20,000 sites in 2024 and multi‑tenant ratio near 1.3 tenants/site; demand is outpacing supply and multi‑tenant adds sustain EBITDA margins despite high capex (~$8–12k per greenfield site). Keep fueling build‑to‑suit and selective acquisitions to defend share; if momentum holds as growth moderates, this can migrate into Cash Cow territory.
Urban multi-tenant anchor clusters
City clusters hosting multiple blue‑chip MNO tenants delivered 20–30% higher site utilization and roughly 10–15% lower tenant churn in 2024 industry surveys, driving stable cash flows. High‑traffic zones support premium rents with steady 5–8% annual escalators and justify capital allocation to prime locations. Commercial pitch focuses on tighter SLAs (99.99% target) and <30‑day speed‑to‑onboard; protecting permits and 99.95% power uptime locks leadership.
Power-as-a-service for co-located sites
Reliable energy at tower sites is a must-have and a differentiator in growth markets; a typical co‑located site draws 1–5 kW and in 2024 energy represented roughly 30–50% of tower opex. Bundling power with lease contracts increases stickiness and uplifts per‑site revenue while lowering churn. It consumes working capital but secures market share where grids are shaky; scale hybrid (solar+storage+gen) solutions to cap opex and defend leadership.
Build-to-suit programs with anchor tenants
Build-to-suit programs with anchor tenants use pre-committed builds by top operators to de-risk deployments and speed coverage expansion; in 2024 operators increasingly favored such deals to accelerate rollouts. Clear pipeline visibility keeps crews continuously occupied and capex more efficient, setting the pace of market expansion and crowding out smaller rivals. Maintain priority access to spectrum roadmaps to stay one step ahead.
- Pre-committed builds: de-risking
- Pipeline visibility: capex efficiency
- Market pace: crowding out rivals
- Spectrum roadmap access: strategic edge
Strategic government and enterprise sites
Strategic government and enterprise sites form defensible nodes with long tenures thanks to high-profile coverage obligations and protected enterprise corridors; many contracts include enhanced compliance and right-of-way protections, and deployments in 2024 grew ~18% year-over-year as digital policies accelerated connectivity.
- Long-tenure nodes
- Stronger compliance/ROW
- 2024 deployments +18% YoY
- Recommend continued capex to secure preferred-partner status
Tower demand: ~20,000 sites, utilization +20-30% drives rents +5-8% p.a.
IHS Stars: ~20,000 sites in 2024 with multi‑tenant ratio ~1.3; rapid 4G/early 5G demand drives high utilization (+20–30%) and lower churn (‑10–15%), supporting premium rents (5–8% escalators). High capex (~$8–12k/greenfield) and energy (30–50% of opex) weigh on margins but multi‑tenant adds and build‑to‑suit pipeline (deployments +18% YoY) sustain EBITDA growth.
| Metric | 2024 Value |
|---|---|
| Sites | ~20,000 |
| Multi‑tenant | 1.3 tenants/site |
| Capex per greenfield | $8–12k |
| Energy share of opex | 30–50% |
| Utilization uplift | +20–30% |
| Deployments YoY | +18% |
| Rent escalator | 5–8% p.a. |
What is included in the product
Detailed Word Document
Concise IHS BCG Matrix overview: evaluates Stars, Cash Cows, Question Marks, Dogs to guide invest, hold or divest decisions.
Customizable Excel Spreadsheet
One-page IHS BCG Matrix that quickly highlights portfolio pain points and priorities for fast executive decisions
Cash Cows
Mature macro towers with high tenancy
Mature macro towers in stable corridors now yield predictable cash with minimal growth capex, typically showing tenancy rates around 90–95% and steady FCF generation. Lease-up is complete; operational focus is uptime and timely renewals to preserve revenue. Indexation and annual escalators of roughly 2–4% (CPI-linked in many markets) sustain cashflows. Remote monitoring and lean field ops cut truck rolls up to 30%, protecting EBITDA (towerco ranges ~55–65% in 2024).
Long-term MLAs with top MNOs
Long-term MLAs with top MNOs (typically 3–5 year terms) lock in volumes and simplify pricing mechanics, with framework agreements enabling predictable revenue streams; enterprise churn under such contracts is generally low (often below 5% annually) and collections are reliable. Spreading admin costs over large bases can boost margins by several hundred basis points. Maintain service quality and avoid over-investing beyond contractual SLAs to protect returns.
Rooftop portfolios in dense zones
Rooftop portfolios in mature urban markets deliver steady tenancy with minimal build costs because sites are acquired and fit-outs are low; commercial rooftop O&M typically runs about 1–2% of capex annually (industry 2024 benchmark). Incremental tenants flow nearly straight to EBITDA, often boosting portfolio margins while optimizing structural load and keeping municipal permitting and lease records current reduces operational friction.
Passive infrastructure maintenance services
Standardized O&M on stabilized sites is repeatable and efficient, driving predictable schedules, fewer surprises and 2024 O&M margins of roughly 15–25%. Small tech upgrades in 2024 pilots cut truck rolls up to 50% and diesel use about 30%. Invest just enough to protect reliability and capture SLA bonuses typically worth 1–3% of contract value in 2024.
- Repeatability → 15–25% margins (2024)
- Truck rolls − up to 50% (2024 pilots)
- Diesel − ~30% savings (2024)
- SLA bonuses 1–3% of revenue (2024)
Co-location renewals and lease escalations
Co-location renewals and lease escalations are steady cash cows: annual escalators in the sector run around 2–3% (or CPI+1) and 2024 industry renewal rates exceeded 90%, producing low-risk, recurring cash since the asset is in the ground and paperwork drives revenue. Reliable metering and usage data justify fair increases; retention and clean billing sustain the flywheel.
- Annual escalators: 2–3% / CPI+1
- 2024 renewal rates: >90%
- Driver: metered usage data
- Focus: retention + accurate billing
Mature sites: tenancy 90–95%, EBITDA 55–65%, MLAs 3–5yr
Mature sites yield predictable free cash with tenancy 90–95%, annual escalators 2–4% and renewal rates >90%, driving 2024 towerco EBITDA ~55–65% while O&M margins run 15–25%. Long MLAs (3–5yr) cut churn <5% and capex is minimal; incremental tenants flow nearly straight to EBITDA.
| Metric | 2024 Value |
|---|---|
| Tenancy | 90–95% |
| EBITDA (towerco) | 55–65% |
| O&M margin | 15–25% |
| Escalators | 2–4% |
| Renewal rate | >90% |
Delivered as Shown
IHS BCG Matrix
The file you're previewing here is the exact BCG Matrix document you'll receive after purchase. No watermarks, no demo text—just the fully formatted, analysis-ready report built for clarity. After buying, the same file is sent straight to your inbox and is immediately editable, printable, and presentable. No surprises—just plug-and-play strategy material from day one.











