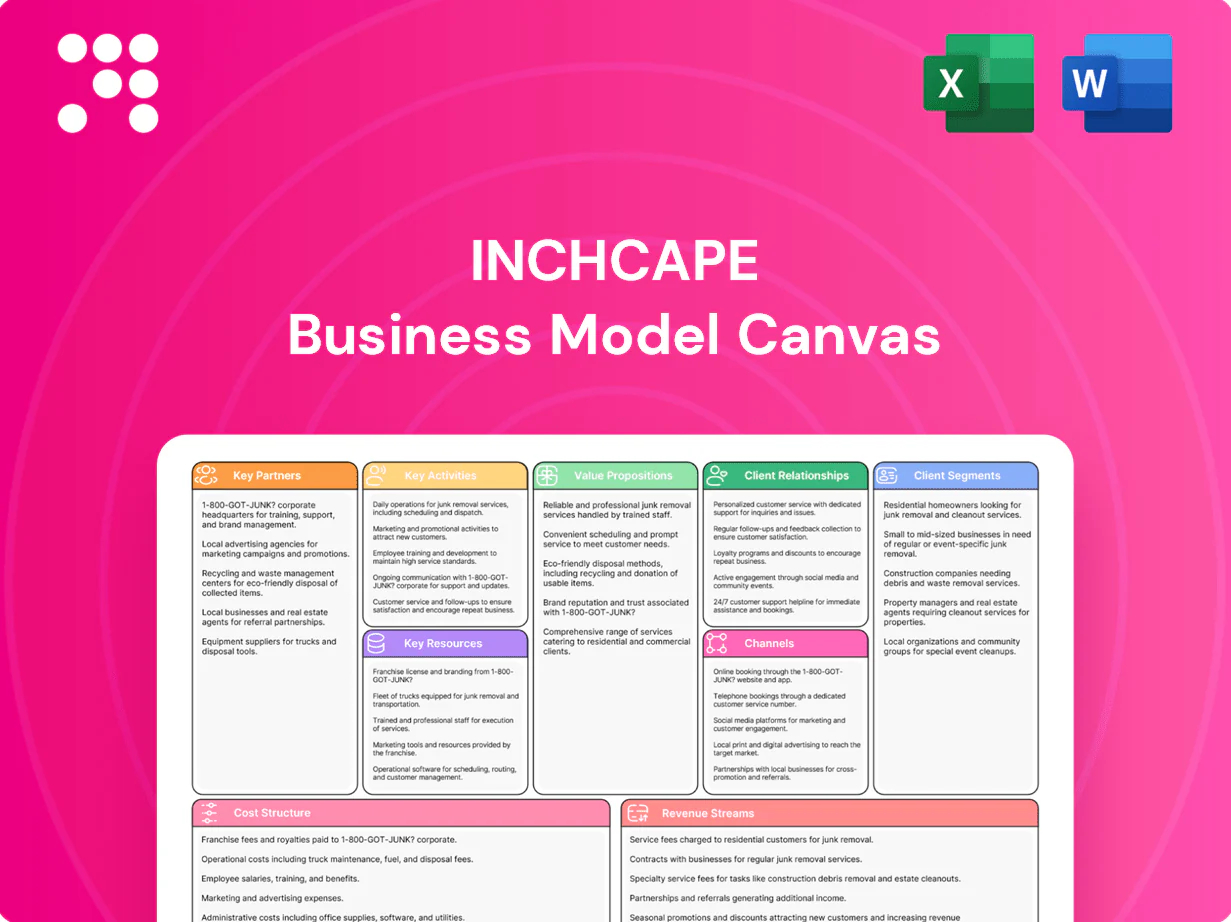
Inchcape Business Model Canvas

Editable Business Model Canvas: strategic blueprint for investors, consultants, founders
Unlock the full strategic blueprint behind Inchcape’s business model with our in-depth Business Model Canvas. This concise, editable file maps value propositions, channels, customer segments and revenue streams. Ideal for investors, consultants, and founders seeking actionable insights and benchmarking. Download the complete Word and Excel versions to accelerate strategic planning and competitive analysis.
Partnerships

Global OEM alliances
Strategic agreements with leading automakers secure exclusive or preferred distribution and retail rights across over 30 markets and 40+ brand partnerships, providing consistent product pipelines, training and brand standards. These alliances underpin multi-year volume and margin visibility, while joint planning coordinates launches, pricing and aftersales programs to protect fleet and retail economics.
Dealer and sub-dealer networks
Local dealership and sub-dealer partners extend Inchcape’s physical coverage across 36 markets, delivering sales, service and OEM-standard customer support where Inchcape acts as distributor. Structured incentive programs with dealers drive sell-through and CSI, historically improving retail volumes by low-double-digit percentages. Data-sharing agreements with partners enhance stock allocation and targeted marketing, reducing days-of-supply and improving turnover.

Finance and insurance providers
Banks and insurers provide retail finance, leasing, wholesale floorplan and protection products that underpin Inchcape retail and dealer flows; finance penetration in developed markets reached ~80–85% in 2024 (Experian/industry data). Co-developed offers have been shown to lift conversion by up to 15% and average basket value by ~10–12% (industry benchmarks, 2024). Risk-sharing models with partners improve capital efficiency and return on assets, while embedded digital journeys cut approval times and compliance costs, raising approval rates and customer NPS.

Logistics and supply chain partners
Port operators, carriers and 3PLs manage inbound vehicles, parts and last-mile distribution for Inchcape, with SLAs driving delivery speed, quality and cost control; Inchcape reported FY2024 revenue of £8.9bn, underscoring scale-driven logistics needs. Integrated systems give VIN-level visibility across the chain while flex capacity supports model launches and seasonal peaks, reducing stockouts and accelerating turn-in-market.
- Port operators: berth-to-yard throughput
- Carriers & 3PLs: inbound, parts, last mile
- SLAs: speed, quality, cost control
- Systems: VIN-level visibility
- Flex capacity: launch & seasonal peak support
Digital and data technology partners
Digital partners — CRM, DMS, e-commerce and analytics vendors — power Inchcape’s omnichannel retailing, linking online leads to c.1,000 retail outlets and aftersales operations; API integrations enable near-real-time lead-to-order and service booking workflows. Data partners refine customer targeting and dynamic pricing; cyber and compliance vendors protect operations across Inchcape’s global footprint.
- CRM/DMS/e-commerce/analytics: omnichannel enablement
- API integrations: lead-to-order & service booking
- Data partners: targeting & pricing
- Cyber & compliance: scale security
36-market OEM network: £8.9bn revenue, ~1,000 outlets, finance penetration ~80–85%
Strategic OEM agreements (40+ brands) and local dealer networks across 36 markets secure supply, brand standards and multi-year volume visibility, supporting c.1,000 retail outlets. FY2024 revenue was £8.9bn; finance penetration in developed markets ~80–85% (2024). Logistics, digital and finance partners cut days-of-supply and lift conversion (up to 15%) and basket value (10–12%).
| Metric | Value (2024) |
|---|---|
| Markets | 36 |
| Brand partners | 40+ |
| Retail outlets | ~1,000 |
| FY Revenue | £8.9bn |
| Finance penetration | 80–85% |
| Conversion uplift (partners) | up to 15% |
What is included in the product
 Detailed Word Document
A comprehensive Business Model Canvas tailored to Inchcape’s global automotive distribution and retail strategy, covering customer segments, channels, value propositions and organized into the 9 classic blocks with narrative and insights. Includes competitive-advantage analysis and linked SWOT, ideal for presentations, investor or bank discussions and strategic decision-making.

 Customizable Excel Spreadsheet
Condenses Inchcape’s global distribution, aftersales and partner network into one editable canvas for quick review and team alignment, saving hours of structuring strategy and enabling fast comparison across markets.
Activities

Vehicle distribution and importation
Inchcape manages homologation, pricing and channel allocation for OEMs across 35 markets, aligning launch calendars and national sales programmes to maximise dealer sell-through and meet brand KPIs. The group oversees customs, PDI and national inventory for c.500,000 retail units, optimising mix and transfer pricing within regulatory guardrails to protect OEM margins. Centralised coordination supports multi-market launches and pricing agility while controlling logistic and compliance costs.
Retail sales and omnichannel
Operate showrooms and digital storefronts for new and used vehicles across 32 markets, integrating online lead capture, remote quotes and home delivery to shorten lead-to-sale cycles. Maintain consistent pricing and customer experience across channels while leveraging analytics to boost conversion and gross margins. Investments in omnichannel platforms and data-driven pricing optimize inventory turnover and profit per unit.

Aftersales service and parts
Provide maintenance, repair and warranty services to OEM standards while managing parts sourcing, pricing and availability to achieve industry parts fill-rates above 95%; use targeted service marketing to boost retention (industry uplift ~10–20%) and monitor technician productivity (typical target 8–10 jobs/day) and quality KPIs such as first-time fix rate and warranty claim rates to drive margin and loyalty.

Market development and brand building
Market development and brand building: expand footprint via new market entries and selective brand additions, leveraging Inchcape's presence across c.30 markets to scale dealer networks and aftermarket services.
Execute local marketing, PR and community engagement campaigns, calibrate product positioning to local demand and segment economics, and ensure full compliance with advertising and consumer laws and standards.
- Expand footprint: new markets & brand adds (c.30 markets)
- Local marketing, PR, community engagement
- Product positioning to local demand
- Advertising & consumer law compliance
Data, pricing, and performance management
Inchcape aggregates sales and service data across its 32 markets to generate predictive insights and rolling forecasts, enabling inventory and service capacity planning. Dynamic pricing engines optimize margins on vehicles, parts, and F&I in near real-time, while CSI/NPS and operational KPIs are tracked to drive retention and cost control. Market intelligence feeds to OEMs inform product allocation and go-to-market strategy adjustments in 2024.
- Data aggregation: 32 markets
- Dynamic pricing: vehicles, parts, F&I
- Performance metrics: CSI/NPS + KPIs
- OEM intelligence: allocation & strategy
Analytics-driven omnichannel auto network: 32 markets, 500k units, >95% parts fill-rate
Inchcape coordinates homologation, pricing and allocation across 32–35 markets, managing c.500,000 retail units to protect OEM margins. Operates omnichannel sales and 32-market showrooms with analytics-driven pricing. Delivers aftersales with >95% parts fill-rate and 8–10 tech jobs/day, boosting retention ~10–20%.
| Metric | Value (2024) |
|---|---|
| Markets | 32–35 |
| Retail units managed | c.500,000 |
| Parts fill-rate | >95% |
| Technician productivity | 8–10 jobs/day |
| Retention uplift | 10–20% |
Full Version Awaits
Business Model Canvas
The Inchcape Business Model Canvas you see here is the actual deliverable, not a mockup or sample. This preview is a direct excerpt from the final file you’ll receive upon purchase. After checkout you’ll instantly download the complete, professionally formatted document in Word and Excel, ready to edit, present, and share.

Editable Business Model Canvas: strategic blueprint for investors, consultants, founders
Unlock the full strategic blueprint behind Inchcape’s business model with our in-depth Business Model Canvas. This concise, editable file maps value propositions, channels, customer segments and revenue streams. Ideal for investors, consultants, and founders seeking actionable insights and benchmarking. Download the complete Word and Excel versions to accelerate strategic planning and competitive analysis.
Partnerships
Global OEM alliances
Strategic agreements with leading automakers secure exclusive or preferred distribution and retail rights across over 30 markets and 40+ brand partnerships, providing consistent product pipelines, training and brand standards. These alliances underpin multi-year volume and margin visibility, while joint planning coordinates launches, pricing and aftersales programs to protect fleet and retail economics.
Dealer and sub-dealer networks
Local dealership and sub-dealer partners extend Inchcape’s physical coverage across 36 markets, delivering sales, service and OEM-standard customer support where Inchcape acts as distributor. Structured incentive programs with dealers drive sell-through and CSI, historically improving retail volumes by low-double-digit percentages. Data-sharing agreements with partners enhance stock allocation and targeted marketing, reducing days-of-supply and improving turnover.
Finance and insurance providers
Banks and insurers provide retail finance, leasing, wholesale floorplan and protection products that underpin Inchcape retail and dealer flows; finance penetration in developed markets reached ~80–85% in 2024 (Experian/industry data). Co-developed offers have been shown to lift conversion by up to 15% and average basket value by ~10–12% (industry benchmarks, 2024). Risk-sharing models with partners improve capital efficiency and return on assets, while embedded digital journeys cut approval times and compliance costs, raising approval rates and customer NPS.
Logistics and supply chain partners
Port operators, carriers and 3PLs manage inbound vehicles, parts and last-mile distribution for Inchcape, with SLAs driving delivery speed, quality and cost control; Inchcape reported FY2024 revenue of £8.9bn, underscoring scale-driven logistics needs. Integrated systems give VIN-level visibility across the chain while flex capacity supports model launches and seasonal peaks, reducing stockouts and accelerating turn-in-market.
- Port operators: berth-to-yard throughput
- Carriers & 3PLs: inbound, parts, last mile
- SLAs: speed, quality, cost control
- Systems: VIN-level visibility
- Flex capacity: launch & seasonal peak support
Digital and data technology partners
Digital partners — CRM, DMS, e-commerce and analytics vendors — power Inchcape’s omnichannel retailing, linking online leads to c.1,000 retail outlets and aftersales operations; API integrations enable near-real-time lead-to-order and service booking workflows. Data partners refine customer targeting and dynamic pricing; cyber and compliance vendors protect operations across Inchcape’s global footprint.
- CRM/DMS/e-commerce/analytics: omnichannel enablement
- API integrations: lead-to-order & service booking
- Data partners: targeting & pricing
- Cyber & compliance: scale security
36-market OEM network: £8.9bn revenue, ~1,000 outlets, finance penetration ~80–85%
Strategic OEM agreements (40+ brands) and local dealer networks across 36 markets secure supply, brand standards and multi-year volume visibility, supporting c.1,000 retail outlets. FY2024 revenue was £8.9bn; finance penetration in developed markets ~80–85% (2024). Logistics, digital and finance partners cut days-of-supply and lift conversion (up to 15%) and basket value (10–12%).
| Metric | Value (2024) |
|---|---|
| Markets | 36 |
| Brand partners | 40+ |
| Retail outlets | ~1,000 |
| FY Revenue | £8.9bn |
| Finance penetration | 80–85% |
| Conversion uplift (partners) | up to 15% |
What is included in the product
Detailed Word Document
A comprehensive Business Model Canvas tailored to Inchcape’s global automotive distribution and retail strategy, covering customer segments, channels, value propositions and organized into the 9 classic blocks with narrative and insights. Includes competitive-advantage analysis and linked SWOT, ideal for presentations, investor or bank discussions and strategic decision-making.
Customizable Excel Spreadsheet
Condenses Inchcape’s global distribution, aftersales and partner network into one editable canvas for quick review and team alignment, saving hours of structuring strategy and enabling fast comparison across markets.
Activities
Vehicle distribution and importation
Inchcape manages homologation, pricing and channel allocation for OEMs across 35 markets, aligning launch calendars and national sales programmes to maximise dealer sell-through and meet brand KPIs. The group oversees customs, PDI and national inventory for c.500,000 retail units, optimising mix and transfer pricing within regulatory guardrails to protect OEM margins. Centralised coordination supports multi-market launches and pricing agility while controlling logistic and compliance costs.
Retail sales and omnichannel
Operate showrooms and digital storefronts for new and used vehicles across 32 markets, integrating online lead capture, remote quotes and home delivery to shorten lead-to-sale cycles. Maintain consistent pricing and customer experience across channels while leveraging analytics to boost conversion and gross margins. Investments in omnichannel platforms and data-driven pricing optimize inventory turnover and profit per unit.
Aftersales service and parts
Provide maintenance, repair and warranty services to OEM standards while managing parts sourcing, pricing and availability to achieve industry parts fill-rates above 95%; use targeted service marketing to boost retention (industry uplift ~10–20%) and monitor technician productivity (typical target 8–10 jobs/day) and quality KPIs such as first-time fix rate and warranty claim rates to drive margin and loyalty.
Market development and brand building
Market development and brand building: expand footprint via new market entries and selective brand additions, leveraging Inchcape's presence across c.30 markets to scale dealer networks and aftermarket services.
Execute local marketing, PR and community engagement campaigns, calibrate product positioning to local demand and segment economics, and ensure full compliance with advertising and consumer laws and standards.
- Expand footprint: new markets & brand adds (c.30 markets)
- Local marketing, PR, community engagement
- Product positioning to local demand
- Advertising & consumer law compliance
Data, pricing, and performance management
Inchcape aggregates sales and service data across its 32 markets to generate predictive insights and rolling forecasts, enabling inventory and service capacity planning. Dynamic pricing engines optimize margins on vehicles, parts, and F&I in near real-time, while CSI/NPS and operational KPIs are tracked to drive retention and cost control. Market intelligence feeds to OEMs inform product allocation and go-to-market strategy adjustments in 2024.
- Data aggregation: 32 markets
- Dynamic pricing: vehicles, parts, F&I
- Performance metrics: CSI/NPS + KPIs
- OEM intelligence: allocation & strategy
Analytics-driven omnichannel auto network: 32 markets, 500k units, >95% parts fill-rate
Inchcape coordinates homologation, pricing and allocation across 32–35 markets, managing c.500,000 retail units to protect OEM margins. Operates omnichannel sales and 32-market showrooms with analytics-driven pricing. Delivers aftersales with >95% parts fill-rate and 8–10 tech jobs/day, boosting retention ~10–20%.
| Metric | Value (2024) |
|---|---|
| Markets | 32–35 |
| Retail units managed | c.500,000 |
| Parts fill-rate | >95% |
| Technician productivity | 8–10 jobs/day |
| Retention uplift | 10–20% |
Full Version Awaits
Business Model Canvas
The Inchcape Business Model Canvas you see here is the actual deliverable, not a mockup or sample. This preview is a direct excerpt from the final file you’ll receive upon purchase. After checkout you’ll instantly download the complete, professionally formatted document in Word and Excel, ready to edit, present, and share.
Original: $10.00
-65%$10.00
$3.50Description
Editable Business Model Canvas: strategic blueprint for investors, consultants, founders
Unlock the full strategic blueprint behind Inchcape’s business model with our in-depth Business Model Canvas. This concise, editable file maps value propositions, channels, customer segments and revenue streams. Ideal for investors, consultants, and founders seeking actionable insights and benchmarking. Download the complete Word and Excel versions to accelerate strategic planning and competitive analysis.
Partnerships
Global OEM alliances
Strategic agreements with leading automakers secure exclusive or preferred distribution and retail rights across over 30 markets and 40+ brand partnerships, providing consistent product pipelines, training and brand standards. These alliances underpin multi-year volume and margin visibility, while joint planning coordinates launches, pricing and aftersales programs to protect fleet and retail economics.
Dealer and sub-dealer networks
Local dealership and sub-dealer partners extend Inchcape’s physical coverage across 36 markets, delivering sales, service and OEM-standard customer support where Inchcape acts as distributor. Structured incentive programs with dealers drive sell-through and CSI, historically improving retail volumes by low-double-digit percentages. Data-sharing agreements with partners enhance stock allocation and targeted marketing, reducing days-of-supply and improving turnover.
Finance and insurance providers
Banks and insurers provide retail finance, leasing, wholesale floorplan and protection products that underpin Inchcape retail and dealer flows; finance penetration in developed markets reached ~80–85% in 2024 (Experian/industry data). Co-developed offers have been shown to lift conversion by up to 15% and average basket value by ~10–12% (industry benchmarks, 2024). Risk-sharing models with partners improve capital efficiency and return on assets, while embedded digital journeys cut approval times and compliance costs, raising approval rates and customer NPS.
Logistics and supply chain partners
Port operators, carriers and 3PLs manage inbound vehicles, parts and last-mile distribution for Inchcape, with SLAs driving delivery speed, quality and cost control; Inchcape reported FY2024 revenue of £8.9bn, underscoring scale-driven logistics needs. Integrated systems give VIN-level visibility across the chain while flex capacity supports model launches and seasonal peaks, reducing stockouts and accelerating turn-in-market.
- Port operators: berth-to-yard throughput
- Carriers & 3PLs: inbound, parts, last mile
- SLAs: speed, quality, cost control
- Systems: VIN-level visibility
- Flex capacity: launch & seasonal peak support
Digital and data technology partners
Digital partners — CRM, DMS, e-commerce and analytics vendors — power Inchcape’s omnichannel retailing, linking online leads to c.1,000 retail outlets and aftersales operations; API integrations enable near-real-time lead-to-order and service booking workflows. Data partners refine customer targeting and dynamic pricing; cyber and compliance vendors protect operations across Inchcape’s global footprint.
- CRM/DMS/e-commerce/analytics: omnichannel enablement
- API integrations: lead-to-order & service booking
- Data partners: targeting & pricing
- Cyber & compliance: scale security
36-market OEM network: £8.9bn revenue, ~1,000 outlets, finance penetration ~80–85%
Strategic OEM agreements (40+ brands) and local dealer networks across 36 markets secure supply, brand standards and multi-year volume visibility, supporting c.1,000 retail outlets. FY2024 revenue was £8.9bn; finance penetration in developed markets ~80–85% (2024). Logistics, digital and finance partners cut days-of-supply and lift conversion (up to 15%) and basket value (10–12%).
| Metric | Value (2024) |
|---|---|
| Markets | 36 |
| Brand partners | 40+ |
| Retail outlets | ~1,000 |
| FY Revenue | £8.9bn |
| Finance penetration | 80–85% |
| Conversion uplift (partners) | up to 15% |
What is included in the product
Detailed Word Document
A comprehensive Business Model Canvas tailored to Inchcape’s global automotive distribution and retail strategy, covering customer segments, channels, value propositions and organized into the 9 classic blocks with narrative and insights. Includes competitive-advantage analysis and linked SWOT, ideal for presentations, investor or bank discussions and strategic decision-making.
Customizable Excel Spreadsheet
Condenses Inchcape’s global distribution, aftersales and partner network into one editable canvas for quick review and team alignment, saving hours of structuring strategy and enabling fast comparison across markets.
Activities
Vehicle distribution and importation
Inchcape manages homologation, pricing and channel allocation for OEMs across 35 markets, aligning launch calendars and national sales programmes to maximise dealer sell-through and meet brand KPIs. The group oversees customs, PDI and national inventory for c.500,000 retail units, optimising mix and transfer pricing within regulatory guardrails to protect OEM margins. Centralised coordination supports multi-market launches and pricing agility while controlling logistic and compliance costs.
Retail sales and omnichannel
Operate showrooms and digital storefronts for new and used vehicles across 32 markets, integrating online lead capture, remote quotes and home delivery to shorten lead-to-sale cycles. Maintain consistent pricing and customer experience across channels while leveraging analytics to boost conversion and gross margins. Investments in omnichannel platforms and data-driven pricing optimize inventory turnover and profit per unit.
Aftersales service and parts
Provide maintenance, repair and warranty services to OEM standards while managing parts sourcing, pricing and availability to achieve industry parts fill-rates above 95%; use targeted service marketing to boost retention (industry uplift ~10–20%) and monitor technician productivity (typical target 8–10 jobs/day) and quality KPIs such as first-time fix rate and warranty claim rates to drive margin and loyalty.
Market development and brand building
Market development and brand building: expand footprint via new market entries and selective brand additions, leveraging Inchcape's presence across c.30 markets to scale dealer networks and aftermarket services.
Execute local marketing, PR and community engagement campaigns, calibrate product positioning to local demand and segment economics, and ensure full compliance with advertising and consumer laws and standards.
- Expand footprint: new markets & brand adds (c.30 markets)
- Local marketing, PR, community engagement
- Product positioning to local demand
- Advertising & consumer law compliance
Data, pricing, and performance management
Inchcape aggregates sales and service data across its 32 markets to generate predictive insights and rolling forecasts, enabling inventory and service capacity planning. Dynamic pricing engines optimize margins on vehicles, parts, and F&I in near real-time, while CSI/NPS and operational KPIs are tracked to drive retention and cost control. Market intelligence feeds to OEMs inform product allocation and go-to-market strategy adjustments in 2024.
- Data aggregation: 32 markets
- Dynamic pricing: vehicles, parts, F&I
- Performance metrics: CSI/NPS + KPIs
- OEM intelligence: allocation & strategy
Analytics-driven omnichannel auto network: 32 markets, 500k units, >95% parts fill-rate
Inchcape coordinates homologation, pricing and allocation across 32–35 markets, managing c.500,000 retail units to protect OEM margins. Operates omnichannel sales and 32-market showrooms with analytics-driven pricing. Delivers aftersales with >95% parts fill-rate and 8–10 tech jobs/day, boosting retention ~10–20%.
| Metric | Value (2024) |
|---|---|
| Markets | 32–35 |
| Retail units managed | c.500,000 |
| Parts fill-rate | >95% |
| Technician productivity | 8–10 jobs/day |
| Retention uplift | 10–20% |
Full Version Awaits
Business Model Canvas
The Inchcape Business Model Canvas you see here is the actual deliverable, not a mockup or sample. This preview is a direct excerpt from the final file you’ll receive upon purchase. After checkout you’ll instantly download the complete, professionally formatted document in Word and Excel, ready to edit, present, and share.











