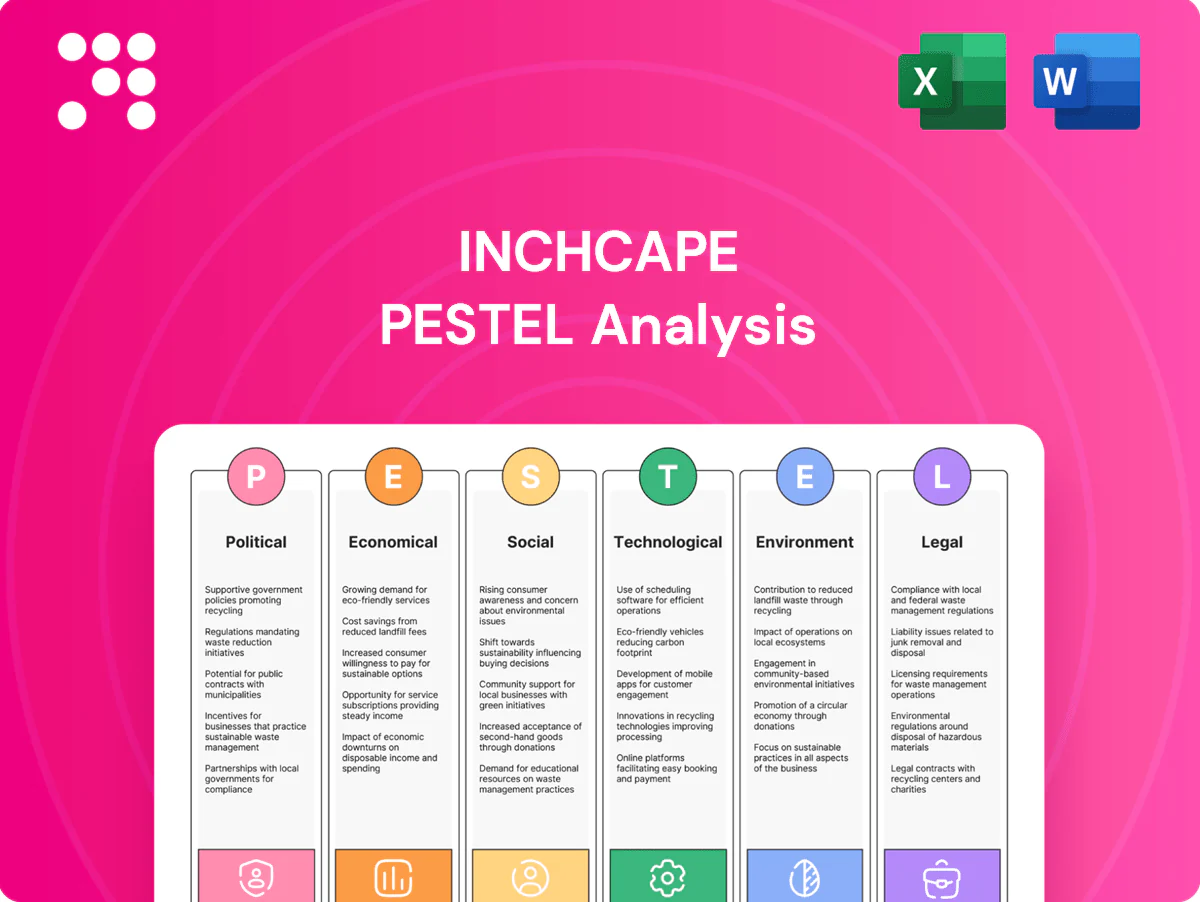
Inchcape PESTLE Analysis

Make Smarter Strategic Decisions with a Complete PESTEL View
Discover how regulatory shifts, supply-chain dynamics, and electrification trends are reshaping Inchcape’s strategic outlook in our concise PESTLE snapshot. This analysis highlights risks and opportunities that investors and strategists can act on immediately. Purchase the full PESTLE for a complete, editable report with deep-dive insights and practical recommendations.
Political factors

Trade policies and import tariffs
As a global distributor Inchcape is exposed to shifts in tariffs and non‑tariff barriers on vehicles and parts, with import duties ranging from about 2.5% in the US to 10% in the EU. Preferential trade agreements, which now cover over 70% of world trade, can lower landed costs and sharpen price competitiveness. Conversely, rising protectionism and local content rules compress margins and complicate sourcing. Proactive policy monitoring and diversified sourcing mitigate volatility.
Government EV incentives and industrial strategy
Purchase subsidies and tax credits such as the US federal EV tax credit of up to $7,500 and the Bipartisan Infrastructure Law's $7.5 billion EV charger fund accelerate adoption and shift fleet mix toward electrics, benefiting distributors with EV-ready capabilities. OEM allocation often follows these supportive policies, while sudden incentive cuts create demand cliffs and inventory risk. Aligning with national industrial goals can secure government-backed partnerships and pilot programs.

Political stability in emerging markets
Currency controls, civil unrest and abrupt regulatory changes in emerging markets can sharply disrupt Inchcape's sales and logistics, affecting parts flow and franchise revenues. Inchcape's footprint across 31 markets spreads exposure but mandates country-specific contingency plans. Strong local stakeholder relationships ease licensing and customs navigation. Scenario planning sustains resilient inventory and cash management.

Public procurement and fleet policies
Government fleet electrification targets shape Inchcape’s B2B pipeline, with the US federal fleet of ~600,000 vehicles committing to ZEVs by 2035 and EU public procurement representing roughly 14% of EU GDP, creating sizable demand for electrified models and services. Local-content or assembly requirements in markets like India and parts of LATAM can favor certain brands or configurations, so transparent tender processes and strict compliance are essential to secure and retain contracts. Building tailored aftersales propositions—service, parts, telematics—boosts lifecycle value for public fleets and improves win rates for repeat procurements.
- Fleet electrification targets: US federal ZEV by 2035
- Public procurement scale: ~14% of EU GDP
- Local-content rules favor assembly/partners
- Aftersales & telematics increase lifecycle value
Geopolitics and sanctions exposure
Geopolitics and sanctions regimes since 2022 have constrained vehicle and parts flows to sanctioned markets and specific OEMs, while expanded dual-use controls in 2023–24 increased oversight of connected vehicle components and software; Inchcape must therefore sustain rigorous screening and documentation to avoid supply-chain stoppages and fines. Rapid policy shifts force agile contract and routing adjustments to maintain distribution continuity.
Tariff swings and sanctions complicate global sourcing as US EV incentives reshape demand
Inchcape faces tariff swings (approx 2.5–10%), trade agreements covering >70% of world trade, and rising protectionism that complicate sourcing across its 31 markets. EV incentives like the US $7,500 federal credit and a $7.5bn charger fund, plus US federal fleet (~600,000 vehicles) ZEV target by 2035, accelerate EV demand and OEM allocation. Sanctions and expanded dual‑use controls since 2022–24 require strict screening and agile routing to avoid stoppages and fines.
| Indicator | Value |
|---|---|
| Markets | 31 |
| Tariff range | ~2.5%–10% |
| Trade coverage | >70% |
| US EV credit | $7,500 |
| Charger fund | $7.5bn |
| US federal fleet | ~600,000 (ZEV by 2035) |
What is included in the product
 Detailed Word Document
Explores how external macro-environmental factors uniquely affect the Inchcape across six dimensions—Political, Economic, Social, Technological, Environmental, and Legal—each backed by relevant data and trends to identify risks and opportunities for executives, consultants, and investors; includes forward-looking insights for scenario planning and strategic action.

 Customizable Excel Spreadsheet
Provides a concise, visually segmented PESTLE summary of Inchcape that’s easy to drop into presentations or share across teams, enabling quick alignment on external risks and market positioning during planning sessions.
Economic factors

Consumer demand tied to macro cycles
Auto demand is highly sensitive to GDP, employment and consumer confidence—IMF projected global GDP growth of about 3.1% for 2024, which directly affects purchase cycles for OEMs and dealers.
Downturns cut big-ticket purchases and shift consumers to used cars or lower trims, with global light-vehicle volumes near 70 million in 2024 reflecting uneven recovery across markets.
Aftersales provides counter-cyclical revenue stability, often insulating margins when new-vehicle sales slip, while flexible pricing and financing (captive finance, longer terms) sustain volumes through cycles.
FX volatility and cost pass-through
Inchcape's multi-currency operations across over 30 markets create material translation and transaction risk across vehicles and parts, with 10%+ currency moves common in emerging markets. Depreciating local currencies lift landed costs and can suppress retail demand if pass-through forces price increases. Active hedging programs and localized sourcing materially reduce exposure. Transparent price architecture supports margin preservation.

Interest rates and credit availability
Auto sales hinge on financing terms for retail and fleet customers; persistent policy rates (US fed funds 5.25–5.50%, BOE 5.25%, ECB ~4.00% in 2024) pushed average new-vehicle APRs to roughly 7.5% in major markets in 2024, damping affordability and raising delinquency pressures. Inchcape mitigates this via partnerships with lenders and captive finance programs to tailor offers. Dynamic APR promotions are used to smooth demand across rate environments.

Supply chain normalization and inventory
Supply chain normalization after the semiconductor shortage shortened lead times (industry median ~12 weeks by end-2023) and shifted allocation tactics, increasing discounting to clear mismatched stock. As supply loosens and model cycles compress, overstock risk rises while global vehicle production recovered to ~90% of 2019 levels by 2023. Inchcape leverages data-led demand planning and omnichannel insights to align mix, accelerate turns and reduce carrying costs.
- Shorter lead times: ~12 weeks (end-2023)
- Production recovery: ~90% of 2019 (2023)
- Data-led mix + omnichannel = faster stock turns, lower carrying costs
Used car and residual value dynamics
Residual values directly shape leasing economics and total cost of ownership; Manheim reported roughly a 10% year‑on‑year decline in its U.S. Used Vehicle Value Index in 2024, pressuring trade‑in values and new‑car margins.
Certified pre‑owned programmes and extended warranties preserve brand equity, while Inchcape’s integrated remarketing and wholesale channels boost lifecycle profitability and recovery rates.
- Residual impact on leases
- ~10% Manheim 2024 YOY decline
- CPO and warranty = brand protection
- Integrated remarketing = higher recovery
Tariff swings and sanctions complicate global sourcing as US EV incentives reshape demand
Global GDP ~3.1% (IMF 2024) keeps auto demand sensitive to macro cycles; light‑vehicle volumes ~70m in 2024 with uneven regional recovery. Higher policy rates (US 5.25–5.50%, BOE 5.25%, ECB ~4.0% in 2024) lifted APRs ~7.5%, pressuring affordability; Manheim used‑value index fell ~10% YOY in 2024, squeezing trade‑ins and margins.
| Indicator | Value | Impact |
|---|---|---|
| Global GDP (IMF) | ~3.1% (2024) | Drives OEM/dealer demand |
| LV volumes | ~70m (2024) | Uneven recovery |
| Policy rates | US 5.25–5.50% (2024) | Higher APRs, lower affordability |
| Used values | Manheim −10% YOY (2024) | Reduces residuals, margins |
Same Document Delivered
Inchcape PESTLE Analysis
The Inchcape PESTLE Analysis preview shown here is the exact document you’ll receive after purchase—fully formatted and ready to use. The content, structure and layout are identical to the downloadable file, with no placeholders or teasers. After payment you’ll instantly get this same professional report.

Make Smarter Strategic Decisions with a Complete PESTEL View
Discover how regulatory shifts, supply-chain dynamics, and electrification trends are reshaping Inchcape’s strategic outlook in our concise PESTLE snapshot. This analysis highlights risks and opportunities that investors and strategists can act on immediately. Purchase the full PESTLE for a complete, editable report with deep-dive insights and practical recommendations.
Political factors
Trade policies and import tariffs
As a global distributor Inchcape is exposed to shifts in tariffs and non‑tariff barriers on vehicles and parts, with import duties ranging from about 2.5% in the US to 10% in the EU. Preferential trade agreements, which now cover over 70% of world trade, can lower landed costs and sharpen price competitiveness. Conversely, rising protectionism and local content rules compress margins and complicate sourcing. Proactive policy monitoring and diversified sourcing mitigate volatility.
Government EV incentives and industrial strategy
Purchase subsidies and tax credits such as the US federal EV tax credit of up to $7,500 and the Bipartisan Infrastructure Law's $7.5 billion EV charger fund accelerate adoption and shift fleet mix toward electrics, benefiting distributors with EV-ready capabilities. OEM allocation often follows these supportive policies, while sudden incentive cuts create demand cliffs and inventory risk. Aligning with national industrial goals can secure government-backed partnerships and pilot programs.
Political stability in emerging markets
Currency controls, civil unrest and abrupt regulatory changes in emerging markets can sharply disrupt Inchcape's sales and logistics, affecting parts flow and franchise revenues. Inchcape's footprint across 31 markets spreads exposure but mandates country-specific contingency plans. Strong local stakeholder relationships ease licensing and customs navigation. Scenario planning sustains resilient inventory and cash management.
Public procurement and fleet policies
Government fleet electrification targets shape Inchcape’s B2B pipeline, with the US federal fleet of ~600,000 vehicles committing to ZEVs by 2035 and EU public procurement representing roughly 14% of EU GDP, creating sizable demand for electrified models and services. Local-content or assembly requirements in markets like India and parts of LATAM can favor certain brands or configurations, so transparent tender processes and strict compliance are essential to secure and retain contracts. Building tailored aftersales propositions—service, parts, telematics—boosts lifecycle value for public fleets and improves win rates for repeat procurements.
- Fleet electrification targets: US federal ZEV by 2035
- Public procurement scale: ~14% of EU GDP
- Local-content rules favor assembly/partners
- Aftersales & telematics increase lifecycle value
Geopolitics and sanctions exposure
Geopolitics and sanctions regimes since 2022 have constrained vehicle and parts flows to sanctioned markets and specific OEMs, while expanded dual-use controls in 2023–24 increased oversight of connected vehicle components and software; Inchcape must therefore sustain rigorous screening and documentation to avoid supply-chain stoppages and fines. Rapid policy shifts force agile contract and routing adjustments to maintain distribution continuity.
Tariff swings and sanctions complicate global sourcing as US EV incentives reshape demand
Inchcape faces tariff swings (approx 2.5–10%), trade agreements covering >70% of world trade, and rising protectionism that complicate sourcing across its 31 markets. EV incentives like the US $7,500 federal credit and a $7.5bn charger fund, plus US federal fleet (~600,000 vehicles) ZEV target by 2035, accelerate EV demand and OEM allocation. Sanctions and expanded dual‑use controls since 2022–24 require strict screening and agile routing to avoid stoppages and fines.
| Indicator | Value |
|---|---|
| Markets | 31 |
| Tariff range | ~2.5%–10% |
| Trade coverage | >70% |
| US EV credit | $7,500 |
| Charger fund | $7.5bn |
| US federal fleet | ~600,000 (ZEV by 2035) |
What is included in the product
Detailed Word Document
Explores how external macro-environmental factors uniquely affect the Inchcape across six dimensions—Political, Economic, Social, Technological, Environmental, and Legal—each backed by relevant data and trends to identify risks and opportunities for executives, consultants, and investors; includes forward-looking insights for scenario planning and strategic action.
Customizable Excel Spreadsheet
Provides a concise, visually segmented PESTLE summary of Inchcape that’s easy to drop into presentations or share across teams, enabling quick alignment on external risks and market positioning during planning sessions.
Economic factors
Consumer demand tied to macro cycles
Auto demand is highly sensitive to GDP, employment and consumer confidence—IMF projected global GDP growth of about 3.1% for 2024, which directly affects purchase cycles for OEMs and dealers.
Downturns cut big-ticket purchases and shift consumers to used cars or lower trims, with global light-vehicle volumes near 70 million in 2024 reflecting uneven recovery across markets.
Aftersales provides counter-cyclical revenue stability, often insulating margins when new-vehicle sales slip, while flexible pricing and financing (captive finance, longer terms) sustain volumes through cycles.
FX volatility and cost pass-through
Inchcape's multi-currency operations across over 30 markets create material translation and transaction risk across vehicles and parts, with 10%+ currency moves common in emerging markets. Depreciating local currencies lift landed costs and can suppress retail demand if pass-through forces price increases. Active hedging programs and localized sourcing materially reduce exposure. Transparent price architecture supports margin preservation.
Interest rates and credit availability
Auto sales hinge on financing terms for retail and fleet customers; persistent policy rates (US fed funds 5.25–5.50%, BOE 5.25%, ECB ~4.00% in 2024) pushed average new-vehicle APRs to roughly 7.5% in major markets in 2024, damping affordability and raising delinquency pressures. Inchcape mitigates this via partnerships with lenders and captive finance programs to tailor offers. Dynamic APR promotions are used to smooth demand across rate environments.
Supply chain normalization and inventory
Supply chain normalization after the semiconductor shortage shortened lead times (industry median ~12 weeks by end-2023) and shifted allocation tactics, increasing discounting to clear mismatched stock. As supply loosens and model cycles compress, overstock risk rises while global vehicle production recovered to ~90% of 2019 levels by 2023. Inchcape leverages data-led demand planning and omnichannel insights to align mix, accelerate turns and reduce carrying costs.
- Shorter lead times: ~12 weeks (end-2023)
- Production recovery: ~90% of 2019 (2023)
- Data-led mix + omnichannel = faster stock turns, lower carrying costs
Used car and residual value dynamics
Residual values directly shape leasing economics and total cost of ownership; Manheim reported roughly a 10% year‑on‑year decline in its U.S. Used Vehicle Value Index in 2024, pressuring trade‑in values and new‑car margins.
Certified pre‑owned programmes and extended warranties preserve brand equity, while Inchcape’s integrated remarketing and wholesale channels boost lifecycle profitability and recovery rates.
- Residual impact on leases
- ~10% Manheim 2024 YOY decline
- CPO and warranty = brand protection
- Integrated remarketing = higher recovery
Tariff swings and sanctions complicate global sourcing as US EV incentives reshape demand
Global GDP ~3.1% (IMF 2024) keeps auto demand sensitive to macro cycles; light‑vehicle volumes ~70m in 2024 with uneven regional recovery. Higher policy rates (US 5.25–5.50%, BOE 5.25%, ECB ~4.0% in 2024) lifted APRs ~7.5%, pressuring affordability; Manheim used‑value index fell ~10% YOY in 2024, squeezing trade‑ins and margins.
| Indicator | Value | Impact |
|---|---|---|
| Global GDP (IMF) | ~3.1% (2024) | Drives OEM/dealer demand |
| LV volumes | ~70m (2024) | Uneven recovery |
| Policy rates | US 5.25–5.50% (2024) | Higher APRs, lower affordability |
| Used values | Manheim −10% YOY (2024) | Reduces residuals, margins |
Same Document Delivered
Inchcape PESTLE Analysis
The Inchcape PESTLE Analysis preview shown here is the exact document you’ll receive after purchase—fully formatted and ready to use. The content, structure and layout are identical to the downloadable file, with no placeholders or teasers. After payment you’ll instantly get this same professional report.
Original: $10.00
-65%$10.00
$3.50Description
Make Smarter Strategic Decisions with a Complete PESTEL View
Discover how regulatory shifts, supply-chain dynamics, and electrification trends are reshaping Inchcape’s strategic outlook in our concise PESTLE snapshot. This analysis highlights risks and opportunities that investors and strategists can act on immediately. Purchase the full PESTLE for a complete, editable report with deep-dive insights and practical recommendations.
Political factors
Trade policies and import tariffs
As a global distributor Inchcape is exposed to shifts in tariffs and non‑tariff barriers on vehicles and parts, with import duties ranging from about 2.5% in the US to 10% in the EU. Preferential trade agreements, which now cover over 70% of world trade, can lower landed costs and sharpen price competitiveness. Conversely, rising protectionism and local content rules compress margins and complicate sourcing. Proactive policy monitoring and diversified sourcing mitigate volatility.
Government EV incentives and industrial strategy
Purchase subsidies and tax credits such as the US federal EV tax credit of up to $7,500 and the Bipartisan Infrastructure Law's $7.5 billion EV charger fund accelerate adoption and shift fleet mix toward electrics, benefiting distributors with EV-ready capabilities. OEM allocation often follows these supportive policies, while sudden incentive cuts create demand cliffs and inventory risk. Aligning with national industrial goals can secure government-backed partnerships and pilot programs.
Political stability in emerging markets
Currency controls, civil unrest and abrupt regulatory changes in emerging markets can sharply disrupt Inchcape's sales and logistics, affecting parts flow and franchise revenues. Inchcape's footprint across 31 markets spreads exposure but mandates country-specific contingency plans. Strong local stakeholder relationships ease licensing and customs navigation. Scenario planning sustains resilient inventory and cash management.
Public procurement and fleet policies
Government fleet electrification targets shape Inchcape’s B2B pipeline, with the US federal fleet of ~600,000 vehicles committing to ZEVs by 2035 and EU public procurement representing roughly 14% of EU GDP, creating sizable demand for electrified models and services. Local-content or assembly requirements in markets like India and parts of LATAM can favor certain brands or configurations, so transparent tender processes and strict compliance are essential to secure and retain contracts. Building tailored aftersales propositions—service, parts, telematics—boosts lifecycle value for public fleets and improves win rates for repeat procurements.
- Fleet electrification targets: US federal ZEV by 2035
- Public procurement scale: ~14% of EU GDP
- Local-content rules favor assembly/partners
- Aftersales & telematics increase lifecycle value
Geopolitics and sanctions exposure
Geopolitics and sanctions regimes since 2022 have constrained vehicle and parts flows to sanctioned markets and specific OEMs, while expanded dual-use controls in 2023–24 increased oversight of connected vehicle components and software; Inchcape must therefore sustain rigorous screening and documentation to avoid supply-chain stoppages and fines. Rapid policy shifts force agile contract and routing adjustments to maintain distribution continuity.
Tariff swings and sanctions complicate global sourcing as US EV incentives reshape demand
Inchcape faces tariff swings (approx 2.5–10%), trade agreements covering >70% of world trade, and rising protectionism that complicate sourcing across its 31 markets. EV incentives like the US $7,500 federal credit and a $7.5bn charger fund, plus US federal fleet (~600,000 vehicles) ZEV target by 2035, accelerate EV demand and OEM allocation. Sanctions and expanded dual‑use controls since 2022–24 require strict screening and agile routing to avoid stoppages and fines.
| Indicator | Value |
|---|---|
| Markets | 31 |
| Tariff range | ~2.5%–10% |
| Trade coverage | >70% |
| US EV credit | $7,500 |
| Charger fund | $7.5bn |
| US federal fleet | ~600,000 (ZEV by 2035) |
What is included in the product
Detailed Word Document
Explores how external macro-environmental factors uniquely affect the Inchcape across six dimensions—Political, Economic, Social, Technological, Environmental, and Legal—each backed by relevant data and trends to identify risks and opportunities for executives, consultants, and investors; includes forward-looking insights for scenario planning and strategic action.
Customizable Excel Spreadsheet
Provides a concise, visually segmented PESTLE summary of Inchcape that’s easy to drop into presentations or share across teams, enabling quick alignment on external risks and market positioning during planning sessions.
Economic factors
Consumer demand tied to macro cycles
Auto demand is highly sensitive to GDP, employment and consumer confidence—IMF projected global GDP growth of about 3.1% for 2024, which directly affects purchase cycles for OEMs and dealers.
Downturns cut big-ticket purchases and shift consumers to used cars or lower trims, with global light-vehicle volumes near 70 million in 2024 reflecting uneven recovery across markets.
Aftersales provides counter-cyclical revenue stability, often insulating margins when new-vehicle sales slip, while flexible pricing and financing (captive finance, longer terms) sustain volumes through cycles.
FX volatility and cost pass-through
Inchcape's multi-currency operations across over 30 markets create material translation and transaction risk across vehicles and parts, with 10%+ currency moves common in emerging markets. Depreciating local currencies lift landed costs and can suppress retail demand if pass-through forces price increases. Active hedging programs and localized sourcing materially reduce exposure. Transparent price architecture supports margin preservation.
Interest rates and credit availability
Auto sales hinge on financing terms for retail and fleet customers; persistent policy rates (US fed funds 5.25–5.50%, BOE 5.25%, ECB ~4.00% in 2024) pushed average new-vehicle APRs to roughly 7.5% in major markets in 2024, damping affordability and raising delinquency pressures. Inchcape mitigates this via partnerships with lenders and captive finance programs to tailor offers. Dynamic APR promotions are used to smooth demand across rate environments.
Supply chain normalization and inventory
Supply chain normalization after the semiconductor shortage shortened lead times (industry median ~12 weeks by end-2023) and shifted allocation tactics, increasing discounting to clear mismatched stock. As supply loosens and model cycles compress, overstock risk rises while global vehicle production recovered to ~90% of 2019 levels by 2023. Inchcape leverages data-led demand planning and omnichannel insights to align mix, accelerate turns and reduce carrying costs.
- Shorter lead times: ~12 weeks (end-2023)
- Production recovery: ~90% of 2019 (2023)
- Data-led mix + omnichannel = faster stock turns, lower carrying costs
Used car and residual value dynamics
Residual values directly shape leasing economics and total cost of ownership; Manheim reported roughly a 10% year‑on‑year decline in its U.S. Used Vehicle Value Index in 2024, pressuring trade‑in values and new‑car margins.
Certified pre‑owned programmes and extended warranties preserve brand equity, while Inchcape’s integrated remarketing and wholesale channels boost lifecycle profitability and recovery rates.
- Residual impact on leases
- ~10% Manheim 2024 YOY decline
- CPO and warranty = brand protection
- Integrated remarketing = higher recovery
Tariff swings and sanctions complicate global sourcing as US EV incentives reshape demand
Global GDP ~3.1% (IMF 2024) keeps auto demand sensitive to macro cycles; light‑vehicle volumes ~70m in 2024 with uneven regional recovery. Higher policy rates (US 5.25–5.50%, BOE 5.25%, ECB ~4.0% in 2024) lifted APRs ~7.5%, pressuring affordability; Manheim used‑value index fell ~10% YOY in 2024, squeezing trade‑ins and margins.
| Indicator | Value | Impact |
|---|---|---|
| Global GDP (IMF) | ~3.1% (2024) | Drives OEM/dealer demand |
| LV volumes | ~70m (2024) | Uneven recovery |
| Policy rates | US 5.25–5.50% (2024) | Higher APRs, lower affordability |
| Used values | Manheim −10% YOY (2024) | Reduces residuals, margins |
Same Document Delivered
Inchcape PESTLE Analysis
The Inchcape PESTLE Analysis preview shown here is the exact document you’ll receive after purchase—fully formatted and ready to use. The content, structure and layout are identical to the downloadable file, with no placeholders or teasers. After payment you’ll instantly get this same professional report.











