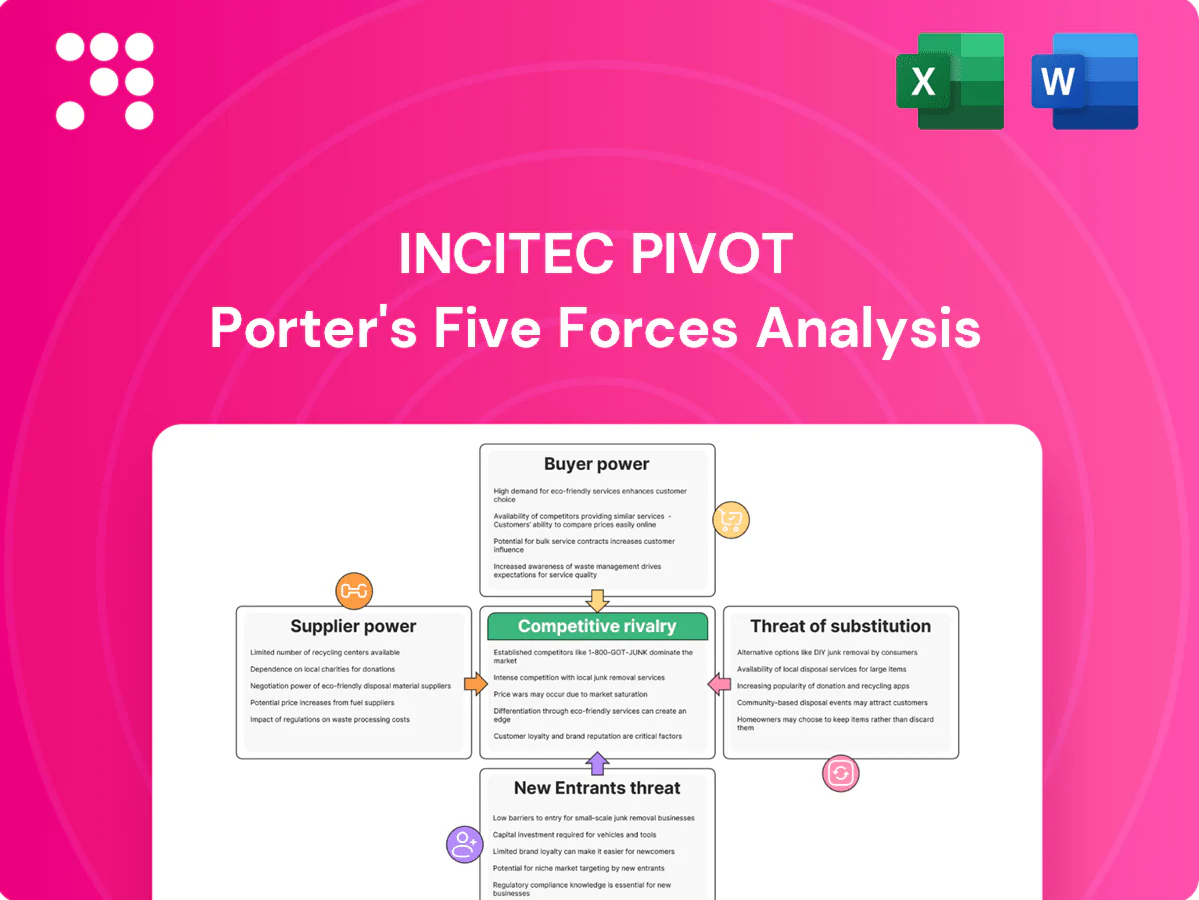
Incitec Pivot Porter's Five Forces Analysis

A Must-Have Tool for Decision-Makers
Incitec Pivot operates in a capital‑intensive, commodity‑driven fertiliser and explosives market where supplier power for raw chemicals, cyclical pricing, regulatory risk, and moderate buyer concentration shape competitive dynamics; threat of new entrants is low but substitutes and global supply shocks raise strategic vulnerability. This brief snapshot only scratches the surface—unlock the full Porter's Five Forces Analysis for force-by-force ratings, visuals and actionable strategy insights.
Suppliers Bargaining Power

Concentrated critical feedstocks
Incitec Pivot depends on a handful of suppliers for natural gas, ammonia, sulfur and phosphates, giving suppliers significant leverage in 2024. Concentrated and export-focused Australian gas markets remained volatile in 2024, driving input cost swings for fertilizers and AN. Long-term gas and feedstock contracts reduce volatility but can lock in elevated prices. Any supply disruption or price spike in 2024 directly compresses margins across both segments.
Specialty chemicals and catalysts
Specialty explosives and fertilizer production depend on proprietary catalysts, emulsifiers and additives from a few global vendors, giving suppliers outsized leverage. Qualification times of 6–18 months plus stringent safety certifications raise switching costs and lock in supply relationships. Suppliers with unique formulations routinely secure price and supply concessions, and this dependence can create bottlenecks during industry upcycles, as seen in 2024 supply tightness.

Hazmat logistics capacity
Transport of ammonia, AN and emulsions needs specialized hazmat carriers and compliant storage, concentrating capacity among few certified providers and giving freight operators significant bargaining power. Port and rail bottlenecks for oversized or restricted loads further raise handling and demurrage costs. As a result, supply chain reliability often trumps lowest-price bids for procurement decisions.

Energy price pass-through
Energy price pass-through: Gas and power are major cost drivers for IPL; pass-through is uneven, weakening in softer markets and shifting costs to the producer. Suppliers benefit from indexed pricing while IPL faces margin squeeze; hedging mitigates but cannot fully neutralize spikes — European TTF gas fell roughly 80% from 2022 peaks to 2024, exposing timing mismatches.
- Indexed supplier pricing increases supplier power
- Weakened pass-through shifts cost to IPL
- Hedging reduces but not eliminates spike risk
Geographic import exposure
For phosphates and potash IPL relies on imports from a small set of regions; in 2024 Australia imported ~100% of potash and ~90% of phosphate fertilizers, concentrating supplier influence. Geopolitical or trade-policy shifts (eg Russia/Belarus sanctions, Moroccan export policies) can tighten supply and raise landed costs. Currency moves have driven notable year-to-year volatility in IPL landed prices despite diversification efforts, which reduce but do not eliminate supplier leverage.
- 2024 import concentration: ~100% potash, ~90% phosphate
- Key source regions: Morocco, Canada, Russia/Belarus
- Risks: sanctions/trade policy, FX-driven landed-price volatility
- Mitigation: diversification lowers but does not remove supplier power
Fertiliser producer vulnerable to concentrated suppliers, long switching times and import reliance
Incitec Pivot faces high supplier power in 2024 from concentrated gas, feedstock and specialty-chemical vendors, with switching times of 6–18 months and exposed margins when pass-through weakens. Australian imports: ~100% potash, ~90% phosphate in 2024, while TTF gas fell ~80% from 2022 peaks to 2024. Logistics and certified hazmat carriers further concentrate leverage.
| Metric | 2024 |
|---|---|
| Potash import reliance | ~100% |
| Phosphate import reliance | ~90% |
| Gas price move (TTF) | -80% vs 2022 peak |
| Switching time | 6–18 months |
What is included in the product
 Detailed Word Document
Uncovers key drivers of competition, customer influence, and market entry risks tailored to Incitec Pivot, with a force-by-force analysis of suppliers, buyers, substitutes, new entrants and rivalry that highlights disruptive threats, pricing power and barriers to entry—fully editable for reports, investor materials and strategy decks.

 Customizable Excel Spreadsheet
One-sheet Porter's Five Forces for Incitec Pivot—quickly visualize supplier, buyer, substitute, entrant and rivalry pressures to speed strategic decisions. Customize pressure levels and export a clean radar chart or slide-ready layout for boardrooms and investor decks.
Customers Bargaining Power

Mining majors’ scale
Large miners such as BHP, Rio Tinto and Glencore secure explosives through multi-year tenders covering tens of thousands of tonnes, contributing to a global mining explosives market valued at about USD 6.6 billion in 2023, which concentrates buying power and drives strong price pressure. They require high service levels, reliability and innovation as table stakes, and contract re-bids often prompt aggressive discounting to retain volumes.
Switching costs with embedded service
Blast design software, on-site crews and integrated delivery systems create significant embedded switching costs for customers, bundling technical know-how and logistics that blunt simple price-based exits.
Lengthy safety and regulatory requalification for new suppliers—often taking months—further slows supplier changes and tempers buyer power despite strong tender leverage.
Performance-linked SLAs tied to uptime and safety metrics anchor relationships across commodity cycles by aligning incentives and raising the cost of switching.

Seasonal, price-sensitive farmers
Seasonal, price-sensitive farmers drive concentrated demand during planting windows, making volumes highly elastic; in 2024 over 60% of commercial fertilizer flows through distributors and co-ops that aggregate fragmented growers and press hard on price and terms.
Commodity transparency and benchmark pricing compress margins and reduce product differentiation, while access to credit, agronomy support and reliable logistics remain decisive purchase levers.

Performance and reliability premiums
Where blasting outcomes affect ore recovery and productivity, buyers pay for reliability; demonstrated fragmentation gains typically lift recovery 2–8% and can lower cost-per-ton 3–12%, allowing Incitec Pivot to offset price pressure. Data-driven KPIs and digital monitoring (real-time fragmentation, blasthole consistency) increase perceived value, shifting negotiations away from pure price.
- recovery:+2–8%
- cost-per-ton:-3–12%
- price-premium:≈5–10%
- KPIs:real-time fragmentation, blasthole CV
Alternative sourcing channels
Buyers can switch to imports and traders when domestic fertilizer prices diverge, increasing customer leverage over Incitec Pivot; in explosives, regional competitors and on-site emulsion suppliers offer alternative sourcing that weakens pricing power. The presence of substitutes raises negotiating leverage, though supply-security concerns often lead buyers to dual-source and accept higher blended costs to mitigate disruption risk.
- Buyers: alternative imports/traders
- Explosives: regional rivals, on-site emulsions
- Effect: higher buyer bargaining power
- Counter: dual-sourcing raises blended costs
Mining buyers drive explosives price pressure; SLAs can capture 5–10% premium
Large miners (BHP, Rio Tinto, Glencore) use multi-year tenders in a USD 6.6B 2023 explosives market, concentrating buying power and driving aggressive price pressure; performance SLAs and tech can secure a ~5–10% price premium. Over 60% of fertilizer flowed through distributors/co‑ops in 2024, raising buyer leverage during seasonal windows. High switching costs, safety requalification (months) and dual‑sourcing trade off price pressure versus supply security.
| Segment | Buyer Leverage | Key Metrics |
|---|---|---|
| Mining | High | USD 6.6B (2023); SLA premium 5–10% |
| Fertilizer | High seasonally | 60% via distributors (2024) |
What You See Is What You Get
Incitec Pivot Porter's Five Forces Analysis
This Incitec Pivot Porter's Five Forces Analysis preview is the exact, professionally formatted document you'll receive—no placeholders or mockups. It contains the full strategic assessment ready for immediate download and use the moment you complete your purchase. What you see here is the final deliverable, complete and unchanged, for your analysis and decision-making needs.

A Must-Have Tool for Decision-Makers
Incitec Pivot operates in a capital‑intensive, commodity‑driven fertiliser and explosives market where supplier power for raw chemicals, cyclical pricing, regulatory risk, and moderate buyer concentration shape competitive dynamics; threat of new entrants is low but substitutes and global supply shocks raise strategic vulnerability. This brief snapshot only scratches the surface—unlock the full Porter's Five Forces Analysis for force-by-force ratings, visuals and actionable strategy insights.
Suppliers Bargaining Power
Concentrated critical feedstocks
Incitec Pivot depends on a handful of suppliers for natural gas, ammonia, sulfur and phosphates, giving suppliers significant leverage in 2024. Concentrated and export-focused Australian gas markets remained volatile in 2024, driving input cost swings for fertilizers and AN. Long-term gas and feedstock contracts reduce volatility but can lock in elevated prices. Any supply disruption or price spike in 2024 directly compresses margins across both segments.
Specialty chemicals and catalysts
Specialty explosives and fertilizer production depend on proprietary catalysts, emulsifiers and additives from a few global vendors, giving suppliers outsized leverage. Qualification times of 6–18 months plus stringent safety certifications raise switching costs and lock in supply relationships. Suppliers with unique formulations routinely secure price and supply concessions, and this dependence can create bottlenecks during industry upcycles, as seen in 2024 supply tightness.
Hazmat logistics capacity
Transport of ammonia, AN and emulsions needs specialized hazmat carriers and compliant storage, concentrating capacity among few certified providers and giving freight operators significant bargaining power. Port and rail bottlenecks for oversized or restricted loads further raise handling and demurrage costs. As a result, supply chain reliability often trumps lowest-price bids for procurement decisions.
Energy price pass-through
Energy price pass-through: Gas and power are major cost drivers for IPL; pass-through is uneven, weakening in softer markets and shifting costs to the producer. Suppliers benefit from indexed pricing while IPL faces margin squeeze; hedging mitigates but cannot fully neutralize spikes — European TTF gas fell roughly 80% from 2022 peaks to 2024, exposing timing mismatches.
- Indexed supplier pricing increases supplier power
- Weakened pass-through shifts cost to IPL
- Hedging reduces but not eliminates spike risk
Geographic import exposure
For phosphates and potash IPL relies on imports from a small set of regions; in 2024 Australia imported ~100% of potash and ~90% of phosphate fertilizers, concentrating supplier influence. Geopolitical or trade-policy shifts (eg Russia/Belarus sanctions, Moroccan export policies) can tighten supply and raise landed costs. Currency moves have driven notable year-to-year volatility in IPL landed prices despite diversification efforts, which reduce but do not eliminate supplier leverage.
- 2024 import concentration: ~100% potash, ~90% phosphate
- Key source regions: Morocco, Canada, Russia/Belarus
- Risks: sanctions/trade policy, FX-driven landed-price volatility
- Mitigation: diversification lowers but does not remove supplier power
Fertiliser producer vulnerable to concentrated suppliers, long switching times and import reliance
Incitec Pivot faces high supplier power in 2024 from concentrated gas, feedstock and specialty-chemical vendors, with switching times of 6–18 months and exposed margins when pass-through weakens. Australian imports: ~100% potash, ~90% phosphate in 2024, while TTF gas fell ~80% from 2022 peaks to 2024. Logistics and certified hazmat carriers further concentrate leverage.
| Metric | 2024 |
|---|---|
| Potash import reliance | ~100% |
| Phosphate import reliance | ~90% |
| Gas price move (TTF) | -80% vs 2022 peak |
| Switching time | 6–18 months |
What is included in the product
Detailed Word Document
Uncovers key drivers of competition, customer influence, and market entry risks tailored to Incitec Pivot, with a force-by-force analysis of suppliers, buyers, substitutes, new entrants and rivalry that highlights disruptive threats, pricing power and barriers to entry—fully editable for reports, investor materials and strategy decks.
Customizable Excel Spreadsheet
One-sheet Porter's Five Forces for Incitec Pivot—quickly visualize supplier, buyer, substitute, entrant and rivalry pressures to speed strategic decisions. Customize pressure levels and export a clean radar chart or slide-ready layout for boardrooms and investor decks.
Customers Bargaining Power
Mining majors’ scale
Large miners such as BHP, Rio Tinto and Glencore secure explosives through multi-year tenders covering tens of thousands of tonnes, contributing to a global mining explosives market valued at about USD 6.6 billion in 2023, which concentrates buying power and drives strong price pressure. They require high service levels, reliability and innovation as table stakes, and contract re-bids often prompt aggressive discounting to retain volumes.
Switching costs with embedded service
Blast design software, on-site crews and integrated delivery systems create significant embedded switching costs for customers, bundling technical know-how and logistics that blunt simple price-based exits.
Lengthy safety and regulatory requalification for new suppliers—often taking months—further slows supplier changes and tempers buyer power despite strong tender leverage.
Performance-linked SLAs tied to uptime and safety metrics anchor relationships across commodity cycles by aligning incentives and raising the cost of switching.
Seasonal, price-sensitive farmers
Seasonal, price-sensitive farmers drive concentrated demand during planting windows, making volumes highly elastic; in 2024 over 60% of commercial fertilizer flows through distributors and co-ops that aggregate fragmented growers and press hard on price and terms.
Commodity transparency and benchmark pricing compress margins and reduce product differentiation, while access to credit, agronomy support and reliable logistics remain decisive purchase levers.
Performance and reliability premiums
Where blasting outcomes affect ore recovery and productivity, buyers pay for reliability; demonstrated fragmentation gains typically lift recovery 2–8% and can lower cost-per-ton 3–12%, allowing Incitec Pivot to offset price pressure. Data-driven KPIs and digital monitoring (real-time fragmentation, blasthole consistency) increase perceived value, shifting negotiations away from pure price.
- recovery:+2–8%
- cost-per-ton:-3–12%
- price-premium:≈5–10%
- KPIs:real-time fragmentation, blasthole CV
Alternative sourcing channels
Buyers can switch to imports and traders when domestic fertilizer prices diverge, increasing customer leverage over Incitec Pivot; in explosives, regional competitors and on-site emulsion suppliers offer alternative sourcing that weakens pricing power. The presence of substitutes raises negotiating leverage, though supply-security concerns often lead buyers to dual-source and accept higher blended costs to mitigate disruption risk.
- Buyers: alternative imports/traders
- Explosives: regional rivals, on-site emulsions
- Effect: higher buyer bargaining power
- Counter: dual-sourcing raises blended costs
Mining buyers drive explosives price pressure; SLAs can capture 5–10% premium
Large miners (BHP, Rio Tinto, Glencore) use multi-year tenders in a USD 6.6B 2023 explosives market, concentrating buying power and driving aggressive price pressure; performance SLAs and tech can secure a ~5–10% price premium. Over 60% of fertilizer flowed through distributors/co‑ops in 2024, raising buyer leverage during seasonal windows. High switching costs, safety requalification (months) and dual‑sourcing trade off price pressure versus supply security.
| Segment | Buyer Leverage | Key Metrics |
|---|---|---|
| Mining | High | USD 6.6B (2023); SLA premium 5–10% |
| Fertilizer | High seasonally | 60% via distributors (2024) |
What You See Is What You Get
Incitec Pivot Porter's Five Forces Analysis
This Incitec Pivot Porter's Five Forces Analysis preview is the exact, professionally formatted document you'll receive—no placeholders or mockups. It contains the full strategic assessment ready for immediate download and use the moment you complete your purchase. What you see here is the final deliverable, complete and unchanged, for your analysis and decision-making needs.
Original: $10.00
-65%$10.00
$3.50Description
A Must-Have Tool for Decision-Makers
Incitec Pivot operates in a capital‑intensive, commodity‑driven fertiliser and explosives market where supplier power for raw chemicals, cyclical pricing, regulatory risk, and moderate buyer concentration shape competitive dynamics; threat of new entrants is low but substitutes and global supply shocks raise strategic vulnerability. This brief snapshot only scratches the surface—unlock the full Porter's Five Forces Analysis for force-by-force ratings, visuals and actionable strategy insights.
Suppliers Bargaining Power
Concentrated critical feedstocks
Incitec Pivot depends on a handful of suppliers for natural gas, ammonia, sulfur and phosphates, giving suppliers significant leverage in 2024. Concentrated and export-focused Australian gas markets remained volatile in 2024, driving input cost swings for fertilizers and AN. Long-term gas and feedstock contracts reduce volatility but can lock in elevated prices. Any supply disruption or price spike in 2024 directly compresses margins across both segments.
Specialty chemicals and catalysts
Specialty explosives and fertilizer production depend on proprietary catalysts, emulsifiers and additives from a few global vendors, giving suppliers outsized leverage. Qualification times of 6–18 months plus stringent safety certifications raise switching costs and lock in supply relationships. Suppliers with unique formulations routinely secure price and supply concessions, and this dependence can create bottlenecks during industry upcycles, as seen in 2024 supply tightness.
Hazmat logistics capacity
Transport of ammonia, AN and emulsions needs specialized hazmat carriers and compliant storage, concentrating capacity among few certified providers and giving freight operators significant bargaining power. Port and rail bottlenecks for oversized or restricted loads further raise handling and demurrage costs. As a result, supply chain reliability often trumps lowest-price bids for procurement decisions.
Energy price pass-through
Energy price pass-through: Gas and power are major cost drivers for IPL; pass-through is uneven, weakening in softer markets and shifting costs to the producer. Suppliers benefit from indexed pricing while IPL faces margin squeeze; hedging mitigates but cannot fully neutralize spikes — European TTF gas fell roughly 80% from 2022 peaks to 2024, exposing timing mismatches.
- Indexed supplier pricing increases supplier power
- Weakened pass-through shifts cost to IPL
- Hedging reduces but not eliminates spike risk
Geographic import exposure
For phosphates and potash IPL relies on imports from a small set of regions; in 2024 Australia imported ~100% of potash and ~90% of phosphate fertilizers, concentrating supplier influence. Geopolitical or trade-policy shifts (eg Russia/Belarus sanctions, Moroccan export policies) can tighten supply and raise landed costs. Currency moves have driven notable year-to-year volatility in IPL landed prices despite diversification efforts, which reduce but do not eliminate supplier leverage.
- 2024 import concentration: ~100% potash, ~90% phosphate
- Key source regions: Morocco, Canada, Russia/Belarus
- Risks: sanctions/trade policy, FX-driven landed-price volatility
- Mitigation: diversification lowers but does not remove supplier power
Fertiliser producer vulnerable to concentrated suppliers, long switching times and import reliance
Incitec Pivot faces high supplier power in 2024 from concentrated gas, feedstock and specialty-chemical vendors, with switching times of 6–18 months and exposed margins when pass-through weakens. Australian imports: ~100% potash, ~90% phosphate in 2024, while TTF gas fell ~80% from 2022 peaks to 2024. Logistics and certified hazmat carriers further concentrate leverage.
| Metric | 2024 |
|---|---|
| Potash import reliance | ~100% |
| Phosphate import reliance | ~90% |
| Gas price move (TTF) | -80% vs 2022 peak |
| Switching time | 6–18 months |
What is included in the product
Detailed Word Document
Uncovers key drivers of competition, customer influence, and market entry risks tailored to Incitec Pivot, with a force-by-force analysis of suppliers, buyers, substitutes, new entrants and rivalry that highlights disruptive threats, pricing power and barriers to entry—fully editable for reports, investor materials and strategy decks.
Customizable Excel Spreadsheet
One-sheet Porter's Five Forces for Incitec Pivot—quickly visualize supplier, buyer, substitute, entrant and rivalry pressures to speed strategic decisions. Customize pressure levels and export a clean radar chart or slide-ready layout for boardrooms and investor decks.
Customers Bargaining Power
Mining majors’ scale
Large miners such as BHP, Rio Tinto and Glencore secure explosives through multi-year tenders covering tens of thousands of tonnes, contributing to a global mining explosives market valued at about USD 6.6 billion in 2023, which concentrates buying power and drives strong price pressure. They require high service levels, reliability and innovation as table stakes, and contract re-bids often prompt aggressive discounting to retain volumes.
Switching costs with embedded service
Blast design software, on-site crews and integrated delivery systems create significant embedded switching costs for customers, bundling technical know-how and logistics that blunt simple price-based exits.
Lengthy safety and regulatory requalification for new suppliers—often taking months—further slows supplier changes and tempers buyer power despite strong tender leverage.
Performance-linked SLAs tied to uptime and safety metrics anchor relationships across commodity cycles by aligning incentives and raising the cost of switching.
Seasonal, price-sensitive farmers
Seasonal, price-sensitive farmers drive concentrated demand during planting windows, making volumes highly elastic; in 2024 over 60% of commercial fertilizer flows through distributors and co-ops that aggregate fragmented growers and press hard on price and terms.
Commodity transparency and benchmark pricing compress margins and reduce product differentiation, while access to credit, agronomy support and reliable logistics remain decisive purchase levers.
Performance and reliability premiums
Where blasting outcomes affect ore recovery and productivity, buyers pay for reliability; demonstrated fragmentation gains typically lift recovery 2–8% and can lower cost-per-ton 3–12%, allowing Incitec Pivot to offset price pressure. Data-driven KPIs and digital monitoring (real-time fragmentation, blasthole consistency) increase perceived value, shifting negotiations away from pure price.
- recovery:+2–8%
- cost-per-ton:-3–12%
- price-premium:≈5–10%
- KPIs:real-time fragmentation, blasthole CV
Alternative sourcing channels
Buyers can switch to imports and traders when domestic fertilizer prices diverge, increasing customer leverage over Incitec Pivot; in explosives, regional competitors and on-site emulsion suppliers offer alternative sourcing that weakens pricing power. The presence of substitutes raises negotiating leverage, though supply-security concerns often lead buyers to dual-source and accept higher blended costs to mitigate disruption risk.
- Buyers: alternative imports/traders
- Explosives: regional rivals, on-site emulsions
- Effect: higher buyer bargaining power
- Counter: dual-sourcing raises blended costs
Mining buyers drive explosives price pressure; SLAs can capture 5–10% premium
Large miners (BHP, Rio Tinto, Glencore) use multi-year tenders in a USD 6.6B 2023 explosives market, concentrating buying power and driving aggressive price pressure; performance SLAs and tech can secure a ~5–10% price premium. Over 60% of fertilizer flowed through distributors/co‑ops in 2024, raising buyer leverage during seasonal windows. High switching costs, safety requalification (months) and dual‑sourcing trade off price pressure versus supply security.
| Segment | Buyer Leverage | Key Metrics |
|---|---|---|
| Mining | High | USD 6.6B (2023); SLA premium 5–10% |
| Fertilizer | High seasonally | 60% via distributors (2024) |
What You See Is What You Get
Incitec Pivot Porter's Five Forces Analysis
This Incitec Pivot Porter's Five Forces Analysis preview is the exact, professionally formatted document you'll receive—no placeholders or mockups. It contains the full strategic assessment ready for immediate download and use the moment you complete your purchase. What you see here is the final deliverable, complete and unchanged, for your analysis and decision-making needs.











