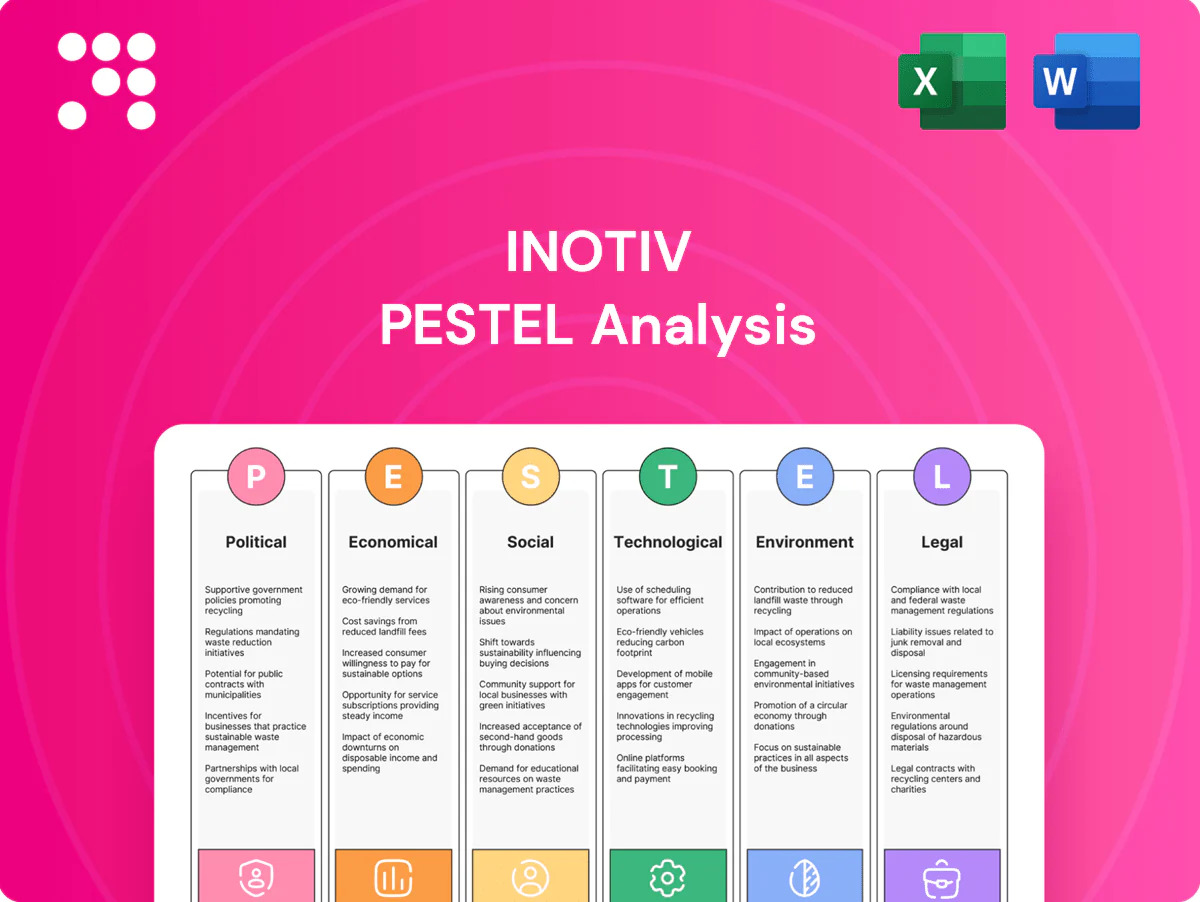
Inotiv PESTLE Analysis

Your Competitive Advantage Starts with This Report
Discover how political shifts, economic pressures, and technological trends are reshaping Inotiv’s strategic outlook in our concise PESTLE Analysis. This ready-to-use report delivers actionable insights for investors, advisors, and strategists—perfect for boardrooms and pitch decks. Buy the full version now to access the complete, editable breakdown and make smarter decisions with confidence.
Political factors

Government R&D funding cycles
NIH funding (~$49B) and BARDA allocations (~$1.6B) materially drive CRO demand for nonclinical and bioanalytical work; shifts to pandemic readiness, oncology or rare-disease priorities can reallocate millions rapidly. Post-election policy shifts and continuing resolutions have historically delayed awards and contract starts by months, compressing revenue timing. Inotiv should diversify its client mix across government, biopharma and biotech to buffer this political budget volatility.
Animal research policy and public pressure
Political momentum for stricter animal welfare standards is reshaping research model availability and protocols, with the EU reporting 9.4 million animals used in scientific procedures in 2020, intensifying calls for alternatives. Legislative initiatives increasingly mandate non-animal methods or greater oversight, and public hearings heighten agency enforcement intensity. Proactive compliance and advocacy preserve Inotiv’s operating flexibility and access to regulated markets.

Trade policy and cross-border logistics
Tariffs, import permits and customs rules directly shape flows of research models, reagents and specialized equipment for Inotiv, raising costs and clearance times; in 2023–24 the US tightened export controls on certain lab equipment and biological agents to China, further constraining cross‑border shipments. Geopolitical tensions can lengthen lead times or block strains/biologics, while government biosecurity measures increase documentation burdens; building regional supply redundancy mitigates these shocks.

Public procurement and grants to clients
Government agencies such as NIH (FY2024 ~49.5 billion USD) and DoD sponsor nonclinical programs that flow to CROs via prime contractors or direct awards; shifts toward in-country testing and expanded Buy American rules can reallocate volume to domestic CROs. Transparent, auditable cost structures increase competitiveness in tenders. Partnerships with academic labs align with policy goals and grant requirements.
- Prime/direct awards
- Buy American → domestic volume
- Transparent costing wins tenders
- Academic partnerships meet policy
Health policy and drug approval priorities
Health policy shifts—fast-track and orphan incentives—steer sponsor pipelines toward niche indications, with orphan/priority pathways accounting for ≈45% of novel FDA approvals in 2024, boosting demand for specialized toxicology and DMPK services.
Emphasis on pandemic preparedness and AMR in 2024–25 expands IND-enabling work, while pricing-reform pressures can compress sponsor R&D budgets; tracking regulator guidance calendars helps forecast service mix.
- Regulatory signal: orphan/priority ≈45% (2024)
- Service impact: higher DMPK/toxicology demand
- Risk: pricing reform → budget compression
- Action: monitor guidance agendas
NIH/BARDA funding fuels CRO nonclinical demand; orphan approvals and export controls reshape supply
NIH FY2024 funding (~49.5B) and BARDA allocations (~1.6B) drive CRO nonclinical demand; shifts in priorities (pandemic, oncology, rare) reallocate millions quickly. Orphan/priority approvals ≈45% of 2024 novel FDA approvals, raising DMPK/tox demand. EU reported 9.4M animals used in 2020 amid stricter welfare laws; 2023–24 US export controls tightened cross‑border lab shipments.
| Driver | 2024/25 Metric | Impact |
|---|---|---|
| NIH/BARDA | $49.5B / $1.6B | Revenue timing, bid wins |
| Orphan/priority | ≈45% approvals | Higher specialized services |
| Animal welfare | 9.4M (EU 2020) | Protocol shifts, alt methods |
| Export controls | 2023–24 US actions | Supply delays, regionalize |
What is included in the product
 Detailed Word Document
Explores how macro-environmental factors uniquely affect Inotiv across Political, Economic, Social, Technological, Environmental and Legal dimensions, with each section backed by relevant data and current trends. Designed for executives and investors, the analysis includes forward-looking insights, detailed sub-points, and clean formatting ready for reports, decks, or scenario planning.

 Customizable Excel Spreadsheet
Inotiv PESTLE Analysis condenses complex external factors into a clear, segmented summary for quick reference in meetings or presentations, easily shareable and editable to align teams and support risk discussions during planning.
Economic factors

Biotech funding cycle sensitivity
Venture funding and IPO windows dictate early-stage outsourcing demand; biotech VC funding slid roughly 40% from 2021 peaks through 2023–24, compressing deals and deferring IND packages. Downturns cut discretionary studies and stretch payment terms as capital tightens, while upswings stress lab and CRO capacity. Inotiv’s balanced exposure to large pharma clients helps smooth revenue volatility.
Capacity utilization and pricing power
High facility utilization elevates margins and improves product mix for Inotiv, while slack capacity erodes pricing power; scheduling efficiency and cross-site load balancing preserve throughput across preclinical and discovery platforms. Clear lead-time visibility enables selective pricing premiums for expedited studies. Flexible staffing models align fixed costs with volume, protecting margins during demand swings.

Input cost inflation and labor market
Skilled scientists, veterinarians and QA staff are driving wage inflation, with life‑sciences compensation rising roughly 6% annually in 2023–24 while US CPI averaged about 3.4% in 2024 (BLS), pressuring labor cost per study.
Inflation in consumables, vivarium supplies and energy—many suppliers reported price increases in the mid‑single digits to low‑teens—compresses gross margins for preclinical services.
Long‑term supplier contracts and lab automation (often cutting unit labor/input costs by ~10–20% in case studies) plus pricing escalators in MSAs (commonly 2–4% annual) help preserve unit economics.

Foreign exchange and global clients
Multi-currency contracts create FX risk for Inotiv when sourcing and billing currencies differ, with the US dollar strengthening ~5% in 2024 versus major currencies, pressuring ex-US client demand and cross-border margins. Natural hedging from matched costs and revenues across geographies reduces net exposure, while formal hedging policies and forwards have helped stabilize quarterly earnings volatility. Management notes FX remains a material monitor in 2025 planning.
- FX exposure: multi-currency contracts
- USD strength (~5% in 2024) dampens ex-US demand
- Natural hedging via matched costs/revenues
- Hedging policies provide earnings stability
Industry consolidation and M&A
Pharma consolidation and vendor rationalization favor scaled CROs by concentrating spend, but raise compliance and audit thresholds; the global CRO market was about 62 billion USD in 2023 and is forecast to grow at ~8% CAGR to 2028, intensifying M&A-driven scale plays. CRO M&A enables cross-sell and inorganic access to specialized models or bioanalytical platforms, accelerating revenue growth while creating integration and client-retention risks that disciplined integration mitigates.
- Vendor rationalization benefits scaled CROs; compliance bar rises
- CRO market ~62B USD (2023); ~8% CAGR to 2028
- M&A => cross-sell, specialized platforms, faster growth
- Integration risk; disciplined integration preserves retention
NIH/BARDA funding fuels CRO nonclinical demand; orphan approvals and export controls reshape supply
Biotech VC fell ~40% from 2021 peaks through 2023–24, reducing early-stage CRO demand; Inotiv’s large-pharma mix cushions volatility. Wage inflation ~6% (2023–24) and 2024 US CPI 3.4% press labor costs; consumables rose mid-single to low‑teens. CRO market ~$62B (2023), ~8% CAGR to 2028; USD up ~5% in 2024 adds FX pressure.
| Metric | Value |
|---|---|
| Biotech VC change | -40% (2021–24) |
| CRO market | $62B (2023), ~8% CAGR to 2028 |
| Wage inflation | ~6% (2023–24) |
| US CPI | 3.4% (2024) |
| USD vs majors | +~5% (2024) |
Preview the Actual Deliverable
Inotiv PESTLE Analysis
The preview shown here is the exact Inotiv PESTLE Analysis document you’ll receive after purchase—fully formatted and ready to use. The content, layout, and structure visible are the final version you’ll download immediately after payment. No placeholders or teasers—this is the real, professionally structured file.

Your Competitive Advantage Starts with This Report
Discover how political shifts, economic pressures, and technological trends are reshaping Inotiv’s strategic outlook in our concise PESTLE Analysis. This ready-to-use report delivers actionable insights for investors, advisors, and strategists—perfect for boardrooms and pitch decks. Buy the full version now to access the complete, editable breakdown and make smarter decisions with confidence.
Political factors
Government R&D funding cycles
NIH funding (~$49B) and BARDA allocations (~$1.6B) materially drive CRO demand for nonclinical and bioanalytical work; shifts to pandemic readiness, oncology or rare-disease priorities can reallocate millions rapidly. Post-election policy shifts and continuing resolutions have historically delayed awards and contract starts by months, compressing revenue timing. Inotiv should diversify its client mix across government, biopharma and biotech to buffer this political budget volatility.
Animal research policy and public pressure
Political momentum for stricter animal welfare standards is reshaping research model availability and protocols, with the EU reporting 9.4 million animals used in scientific procedures in 2020, intensifying calls for alternatives. Legislative initiatives increasingly mandate non-animal methods or greater oversight, and public hearings heighten agency enforcement intensity. Proactive compliance and advocacy preserve Inotiv’s operating flexibility and access to regulated markets.
Trade policy and cross-border logistics
Tariffs, import permits and customs rules directly shape flows of research models, reagents and specialized equipment for Inotiv, raising costs and clearance times; in 2023–24 the US tightened export controls on certain lab equipment and biological agents to China, further constraining cross‑border shipments. Geopolitical tensions can lengthen lead times or block strains/biologics, while government biosecurity measures increase documentation burdens; building regional supply redundancy mitigates these shocks.
Public procurement and grants to clients
Government agencies such as NIH (FY2024 ~49.5 billion USD) and DoD sponsor nonclinical programs that flow to CROs via prime contractors or direct awards; shifts toward in-country testing and expanded Buy American rules can reallocate volume to domestic CROs. Transparent, auditable cost structures increase competitiveness in tenders. Partnerships with academic labs align with policy goals and grant requirements.
- Prime/direct awards
- Buy American → domestic volume
- Transparent costing wins tenders
- Academic partnerships meet policy
Health policy and drug approval priorities
Health policy shifts—fast-track and orphan incentives—steer sponsor pipelines toward niche indications, with orphan/priority pathways accounting for ≈45% of novel FDA approvals in 2024, boosting demand for specialized toxicology and DMPK services.
Emphasis on pandemic preparedness and AMR in 2024–25 expands IND-enabling work, while pricing-reform pressures can compress sponsor R&D budgets; tracking regulator guidance calendars helps forecast service mix.
- Regulatory signal: orphan/priority ≈45% (2024)
- Service impact: higher DMPK/toxicology demand
- Risk: pricing reform → budget compression
- Action: monitor guidance agendas
NIH/BARDA funding fuels CRO nonclinical demand; orphan approvals and export controls reshape supply
NIH FY2024 funding (~49.5B) and BARDA allocations (~1.6B) drive CRO nonclinical demand; shifts in priorities (pandemic, oncology, rare) reallocate millions quickly. Orphan/priority approvals ≈45% of 2024 novel FDA approvals, raising DMPK/tox demand. EU reported 9.4M animals used in 2020 amid stricter welfare laws; 2023–24 US export controls tightened cross‑border lab shipments.
| Driver | 2024/25 Metric | Impact |
|---|---|---|
| NIH/BARDA | $49.5B / $1.6B | Revenue timing, bid wins |
| Orphan/priority | ≈45% approvals | Higher specialized services |
| Animal welfare | 9.4M (EU 2020) | Protocol shifts, alt methods |
| Export controls | 2023–24 US actions | Supply delays, regionalize |
What is included in the product
Detailed Word Document
Explores how macro-environmental factors uniquely affect Inotiv across Political, Economic, Social, Technological, Environmental and Legal dimensions, with each section backed by relevant data and current trends. Designed for executives and investors, the analysis includes forward-looking insights, detailed sub-points, and clean formatting ready for reports, decks, or scenario planning.
Customizable Excel Spreadsheet
Inotiv PESTLE Analysis condenses complex external factors into a clear, segmented summary for quick reference in meetings or presentations, easily shareable and editable to align teams and support risk discussions during planning.
Economic factors
Biotech funding cycle sensitivity
Venture funding and IPO windows dictate early-stage outsourcing demand; biotech VC funding slid roughly 40% from 2021 peaks through 2023–24, compressing deals and deferring IND packages. Downturns cut discretionary studies and stretch payment terms as capital tightens, while upswings stress lab and CRO capacity. Inotiv’s balanced exposure to large pharma clients helps smooth revenue volatility.
Capacity utilization and pricing power
High facility utilization elevates margins and improves product mix for Inotiv, while slack capacity erodes pricing power; scheduling efficiency and cross-site load balancing preserve throughput across preclinical and discovery platforms. Clear lead-time visibility enables selective pricing premiums for expedited studies. Flexible staffing models align fixed costs with volume, protecting margins during demand swings.
Input cost inflation and labor market
Skilled scientists, veterinarians and QA staff are driving wage inflation, with life‑sciences compensation rising roughly 6% annually in 2023–24 while US CPI averaged about 3.4% in 2024 (BLS), pressuring labor cost per study.
Inflation in consumables, vivarium supplies and energy—many suppliers reported price increases in the mid‑single digits to low‑teens—compresses gross margins for preclinical services.
Long‑term supplier contracts and lab automation (often cutting unit labor/input costs by ~10–20% in case studies) plus pricing escalators in MSAs (commonly 2–4% annual) help preserve unit economics.
Foreign exchange and global clients
Multi-currency contracts create FX risk for Inotiv when sourcing and billing currencies differ, with the US dollar strengthening ~5% in 2024 versus major currencies, pressuring ex-US client demand and cross-border margins. Natural hedging from matched costs and revenues across geographies reduces net exposure, while formal hedging policies and forwards have helped stabilize quarterly earnings volatility. Management notes FX remains a material monitor in 2025 planning.
- FX exposure: multi-currency contracts
- USD strength (~5% in 2024) dampens ex-US demand
- Natural hedging via matched costs/revenues
- Hedging policies provide earnings stability
Industry consolidation and M&A
Pharma consolidation and vendor rationalization favor scaled CROs by concentrating spend, but raise compliance and audit thresholds; the global CRO market was about 62 billion USD in 2023 and is forecast to grow at ~8% CAGR to 2028, intensifying M&A-driven scale plays. CRO M&A enables cross-sell and inorganic access to specialized models or bioanalytical platforms, accelerating revenue growth while creating integration and client-retention risks that disciplined integration mitigates.
- Vendor rationalization benefits scaled CROs; compliance bar rises
- CRO market ~62B USD (2023); ~8% CAGR to 2028
- M&A => cross-sell, specialized platforms, faster growth
- Integration risk; disciplined integration preserves retention
NIH/BARDA funding fuels CRO nonclinical demand; orphan approvals and export controls reshape supply
Biotech VC fell ~40% from 2021 peaks through 2023–24, reducing early-stage CRO demand; Inotiv’s large-pharma mix cushions volatility. Wage inflation ~6% (2023–24) and 2024 US CPI 3.4% press labor costs; consumables rose mid-single to low‑teens. CRO market ~$62B (2023), ~8% CAGR to 2028; USD up ~5% in 2024 adds FX pressure.
| Metric | Value |
|---|---|
| Biotech VC change | -40% (2021–24) |
| CRO market | $62B (2023), ~8% CAGR to 2028 |
| Wage inflation | ~6% (2023–24) |
| US CPI | 3.4% (2024) |
| USD vs majors | +~5% (2024) |
Preview the Actual Deliverable
Inotiv PESTLE Analysis
The preview shown here is the exact Inotiv PESTLE Analysis document you’ll receive after purchase—fully formatted and ready to use. The content, layout, and structure visible are the final version you’ll download immediately after payment. No placeholders or teasers—this is the real, professionally structured file.
Original: $10.00
-65%$10.00
$3.50Description
Your Competitive Advantage Starts with This Report
Discover how political shifts, economic pressures, and technological trends are reshaping Inotiv’s strategic outlook in our concise PESTLE Analysis. This ready-to-use report delivers actionable insights for investors, advisors, and strategists—perfect for boardrooms and pitch decks. Buy the full version now to access the complete, editable breakdown and make smarter decisions with confidence.
Political factors
Government R&D funding cycles
NIH funding (~$49B) and BARDA allocations (~$1.6B) materially drive CRO demand for nonclinical and bioanalytical work; shifts to pandemic readiness, oncology or rare-disease priorities can reallocate millions rapidly. Post-election policy shifts and continuing resolutions have historically delayed awards and contract starts by months, compressing revenue timing. Inotiv should diversify its client mix across government, biopharma and biotech to buffer this political budget volatility.
Animal research policy and public pressure
Political momentum for stricter animal welfare standards is reshaping research model availability and protocols, with the EU reporting 9.4 million animals used in scientific procedures in 2020, intensifying calls for alternatives. Legislative initiatives increasingly mandate non-animal methods or greater oversight, and public hearings heighten agency enforcement intensity. Proactive compliance and advocacy preserve Inotiv’s operating flexibility and access to regulated markets.
Trade policy and cross-border logistics
Tariffs, import permits and customs rules directly shape flows of research models, reagents and specialized equipment for Inotiv, raising costs and clearance times; in 2023–24 the US tightened export controls on certain lab equipment and biological agents to China, further constraining cross‑border shipments. Geopolitical tensions can lengthen lead times or block strains/biologics, while government biosecurity measures increase documentation burdens; building regional supply redundancy mitigates these shocks.
Public procurement and grants to clients
Government agencies such as NIH (FY2024 ~49.5 billion USD) and DoD sponsor nonclinical programs that flow to CROs via prime contractors or direct awards; shifts toward in-country testing and expanded Buy American rules can reallocate volume to domestic CROs. Transparent, auditable cost structures increase competitiveness in tenders. Partnerships with academic labs align with policy goals and grant requirements.
- Prime/direct awards
- Buy American → domestic volume
- Transparent costing wins tenders
- Academic partnerships meet policy
Health policy and drug approval priorities
Health policy shifts—fast-track and orphan incentives—steer sponsor pipelines toward niche indications, with orphan/priority pathways accounting for ≈45% of novel FDA approvals in 2024, boosting demand for specialized toxicology and DMPK services.
Emphasis on pandemic preparedness and AMR in 2024–25 expands IND-enabling work, while pricing-reform pressures can compress sponsor R&D budgets; tracking regulator guidance calendars helps forecast service mix.
- Regulatory signal: orphan/priority ≈45% (2024)
- Service impact: higher DMPK/toxicology demand
- Risk: pricing reform → budget compression
- Action: monitor guidance agendas
NIH/BARDA funding fuels CRO nonclinical demand; orphan approvals and export controls reshape supply
NIH FY2024 funding (~49.5B) and BARDA allocations (~1.6B) drive CRO nonclinical demand; shifts in priorities (pandemic, oncology, rare) reallocate millions quickly. Orphan/priority approvals ≈45% of 2024 novel FDA approvals, raising DMPK/tox demand. EU reported 9.4M animals used in 2020 amid stricter welfare laws; 2023–24 US export controls tightened cross‑border lab shipments.
| Driver | 2024/25 Metric | Impact |
|---|---|---|
| NIH/BARDA | $49.5B / $1.6B | Revenue timing, bid wins |
| Orphan/priority | ≈45% approvals | Higher specialized services |
| Animal welfare | 9.4M (EU 2020) | Protocol shifts, alt methods |
| Export controls | 2023–24 US actions | Supply delays, regionalize |
What is included in the product
Detailed Word Document
Explores how macro-environmental factors uniquely affect Inotiv across Political, Economic, Social, Technological, Environmental and Legal dimensions, with each section backed by relevant data and current trends. Designed for executives and investors, the analysis includes forward-looking insights, detailed sub-points, and clean formatting ready for reports, decks, or scenario planning.
Customizable Excel Spreadsheet
Inotiv PESTLE Analysis condenses complex external factors into a clear, segmented summary for quick reference in meetings or presentations, easily shareable and editable to align teams and support risk discussions during planning.
Economic factors
Biotech funding cycle sensitivity
Venture funding and IPO windows dictate early-stage outsourcing demand; biotech VC funding slid roughly 40% from 2021 peaks through 2023–24, compressing deals and deferring IND packages. Downturns cut discretionary studies and stretch payment terms as capital tightens, while upswings stress lab and CRO capacity. Inotiv’s balanced exposure to large pharma clients helps smooth revenue volatility.
Capacity utilization and pricing power
High facility utilization elevates margins and improves product mix for Inotiv, while slack capacity erodes pricing power; scheduling efficiency and cross-site load balancing preserve throughput across preclinical and discovery platforms. Clear lead-time visibility enables selective pricing premiums for expedited studies. Flexible staffing models align fixed costs with volume, protecting margins during demand swings.
Input cost inflation and labor market
Skilled scientists, veterinarians and QA staff are driving wage inflation, with life‑sciences compensation rising roughly 6% annually in 2023–24 while US CPI averaged about 3.4% in 2024 (BLS), pressuring labor cost per study.
Inflation in consumables, vivarium supplies and energy—many suppliers reported price increases in the mid‑single digits to low‑teens—compresses gross margins for preclinical services.
Long‑term supplier contracts and lab automation (often cutting unit labor/input costs by ~10–20% in case studies) plus pricing escalators in MSAs (commonly 2–4% annual) help preserve unit economics.
Foreign exchange and global clients
Multi-currency contracts create FX risk for Inotiv when sourcing and billing currencies differ, with the US dollar strengthening ~5% in 2024 versus major currencies, pressuring ex-US client demand and cross-border margins. Natural hedging from matched costs and revenues across geographies reduces net exposure, while formal hedging policies and forwards have helped stabilize quarterly earnings volatility. Management notes FX remains a material monitor in 2025 planning.
- FX exposure: multi-currency contracts
- USD strength (~5% in 2024) dampens ex-US demand
- Natural hedging via matched costs/revenues
- Hedging policies provide earnings stability
Industry consolidation and M&A
Pharma consolidation and vendor rationalization favor scaled CROs by concentrating spend, but raise compliance and audit thresholds; the global CRO market was about 62 billion USD in 2023 and is forecast to grow at ~8% CAGR to 2028, intensifying M&A-driven scale plays. CRO M&A enables cross-sell and inorganic access to specialized models or bioanalytical platforms, accelerating revenue growth while creating integration and client-retention risks that disciplined integration mitigates.
- Vendor rationalization benefits scaled CROs; compliance bar rises
- CRO market ~62B USD (2023); ~8% CAGR to 2028
- M&A => cross-sell, specialized platforms, faster growth
- Integration risk; disciplined integration preserves retention
NIH/BARDA funding fuels CRO nonclinical demand; orphan approvals and export controls reshape supply
Biotech VC fell ~40% from 2021 peaks through 2023–24, reducing early-stage CRO demand; Inotiv’s large-pharma mix cushions volatility. Wage inflation ~6% (2023–24) and 2024 US CPI 3.4% press labor costs; consumables rose mid-single to low‑teens. CRO market ~$62B (2023), ~8% CAGR to 2028; USD up ~5% in 2024 adds FX pressure.
| Metric | Value |
|---|---|
| Biotech VC change | -40% (2021–24) |
| CRO market | $62B (2023), ~8% CAGR to 2028 |
| Wage inflation | ~6% (2023–24) |
| US CPI | 3.4% (2024) |
| USD vs majors | +~5% (2024) |
Preview the Actual Deliverable
Inotiv PESTLE Analysis
The preview shown here is the exact Inotiv PESTLE Analysis document you’ll receive after purchase—fully formatted and ready to use. The content, layout, and structure visible are the final version you’ll download immediately after payment. No placeholders or teasers—this is the real, professionally structured file.











