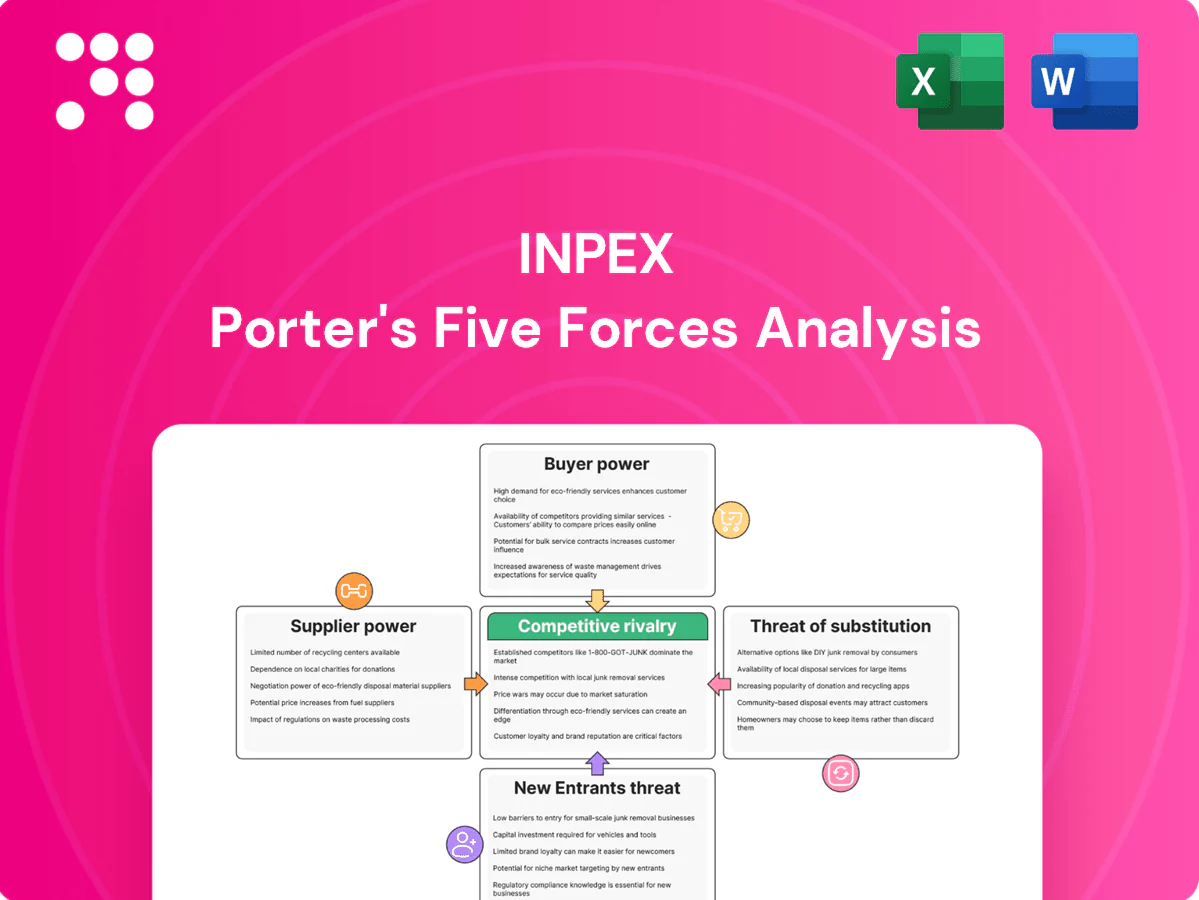
Inpex Porter's Five Forces Analysis

From Overview to Strategy Blueprint
Inpex faces a complex mix of supplier leverage, capital intensity, and evolving energy demand that shapes its competitive landscape; this snapshot highlights key pressures and strategic levers. Ready for deeper, force-by-force ratings, visuals, and actionable implications? Unlock the full Porter’s Five Forces Analysis to inform smarter investment and strategy decisions.
Suppliers Bargaining Power

Specialized upstream services
INPEX depends on scarce high-spec drilling rigs, subsea systems and FPSO capacity, where industry lead times typically run 18–36 months and rig/utilization rates exceeded 90% in 2024, strengthening supplier leverage. Leading OFS vendors and Korean/Chinese shipyards command premium pricing and delivery priority, driving long lead-time dependence and high switching costs. Tight supply cycles amplify schedule and cost risk, raising capex volatility for projects.
Host governments and NOCs
Host governments and NOCs control access to acreage and production terms, holding over 80% of proven oil and gas reserves (IEA, 2024), which lets them set fiscal terms, local‑content rules and gas‑pricing frameworks that materially shape project economics. Renegotiations or policy shifts can reallocate significant value to the resource owner, and political risk raises supplier power in frontier and LNG‑linked markets.

Technology and EPC contractors
Proprietary technologies and experienced EPCs are required for LNG trains, CO2 capture units and hydrogen facilities, with individual LNG train modules typically costing $3–5 billion each. Limited qualified contractors create strong bidding power and change‑order leverage; the 2024 global LNG/CCS/H2 project pipeline was roughly $200 billion and remains concentrated among a few firms. Performance guarantees and integration know‑how are negotiation choke points, and vendor lock‑in can persist across 20+ year project life cycles.

Logistics and materials bottlenecks
Global cyclicality in steel, compressors, cryogenic skids and marine logistics tightened supplier leverage for Inpex in 2024: steel price swings ~20% y/y, compressor lead times 12–24 months and cryogenic equipment 18–30 months, driving procurement delays and cost inflation. Remote offshore and desert projects amplify logistics dependence and inventory risk, while freight and FX volatility (freight swings ~25–30% in 2023–24) further shift bargaining power to suppliers. Supply shocks have translated into multi-100 million-dollar capex timing risk on large LNG/offshore projects.
- steel: ~20% y/y volatility 2024
- compressors: 12–24 month lead times
- cryogenics: 18–30 month lead times
- freight/FX swings: ~25–30% (2023–24)
Digital and subsurface data providers
Rig use over 90%, 18–36 month lead times and volatile steel/freight raise LNG capex
INPEX faces strong supplier power: rig/utilization >90% in 2024 and long 18–36 month lead times. LNG/EPC vendors and shipyards command premium pricing; LNG train capex $3–5bn. Host governments/NOCs hold >80% reserves (IEA 2024), shaping fiscal/local rules. Steel volatility ~20% y/y and freight/FX swings ~25–30% (2023–24) raise capex and schedule risk.
| Item | 2024 Metric |
|---|---|
| Rig utilization | >90% |
| LNG train cost | $3–5bn |
| Reserves control | >80% (IEA) |
| Steel volatility | ~20% y/y |
| Freight/FX | ~25–30% |
What is included in the product
 Detailed Word Document
Uncovers key drivers of competition, customer influence, and market entry risks tailored to Inpex, with detailed evaluation of suppliers, buyers, substitutes, new entrants and industry rivalry to reveal pricing power and strategic vulnerabilities.

 Customizable Excel Spreadsheet
A concise one-sheet Porter's Five Forces for INPEX that visualizes supplier, buyer, competitor, entrant and substitution pressures and lets you toggle scenarios for regulatory, price or project changes—perfect for rapid strategic decisions and clean slide-ready summaries.
Customers Bargaining Power

Large LNG and utility offtakers
Large utilities and aggregators negotiate long-term SPAs (typically 15–20 years) with oil- or gas-indexed pricing, while portfolio buyers leverage scale, destination flexibility and spot alternatives; global LNG trade reached about 380 mtpa in 2024, boosting buyers’ bargaining leverage. Creditworthy offtakers demand favorable credit and carbon-intensity disclosures, and their multi-year procurement cycles materially influence INPEX project FIDs.
Refiners and petrochemical customers
Oil and condensate buyers, largely refiners and petrochemical players, are numerous and price-driven with transparent benchmarks such as Brent and Platts governing deals in 2024. Quality specs and narrow logistics windows limit sellers’ differentiation levers, keeping negotiation focused on price and delivery. Regional switching of cargos is common with modest transshipment or freight cost impact. Margin-sensitive customers increasingly demand flexible lifting and payment terms.

Growing spot and hub liquidity
Growing JKM/TTF-linked pricing and rising spot volumes — spot and short-term LNG trade accounted for about 35-40% of global volumes in 2024 — increase buyer optionality, while shorter contract tenors erode seller lock-in. Market volatility lets buyers time purchases, reducing achievable premiums on long-term contracts and compressing seller bargaining power.

Decarbonization requirements
- Buyers require GHG tracking
- Methane control critical (methane ~30% of warming)
- CI thresholds = pass/fail
- Non-compliance → exclusion/discounts
Government-backed purchasers
Government-backed purchasers can force procurement to reflect policy goals—security of supply and price caps—affecting contract pricing and volumes; in 2024 JKM averaged about $12/MMBtu, tightening buyer leverage in LNG deals. Political influence can reset commercial terms rapidly, and sanctions/trade rules since 2022 continue to reshape counterparties and routing. INPEX must weigh commercial returns against diplomatic risk when negotiating state-linked contracts.
- Policy alignment: security of supply, price caps
- Rapid term resets via political action
- Sanctions/trade rules reshape counterparties
- INPEX balance: commercial vs diplomatic
2024 LNG shift: ≈380 mtpa trade, 35–40% spot, $12 JKM boosts buyer leverage
Large utilities and aggregators use 15–20 year SPAs with oil/gas indexing while portfolio buyers exploit scale, destination flexibility and spot options; global LNG trade reached ≈380 mtpa in 2024, boosting buyer leverage. Spot/short-term volumes were ~35–40% in 2024 and average JKM ≈$12/MMBtu, increasing optionality and compressing seller premiums. Buyers demand GHG/methane controls (methane ≈30% of warming), creating pass/fail CI thresholds.
| Metric | 2024 |
|---|---|
| Global LNG trade | ≈380 mtpa |
| Spot/short-term share | 35–40% |
| Avg JKM | ≈$12/MMBtu |
| SPA tenor | 15–20 yrs |
What You See Is What You Get
Inpex Porter's Five Forces Analysis
This Inpex Porter's Five Forces Analysis preview shows the exact, fully formatted document you’ll receive immediately after purchase—no placeholders or sample pages. The content is complete and ready for download and use the moment you buy. You’re viewing the final deliverable, unchanged and ready for practical application.

From Overview to Strategy Blueprint
Inpex faces a complex mix of supplier leverage, capital intensity, and evolving energy demand that shapes its competitive landscape; this snapshot highlights key pressures and strategic levers. Ready for deeper, force-by-force ratings, visuals, and actionable implications? Unlock the full Porter’s Five Forces Analysis to inform smarter investment and strategy decisions.
Suppliers Bargaining Power
Specialized upstream services
INPEX depends on scarce high-spec drilling rigs, subsea systems and FPSO capacity, where industry lead times typically run 18–36 months and rig/utilization rates exceeded 90% in 2024, strengthening supplier leverage. Leading OFS vendors and Korean/Chinese shipyards command premium pricing and delivery priority, driving long lead-time dependence and high switching costs. Tight supply cycles amplify schedule and cost risk, raising capex volatility for projects.
Host governments and NOCs
Host governments and NOCs control access to acreage and production terms, holding over 80% of proven oil and gas reserves (IEA, 2024), which lets them set fiscal terms, local‑content rules and gas‑pricing frameworks that materially shape project economics. Renegotiations or policy shifts can reallocate significant value to the resource owner, and political risk raises supplier power in frontier and LNG‑linked markets.
Technology and EPC contractors
Proprietary technologies and experienced EPCs are required for LNG trains, CO2 capture units and hydrogen facilities, with individual LNG train modules typically costing $3–5 billion each. Limited qualified contractors create strong bidding power and change‑order leverage; the 2024 global LNG/CCS/H2 project pipeline was roughly $200 billion and remains concentrated among a few firms. Performance guarantees and integration know‑how are negotiation choke points, and vendor lock‑in can persist across 20+ year project life cycles.
Logistics and materials bottlenecks
Global cyclicality in steel, compressors, cryogenic skids and marine logistics tightened supplier leverage for Inpex in 2024: steel price swings ~20% y/y, compressor lead times 12–24 months and cryogenic equipment 18–30 months, driving procurement delays and cost inflation. Remote offshore and desert projects amplify logistics dependence and inventory risk, while freight and FX volatility (freight swings ~25–30% in 2023–24) further shift bargaining power to suppliers. Supply shocks have translated into multi-100 million-dollar capex timing risk on large LNG/offshore projects.
- steel: ~20% y/y volatility 2024
- compressors: 12–24 month lead times
- cryogenics: 18–30 month lead times
- freight/FX swings: ~25–30% (2023–24)
Digital and subsurface data providers
Rig use over 90%, 18–36 month lead times and volatile steel/freight raise LNG capex
INPEX faces strong supplier power: rig/utilization >90% in 2024 and long 18–36 month lead times. LNG/EPC vendors and shipyards command premium pricing; LNG train capex $3–5bn. Host governments/NOCs hold >80% reserves (IEA 2024), shaping fiscal/local rules. Steel volatility ~20% y/y and freight/FX swings ~25–30% (2023–24) raise capex and schedule risk.
| Item | 2024 Metric |
|---|---|
| Rig utilization | >90% |
| LNG train cost | $3–5bn |
| Reserves control | >80% (IEA) |
| Steel volatility | ~20% y/y |
| Freight/FX | ~25–30% |
What is included in the product
Detailed Word Document
Uncovers key drivers of competition, customer influence, and market entry risks tailored to Inpex, with detailed evaluation of suppliers, buyers, substitutes, new entrants and industry rivalry to reveal pricing power and strategic vulnerabilities.
Customizable Excel Spreadsheet
A concise one-sheet Porter's Five Forces for INPEX that visualizes supplier, buyer, competitor, entrant and substitution pressures and lets you toggle scenarios for regulatory, price or project changes—perfect for rapid strategic decisions and clean slide-ready summaries.
Customers Bargaining Power
Large LNG and utility offtakers
Large utilities and aggregators negotiate long-term SPAs (typically 15–20 years) with oil- or gas-indexed pricing, while portfolio buyers leverage scale, destination flexibility and spot alternatives; global LNG trade reached about 380 mtpa in 2024, boosting buyers’ bargaining leverage. Creditworthy offtakers demand favorable credit and carbon-intensity disclosures, and their multi-year procurement cycles materially influence INPEX project FIDs.
Refiners and petrochemical customers
Oil and condensate buyers, largely refiners and petrochemical players, are numerous and price-driven with transparent benchmarks such as Brent and Platts governing deals in 2024. Quality specs and narrow logistics windows limit sellers’ differentiation levers, keeping negotiation focused on price and delivery. Regional switching of cargos is common with modest transshipment or freight cost impact. Margin-sensitive customers increasingly demand flexible lifting and payment terms.
Growing spot and hub liquidity
Growing JKM/TTF-linked pricing and rising spot volumes — spot and short-term LNG trade accounted for about 35-40% of global volumes in 2024 — increase buyer optionality, while shorter contract tenors erode seller lock-in. Market volatility lets buyers time purchases, reducing achievable premiums on long-term contracts and compressing seller bargaining power.
Decarbonization requirements
- Buyers require GHG tracking
- Methane control critical (methane ~30% of warming)
- CI thresholds = pass/fail
- Non-compliance → exclusion/discounts
Government-backed purchasers
Government-backed purchasers can force procurement to reflect policy goals—security of supply and price caps—affecting contract pricing and volumes; in 2024 JKM averaged about $12/MMBtu, tightening buyer leverage in LNG deals. Political influence can reset commercial terms rapidly, and sanctions/trade rules since 2022 continue to reshape counterparties and routing. INPEX must weigh commercial returns against diplomatic risk when negotiating state-linked contracts.
- Policy alignment: security of supply, price caps
- Rapid term resets via political action
- Sanctions/trade rules reshape counterparties
- INPEX balance: commercial vs diplomatic
2024 LNG shift: ≈380 mtpa trade, 35–40% spot, $12 JKM boosts buyer leverage
Large utilities and aggregators use 15–20 year SPAs with oil/gas indexing while portfolio buyers exploit scale, destination flexibility and spot options; global LNG trade reached ≈380 mtpa in 2024, boosting buyer leverage. Spot/short-term volumes were ~35–40% in 2024 and average JKM ≈$12/MMBtu, increasing optionality and compressing seller premiums. Buyers demand GHG/methane controls (methane ≈30% of warming), creating pass/fail CI thresholds.
| Metric | 2024 |
|---|---|
| Global LNG trade | ≈380 mtpa |
| Spot/short-term share | 35–40% |
| Avg JKM | ≈$12/MMBtu |
| SPA tenor | 15–20 yrs |
What You See Is What You Get
Inpex Porter's Five Forces Analysis
This Inpex Porter's Five Forces Analysis preview shows the exact, fully formatted document you’ll receive immediately after purchase—no placeholders or sample pages. The content is complete and ready for download and use the moment you buy. You’re viewing the final deliverable, unchanged and ready for practical application.
Description
From Overview to Strategy Blueprint
Inpex faces a complex mix of supplier leverage, capital intensity, and evolving energy demand that shapes its competitive landscape; this snapshot highlights key pressures and strategic levers. Ready for deeper, force-by-force ratings, visuals, and actionable implications? Unlock the full Porter’s Five Forces Analysis to inform smarter investment and strategy decisions.
Suppliers Bargaining Power
Specialized upstream services
INPEX depends on scarce high-spec drilling rigs, subsea systems and FPSO capacity, where industry lead times typically run 18–36 months and rig/utilization rates exceeded 90% in 2024, strengthening supplier leverage. Leading OFS vendors and Korean/Chinese shipyards command premium pricing and delivery priority, driving long lead-time dependence and high switching costs. Tight supply cycles amplify schedule and cost risk, raising capex volatility for projects.
Host governments and NOCs
Host governments and NOCs control access to acreage and production terms, holding over 80% of proven oil and gas reserves (IEA, 2024), which lets them set fiscal terms, local‑content rules and gas‑pricing frameworks that materially shape project economics. Renegotiations or policy shifts can reallocate significant value to the resource owner, and political risk raises supplier power in frontier and LNG‑linked markets.
Technology and EPC contractors
Proprietary technologies and experienced EPCs are required for LNG trains, CO2 capture units and hydrogen facilities, with individual LNG train modules typically costing $3–5 billion each. Limited qualified contractors create strong bidding power and change‑order leverage; the 2024 global LNG/CCS/H2 project pipeline was roughly $200 billion and remains concentrated among a few firms. Performance guarantees and integration know‑how are negotiation choke points, and vendor lock‑in can persist across 20+ year project life cycles.
Logistics and materials bottlenecks
Global cyclicality in steel, compressors, cryogenic skids and marine logistics tightened supplier leverage for Inpex in 2024: steel price swings ~20% y/y, compressor lead times 12–24 months and cryogenic equipment 18–30 months, driving procurement delays and cost inflation. Remote offshore and desert projects amplify logistics dependence and inventory risk, while freight and FX volatility (freight swings ~25–30% in 2023–24) further shift bargaining power to suppliers. Supply shocks have translated into multi-100 million-dollar capex timing risk on large LNG/offshore projects.
- steel: ~20% y/y volatility 2024
- compressors: 12–24 month lead times
- cryogenics: 18–30 month lead times
- freight/FX swings: ~25–30% (2023–24)
Digital and subsurface data providers
Rig use over 90%, 18–36 month lead times and volatile steel/freight raise LNG capex
INPEX faces strong supplier power: rig/utilization >90% in 2024 and long 18–36 month lead times. LNG/EPC vendors and shipyards command premium pricing; LNG train capex $3–5bn. Host governments/NOCs hold >80% reserves (IEA 2024), shaping fiscal/local rules. Steel volatility ~20% y/y and freight/FX swings ~25–30% (2023–24) raise capex and schedule risk.
| Item | 2024 Metric |
|---|---|
| Rig utilization | >90% |
| LNG train cost | $3–5bn |
| Reserves control | >80% (IEA) |
| Steel volatility | ~20% y/y |
| Freight/FX | ~25–30% |
What is included in the product
Detailed Word Document
Uncovers key drivers of competition, customer influence, and market entry risks tailored to Inpex, with detailed evaluation of suppliers, buyers, substitutes, new entrants and industry rivalry to reveal pricing power and strategic vulnerabilities.
Customizable Excel Spreadsheet
A concise one-sheet Porter's Five Forces for INPEX that visualizes supplier, buyer, competitor, entrant and substitution pressures and lets you toggle scenarios for regulatory, price or project changes—perfect for rapid strategic decisions and clean slide-ready summaries.
Customers Bargaining Power
Large LNG and utility offtakers
Large utilities and aggregators negotiate long-term SPAs (typically 15–20 years) with oil- or gas-indexed pricing, while portfolio buyers leverage scale, destination flexibility and spot alternatives; global LNG trade reached about 380 mtpa in 2024, boosting buyers’ bargaining leverage. Creditworthy offtakers demand favorable credit and carbon-intensity disclosures, and their multi-year procurement cycles materially influence INPEX project FIDs.
Refiners and petrochemical customers
Oil and condensate buyers, largely refiners and petrochemical players, are numerous and price-driven with transparent benchmarks such as Brent and Platts governing deals in 2024. Quality specs and narrow logistics windows limit sellers’ differentiation levers, keeping negotiation focused on price and delivery. Regional switching of cargos is common with modest transshipment or freight cost impact. Margin-sensitive customers increasingly demand flexible lifting and payment terms.
Growing spot and hub liquidity
Growing JKM/TTF-linked pricing and rising spot volumes — spot and short-term LNG trade accounted for about 35-40% of global volumes in 2024 — increase buyer optionality, while shorter contract tenors erode seller lock-in. Market volatility lets buyers time purchases, reducing achievable premiums on long-term contracts and compressing seller bargaining power.
Decarbonization requirements
- Buyers require GHG tracking
- Methane control critical (methane ~30% of warming)
- CI thresholds = pass/fail
- Non-compliance → exclusion/discounts
Government-backed purchasers
Government-backed purchasers can force procurement to reflect policy goals—security of supply and price caps—affecting contract pricing and volumes; in 2024 JKM averaged about $12/MMBtu, tightening buyer leverage in LNG deals. Political influence can reset commercial terms rapidly, and sanctions/trade rules since 2022 continue to reshape counterparties and routing. INPEX must weigh commercial returns against diplomatic risk when negotiating state-linked contracts.
- Policy alignment: security of supply, price caps
- Rapid term resets via political action
- Sanctions/trade rules reshape counterparties
- INPEX balance: commercial vs diplomatic
2024 LNG shift: ≈380 mtpa trade, 35–40% spot, $12 JKM boosts buyer leverage
Large utilities and aggregators use 15–20 year SPAs with oil/gas indexing while portfolio buyers exploit scale, destination flexibility and spot options; global LNG trade reached ≈380 mtpa in 2024, boosting buyer leverage. Spot/short-term volumes were ~35–40% in 2024 and average JKM ≈$12/MMBtu, increasing optionality and compressing seller premiums. Buyers demand GHG/methane controls (methane ≈30% of warming), creating pass/fail CI thresholds.
| Metric | 2024 |
|---|---|
| Global LNG trade | ≈380 mtpa |
| Spot/short-term share | 35–40% |
| Avg JKM | ≈$12/MMBtu |
| SPA tenor | 15–20 yrs |
What You See Is What You Get
Inpex Porter's Five Forces Analysis
This Inpex Porter's Five Forces Analysis preview shows the exact, fully formatted document you’ll receive immediately after purchase—no placeholders or sample pages. The content is complete and ready for download and use the moment you buy. You’re viewing the final deliverable, unchanged and ready for practical application.











