Insight Porter's Five Forces Analysis

Elevate Your Analysis with the Complete Porter's Five Forces Analysis
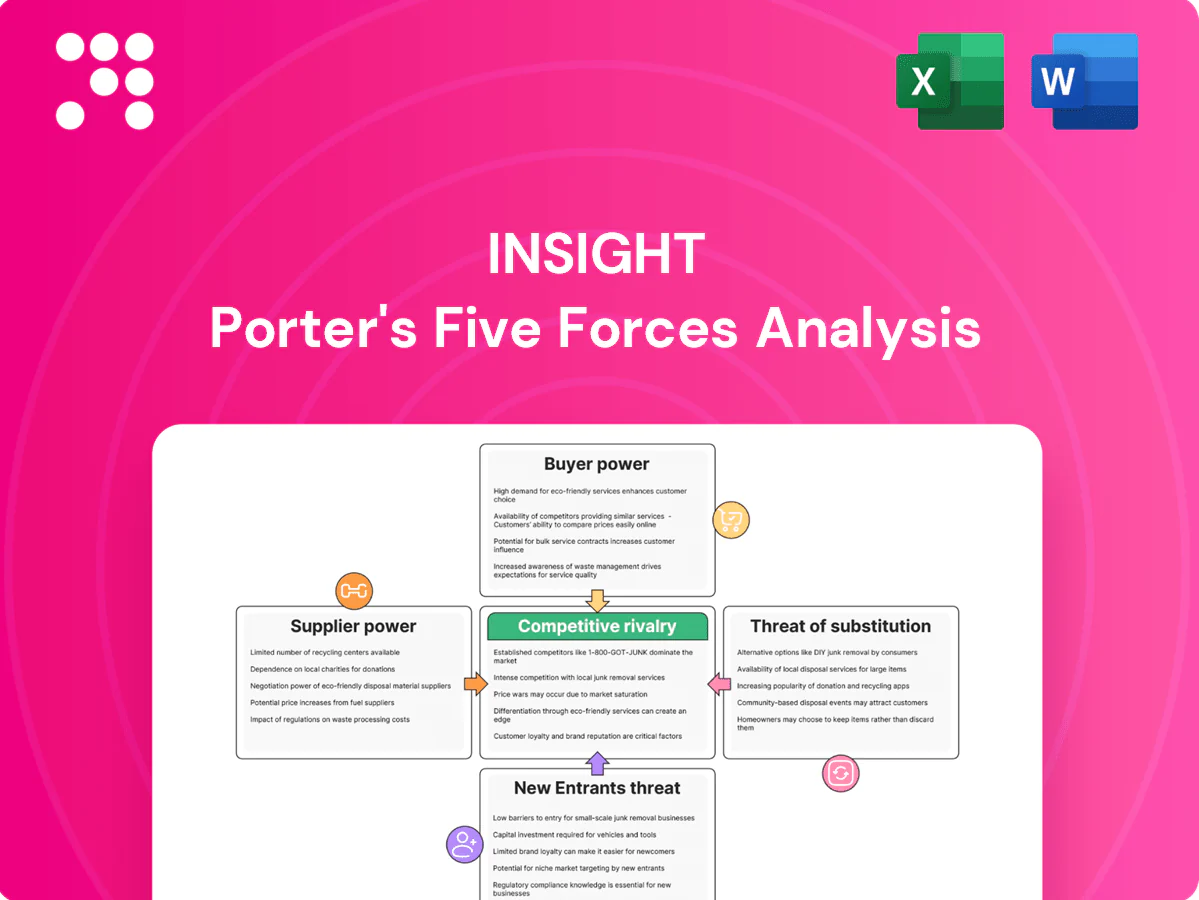
Our snapshot highlights the key competitive pressures around Insight—buyer and supplier power, entrant threats, substitutes, and rivalry—showing where strategic risks and advantages lie. This preview only scratches the surface. Unlock the full Porter's Five Forces Analysis to explore Insight’s competitive dynamics and market pressures in detail.
Suppliers Bargaining Power

Concentrated OEM ecosystem
Insight depends on a concentrated set of OEMs and hyperscalers—AWS, Azure, GCP held roughly 66% of global cloud infrastructure spend in 2024, while Dell, HPE and Lenovo captured about 60% of server market share in 2024. That concentration increases vendor leverage on pricing and contract terms. Certification and partner-tier requirements (AWS Premier, Microsoft Gold) constrain switching and raise onboarding time and costs.
Tiered partner programs
As of 2024 tiered partner programs tie rebates, MDF and pricing bundles to vendor roadmaps, locking Insight into product and go‑to‑market timelines. Losing top-tier status raises procurement costs and erodes margins through lost rebates and higher list pricing. Holding multiple top-tier badges mitigates vendor dependency but does not eliminate margin risk or roadmap alignment pressures.

Supply chain volatility
Supply chain volatility—component shortages, logistics constraints and EOL cycles—gives suppliers leverage; semiconductor lead times that peaked near 20 weeks have only partially normalized to about 12–16 weeks in 2024, sustaining bargaining power. Lead-time risk forces higher buffer inventory or expedited freight, often adding over 20% to landed cost. Tight service-level commitments to clients squeeze margins when supplier slippage occurs.

Cloud platform lock-in
Public cloud providers control pricing models, discount structures and marketplace fees; AWS, Azure and GCP held roughly 31%, 23% and 11% of global IaaS/PaaS in 2024, concentrating supplier power. Incentive program changes in 2023–24 compressed partner margins by up to 300 basis points. Multi-cloud reduces vendor risk but switching costs remain material, with large migrations often exceeding $2M and months of effort.
- Pricing control by top providers
- Partner margins compressed up to 300 bps (2023–24)
- Multi-cloud helps but migrations often > $2M
Co-selling and direct motion
Suppliers increasingly pursue co-selling and direct motion on strategic accounts, creating dual channels that compress Insight’s deal margins and reduce pipeline visibility as of 2024. This dual approach shifts negotiating leverage toward suppliers on high-value deals and can accelerate deal displacement. Deep solution integration and bundled managed services remain the strongest defenses to preserve margin and visibility.
- 2024 trend: rising supplier direct motions
- Impact: margin compression and lower pipeline transparency
- Defense: solution integration + managed services
Supplier power concentrated: top cloud ~66%, servers ~60%, margins -300 bps
Supplier power is high: AWS/Azure/GCP captured ~66% of cloud infra spend in 2024 and Dell/HPE/Lenovo held ~60% of server market, concentrating pricing leverage. Partner program changes compressed margins up to 300 bps (2023–24) while semiconductor lead times of ~12–16 weeks in 2024 keep landed costs +20%+. Direct vendor co‑sell activity rose in 2024, pressuring margins and pipeline visibility.
| Metric | 2024 Value |
|---|---|
| Top cloud share (AWS/Azure/GCP) | ~66% |
| Server market (Dell/HPE/Lenovo) | ~60% |
| Partner margin compression | Up to 300 bps |
| Semiconductor lead times | 12–16 weeks |
| Typical large migration cost | > $2M |
What is included in the product
 Detailed Word Document
Provides a tailored Porter's Five Forces evaluation of Insight, uncovering competitive drivers, supplier and buyer power, substitute threats, and entry barriers with strategic implications for market positioning.

 Customizable Excel Spreadsheet
A single-sheet, customizable Porter's Five Forces snapshot that quantifies competitive pressure, generates an instant spider chart for strategic clarity, and exports clean visuals for decks—no macros, easy for non-finance users.
Customers Bargaining Power

Diverse, large enterprise clients
Enterprises and public-sector buyers bring procurement sophistication and volume leverage, with public procurement representing about 12% of GDP in OECD countries. Global IT and related enterprise spend was forecast at roughly 5.2 trillion in 2024, concentrating buying power. Competitive RFPs and framework agreements intensify price pressure, and vendors accept lower margins in multi-year deals to secure share-of-wallet and retention.
Low switching costs in resell
By 2024, e-procurement and price-comparison tools have made commodity hardware and software resell highly price-transparent and easy to rebid. Buyers commonly split awards across multiple VARs to sustain competition, eroding pure product margins. Differentiation now requires bundled services and demonstrable lifecycle value such as managed services, financing and extended warranties.

Outcome-driven service SLAs
Outcome-driven SLAs dominate managed services and security contracts, tying fees to measurable KPIs such as uptime and incident MTTR; in 2024 the managed security services market was about $45 billion, reinforcing SLA focus. Clients commonly negotiate credits and penalties—often up to 5% of monthly fees—and exit clauses to limit vendor risk. Strong referenceability and high customer retention reduce renegotiation frequency and pricing pressure.

Cloud spend optimization demands
FinOps-minded customers demand continuous cloud and SaaS cost-downs; Flexera 2024 found average cloud waste at 32%, driving buyers to expect rightsizing, reservations and marketplace savings passed through. Procurement now ties margin to advisory value and optimization outcomes rather than blanket discounts; mature FinOps programs commonly report 20–30% savings in case studies.
- Cloud waste: 32% (Flexera 2024)
- Expected actions: rightsizing, reservations, marketplace pass-through
- Value shift: advisory-led margin vs discounting
- Typical FinOps savings: 20–30%
Sector compliance requirements
Sector compliance in healthcare, government, and education forces vendors to deliver extensive documentation, audit trails, and certifications; by 2024 FedRAMP authorization remained mandatory for US federal procurement and HIPAA/ISO 27001 are baseline expectations. Buyers insist on auditability and data residency, which increases customer stickiness but drives intense price negotiation and margin pressure.
- Key regs: HIPAA, FedRAMP, ISO 27001
- Buyer demands: auditability, data residency, certifications
- Trade-off: higher retention vs. stronger price scrutiny
Buyers wield leverage: public procurement ~12% GDP, IT spend $5.2T, cloud waste 32%
Buyers wield high bargaining power: public procurement ~12% of OECD GDP and global IT spend ~$5.2T (2024), driving volume leverage and RFP price pressure. Price transparency and cloud waste (32%) force vendors into outcome-based deals; managed security ~$45B (2024) ties fees to SLAs. Compliance (FedRAMP, HIPAA, ISO 27001) raises stickiness but sharpens margin pressure.
| Metric | 2024 |
|---|---|
| Public procurement | ~12% GDP (OECD) |
| Global IT spend | $5.2T |
| Cloud waste | 32% |
| MSS market | $45B |
Preview Before You Purchase
Insight Porter's Five Forces Analysis
This preview shows the Insight Porter's Five Forces Analysis exactly as delivered after purchase; no placeholders or samples. The full document you download is fully formatted, professionally written, and ready for immediate use. What you see is precisely what you’ll receive upon payment.

Elevate Your Analysis with the Complete Porter's Five Forces Analysis
Our snapshot highlights the key competitive pressures around Insight—buyer and supplier power, entrant threats, substitutes, and rivalry—showing where strategic risks and advantages lie. This preview only scratches the surface. Unlock the full Porter's Five Forces Analysis to explore Insight’s competitive dynamics and market pressures in detail.
Suppliers Bargaining Power
Concentrated OEM ecosystem
Insight depends on a concentrated set of OEMs and hyperscalers—AWS, Azure, GCP held roughly 66% of global cloud infrastructure spend in 2024, while Dell, HPE and Lenovo captured about 60% of server market share in 2024. That concentration increases vendor leverage on pricing and contract terms. Certification and partner-tier requirements (AWS Premier, Microsoft Gold) constrain switching and raise onboarding time and costs.
Tiered partner programs
As of 2024 tiered partner programs tie rebates, MDF and pricing bundles to vendor roadmaps, locking Insight into product and go‑to‑market timelines. Losing top-tier status raises procurement costs and erodes margins through lost rebates and higher list pricing. Holding multiple top-tier badges mitigates vendor dependency but does not eliminate margin risk or roadmap alignment pressures.
Supply chain volatility
Supply chain volatility—component shortages, logistics constraints and EOL cycles—gives suppliers leverage; semiconductor lead times that peaked near 20 weeks have only partially normalized to about 12–16 weeks in 2024, sustaining bargaining power. Lead-time risk forces higher buffer inventory or expedited freight, often adding over 20% to landed cost. Tight service-level commitments to clients squeeze margins when supplier slippage occurs.
Cloud platform lock-in
Public cloud providers control pricing models, discount structures and marketplace fees; AWS, Azure and GCP held roughly 31%, 23% and 11% of global IaaS/PaaS in 2024, concentrating supplier power. Incentive program changes in 2023–24 compressed partner margins by up to 300 basis points. Multi-cloud reduces vendor risk but switching costs remain material, with large migrations often exceeding $2M and months of effort.
- Pricing control by top providers
- Partner margins compressed up to 300 bps (2023–24)
- Multi-cloud helps but migrations often > $2M
Co-selling and direct motion
Suppliers increasingly pursue co-selling and direct motion on strategic accounts, creating dual channels that compress Insight’s deal margins and reduce pipeline visibility as of 2024. This dual approach shifts negotiating leverage toward suppliers on high-value deals and can accelerate deal displacement. Deep solution integration and bundled managed services remain the strongest defenses to preserve margin and visibility.
- 2024 trend: rising supplier direct motions
- Impact: margin compression and lower pipeline transparency
- Defense: solution integration + managed services
Supplier power concentrated: top cloud ~66%, servers ~60%, margins -300 bps
Supplier power is high: AWS/Azure/GCP captured ~66% of cloud infra spend in 2024 and Dell/HPE/Lenovo held ~60% of server market, concentrating pricing leverage. Partner program changes compressed margins up to 300 bps (2023–24) while semiconductor lead times of ~12–16 weeks in 2024 keep landed costs +20%+. Direct vendor co‑sell activity rose in 2024, pressuring margins and pipeline visibility.
| Metric | 2024 Value |
|---|---|
| Top cloud share (AWS/Azure/GCP) | ~66% |
| Server market (Dell/HPE/Lenovo) | ~60% |
| Partner margin compression | Up to 300 bps |
| Semiconductor lead times | 12–16 weeks |
| Typical large migration cost | > $2M |
What is included in the product
Detailed Word Document
Provides a tailored Porter's Five Forces evaluation of Insight, uncovering competitive drivers, supplier and buyer power, substitute threats, and entry barriers with strategic implications for market positioning.
Customizable Excel Spreadsheet
A single-sheet, customizable Porter's Five Forces snapshot that quantifies competitive pressure, generates an instant spider chart for strategic clarity, and exports clean visuals for decks—no macros, easy for non-finance users.
Customers Bargaining Power
Diverse, large enterprise clients
Enterprises and public-sector buyers bring procurement sophistication and volume leverage, with public procurement representing about 12% of GDP in OECD countries. Global IT and related enterprise spend was forecast at roughly 5.2 trillion in 2024, concentrating buying power. Competitive RFPs and framework agreements intensify price pressure, and vendors accept lower margins in multi-year deals to secure share-of-wallet and retention.
Low switching costs in resell
By 2024, e-procurement and price-comparison tools have made commodity hardware and software resell highly price-transparent and easy to rebid. Buyers commonly split awards across multiple VARs to sustain competition, eroding pure product margins. Differentiation now requires bundled services and demonstrable lifecycle value such as managed services, financing and extended warranties.
Outcome-driven service SLAs
Outcome-driven SLAs dominate managed services and security contracts, tying fees to measurable KPIs such as uptime and incident MTTR; in 2024 the managed security services market was about $45 billion, reinforcing SLA focus. Clients commonly negotiate credits and penalties—often up to 5% of monthly fees—and exit clauses to limit vendor risk. Strong referenceability and high customer retention reduce renegotiation frequency and pricing pressure.
Cloud spend optimization demands
FinOps-minded customers demand continuous cloud and SaaS cost-downs; Flexera 2024 found average cloud waste at 32%, driving buyers to expect rightsizing, reservations and marketplace savings passed through. Procurement now ties margin to advisory value and optimization outcomes rather than blanket discounts; mature FinOps programs commonly report 20–30% savings in case studies.
- Cloud waste: 32% (Flexera 2024)
- Expected actions: rightsizing, reservations, marketplace pass-through
- Value shift: advisory-led margin vs discounting
- Typical FinOps savings: 20–30%
Sector compliance requirements
Sector compliance in healthcare, government, and education forces vendors to deliver extensive documentation, audit trails, and certifications; by 2024 FedRAMP authorization remained mandatory for US federal procurement and HIPAA/ISO 27001 are baseline expectations. Buyers insist on auditability and data residency, which increases customer stickiness but drives intense price negotiation and margin pressure.
- Key regs: HIPAA, FedRAMP, ISO 27001
- Buyer demands: auditability, data residency, certifications
- Trade-off: higher retention vs. stronger price scrutiny
Buyers wield leverage: public procurement ~12% GDP, IT spend $5.2T, cloud waste 32%
Buyers wield high bargaining power: public procurement ~12% of OECD GDP and global IT spend ~$5.2T (2024), driving volume leverage and RFP price pressure. Price transparency and cloud waste (32%) force vendors into outcome-based deals; managed security ~$45B (2024) ties fees to SLAs. Compliance (FedRAMP, HIPAA, ISO 27001) raises stickiness but sharpens margin pressure.
| Metric | 2024 |
|---|---|
| Public procurement | ~12% GDP (OECD) |
| Global IT spend | $5.2T |
| Cloud waste | 32% |
| MSS market | $45B |
Preview Before You Purchase
Insight Porter's Five Forces Analysis
This preview shows the Insight Porter's Five Forces Analysis exactly as delivered after purchase; no placeholders or samples. The full document you download is fully formatted, professionally written, and ready for immediate use. What you see is precisely what you’ll receive upon payment.
Original: $10.00
-65%$10.00
$3.50Description
Elevate Your Analysis with the Complete Porter's Five Forces Analysis
Our snapshot highlights the key competitive pressures around Insight—buyer and supplier power, entrant threats, substitutes, and rivalry—showing where strategic risks and advantages lie. This preview only scratches the surface. Unlock the full Porter's Five Forces Analysis to explore Insight’s competitive dynamics and market pressures in detail.
Suppliers Bargaining Power
Concentrated OEM ecosystem
Insight depends on a concentrated set of OEMs and hyperscalers—AWS, Azure, GCP held roughly 66% of global cloud infrastructure spend in 2024, while Dell, HPE and Lenovo captured about 60% of server market share in 2024. That concentration increases vendor leverage on pricing and contract terms. Certification and partner-tier requirements (AWS Premier, Microsoft Gold) constrain switching and raise onboarding time and costs.
Tiered partner programs
As of 2024 tiered partner programs tie rebates, MDF and pricing bundles to vendor roadmaps, locking Insight into product and go‑to‑market timelines. Losing top-tier status raises procurement costs and erodes margins through lost rebates and higher list pricing. Holding multiple top-tier badges mitigates vendor dependency but does not eliminate margin risk or roadmap alignment pressures.
Supply chain volatility
Supply chain volatility—component shortages, logistics constraints and EOL cycles—gives suppliers leverage; semiconductor lead times that peaked near 20 weeks have only partially normalized to about 12–16 weeks in 2024, sustaining bargaining power. Lead-time risk forces higher buffer inventory or expedited freight, often adding over 20% to landed cost. Tight service-level commitments to clients squeeze margins when supplier slippage occurs.
Cloud platform lock-in
Public cloud providers control pricing models, discount structures and marketplace fees; AWS, Azure and GCP held roughly 31%, 23% and 11% of global IaaS/PaaS in 2024, concentrating supplier power. Incentive program changes in 2023–24 compressed partner margins by up to 300 basis points. Multi-cloud reduces vendor risk but switching costs remain material, with large migrations often exceeding $2M and months of effort.
- Pricing control by top providers
- Partner margins compressed up to 300 bps (2023–24)
- Multi-cloud helps but migrations often > $2M
Co-selling and direct motion
Suppliers increasingly pursue co-selling and direct motion on strategic accounts, creating dual channels that compress Insight’s deal margins and reduce pipeline visibility as of 2024. This dual approach shifts negotiating leverage toward suppliers on high-value deals and can accelerate deal displacement. Deep solution integration and bundled managed services remain the strongest defenses to preserve margin and visibility.
- 2024 trend: rising supplier direct motions
- Impact: margin compression and lower pipeline transparency
- Defense: solution integration + managed services
Supplier power concentrated: top cloud ~66%, servers ~60%, margins -300 bps
Supplier power is high: AWS/Azure/GCP captured ~66% of cloud infra spend in 2024 and Dell/HPE/Lenovo held ~60% of server market, concentrating pricing leverage. Partner program changes compressed margins up to 300 bps (2023–24) while semiconductor lead times of ~12–16 weeks in 2024 keep landed costs +20%+. Direct vendor co‑sell activity rose in 2024, pressuring margins and pipeline visibility.
| Metric | 2024 Value |
|---|---|
| Top cloud share (AWS/Azure/GCP) | ~66% |
| Server market (Dell/HPE/Lenovo) | ~60% |
| Partner margin compression | Up to 300 bps |
| Semiconductor lead times | 12–16 weeks |
| Typical large migration cost | > $2M |
What is included in the product
Detailed Word Document
Provides a tailored Porter's Five Forces evaluation of Insight, uncovering competitive drivers, supplier and buyer power, substitute threats, and entry barriers with strategic implications for market positioning.
Customizable Excel Spreadsheet
A single-sheet, customizable Porter's Five Forces snapshot that quantifies competitive pressure, generates an instant spider chart for strategic clarity, and exports clean visuals for decks—no macros, easy for non-finance users.
Customers Bargaining Power
Diverse, large enterprise clients
Enterprises and public-sector buyers bring procurement sophistication and volume leverage, with public procurement representing about 12% of GDP in OECD countries. Global IT and related enterprise spend was forecast at roughly 5.2 trillion in 2024, concentrating buying power. Competitive RFPs and framework agreements intensify price pressure, and vendors accept lower margins in multi-year deals to secure share-of-wallet and retention.
Low switching costs in resell
By 2024, e-procurement and price-comparison tools have made commodity hardware and software resell highly price-transparent and easy to rebid. Buyers commonly split awards across multiple VARs to sustain competition, eroding pure product margins. Differentiation now requires bundled services and demonstrable lifecycle value such as managed services, financing and extended warranties.
Outcome-driven service SLAs
Outcome-driven SLAs dominate managed services and security contracts, tying fees to measurable KPIs such as uptime and incident MTTR; in 2024 the managed security services market was about $45 billion, reinforcing SLA focus. Clients commonly negotiate credits and penalties—often up to 5% of monthly fees—and exit clauses to limit vendor risk. Strong referenceability and high customer retention reduce renegotiation frequency and pricing pressure.
Cloud spend optimization demands
FinOps-minded customers demand continuous cloud and SaaS cost-downs; Flexera 2024 found average cloud waste at 32%, driving buyers to expect rightsizing, reservations and marketplace savings passed through. Procurement now ties margin to advisory value and optimization outcomes rather than blanket discounts; mature FinOps programs commonly report 20–30% savings in case studies.
- Cloud waste: 32% (Flexera 2024)
- Expected actions: rightsizing, reservations, marketplace pass-through
- Value shift: advisory-led margin vs discounting
- Typical FinOps savings: 20–30%
Sector compliance requirements
Sector compliance in healthcare, government, and education forces vendors to deliver extensive documentation, audit trails, and certifications; by 2024 FedRAMP authorization remained mandatory for US federal procurement and HIPAA/ISO 27001 are baseline expectations. Buyers insist on auditability and data residency, which increases customer stickiness but drives intense price negotiation and margin pressure.
- Key regs: HIPAA, FedRAMP, ISO 27001
- Buyer demands: auditability, data residency, certifications
- Trade-off: higher retention vs. stronger price scrutiny
Buyers wield leverage: public procurement ~12% GDP, IT spend $5.2T, cloud waste 32%
Buyers wield high bargaining power: public procurement ~12% of OECD GDP and global IT spend ~$5.2T (2024), driving volume leverage and RFP price pressure. Price transparency and cloud waste (32%) force vendors into outcome-based deals; managed security ~$45B (2024) ties fees to SLAs. Compliance (FedRAMP, HIPAA, ISO 27001) raises stickiness but sharpens margin pressure.
| Metric | 2024 |
|---|---|
| Public procurement | ~12% GDP (OECD) |
| Global IT spend | $5.2T |
| Cloud waste | 32% |
| MSS market | $45B |
Preview Before You Purchase
Insight Porter's Five Forces Analysis
This preview shows the Insight Porter's Five Forces Analysis exactly as delivered after purchase; no placeholders or samples. The full document you download is fully formatted, professionally written, and ready for immediate use. What you see is precisely what you’ll receive upon payment.











