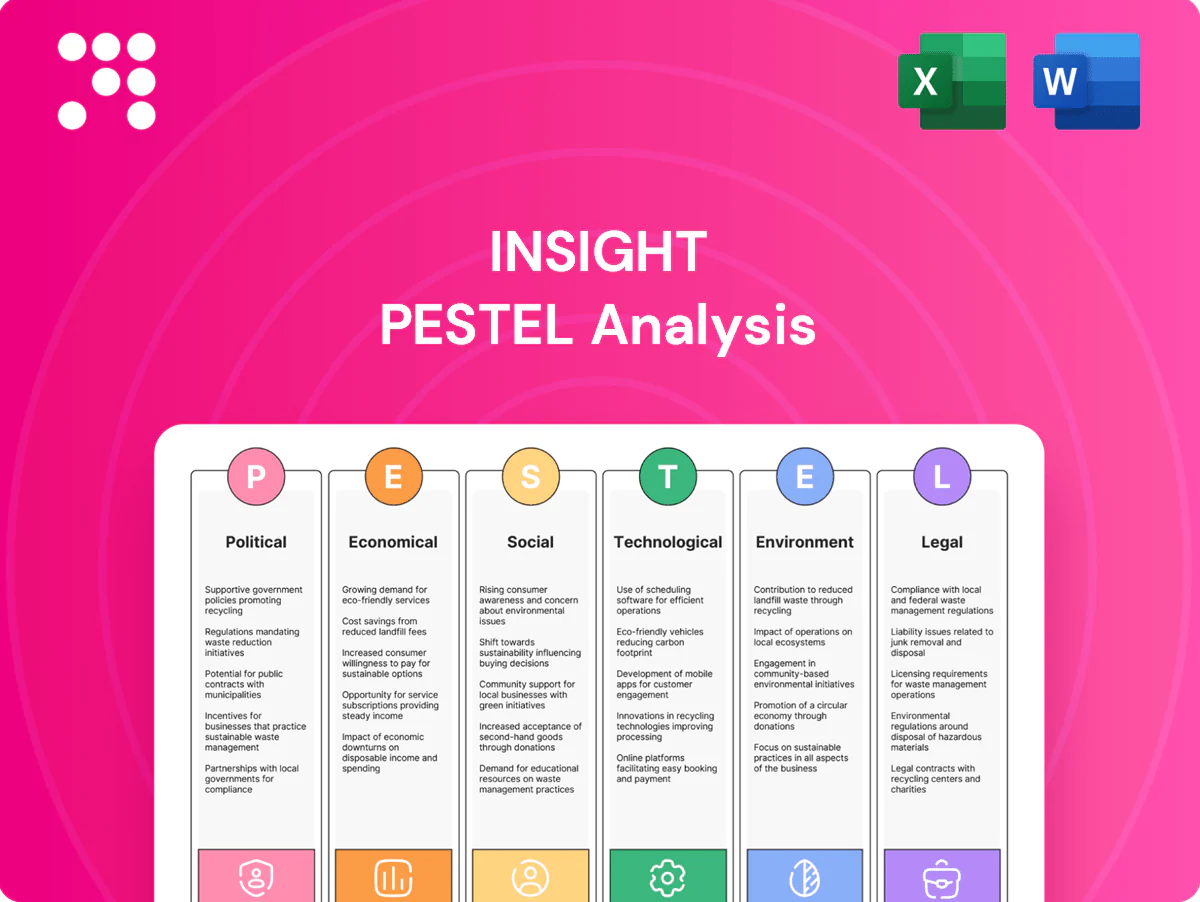
Insight PESTLE Analysis

Make Smarter Strategic Decisions with a Complete PESTEL View
Discover how political, economic, social, technological, legal, and environmental forces are shaping Insight’s strategic horizon in our concise PESTLE briefing. Backed by primary data and expert interpretation, this analysis highlights risks and growth levers you can act on immediately. Purchase the full PESTLE for the complete, editable report and use it to strengthen forecasts, board decks, or investment decisions.
Political factors

Geopolitical supply risks
Global tensions and export controls since 2022 (notably US chip curbs) can delay hardware procurement and services; chokepoints like the Suez Canal (≈12% of global trade) and Strait of Hormuz (≈20% of seaborne oil) amplify risk. Insight’s multi-vendor sourcing must hedge country concentration and logistics bottlenecks after procurement premiums spiked up to ~20% in 2021–22. Scenario planning for sanctions, tariffs and alternative routing preserves margin and uptime, while government clients increasingly favor sovereign vendors under domestic procurement rules.
Public sector IT priorities
Government digital modernization and cybersecurity funding, notably historic boosts across 2024–25, are sustaining demand in defense, healthcare and education; agencies prioritize cloud, zero trust and EI/AI projects. Annual budget cycles and appropriation timing limit bookings visibility and often shift spend into next fiscal year. Vendor registrations, local content and bidding rules materially affect win rates. Contract lead times commonly exceed 12–24 months, requiring disciplined capture management.

Data sovereignty mandates
Rising national data localization rules force architecture choices for cloud and managed services. Insight must align offerings with in-country hosting and compliant hyperscaler regions. Partnering with local data centers can accelerate deals and reduce onboarding time. Non-compliance risks disqualification and penalties up to €20 million or 4% of global turnover under GDPR.

Trade tariffs and taxes
Tariff changes on IT hardware — including spikes up to 25% on select imports in 2024 — can compress gross margins or force price increases for clients; import VAT rates averaging 12–20% across target markets add measurable cost. Customs complexity across 20+ countries raises overhead and lead times; strategic inventory placement and bonded warehousing defer duties and reduce cash outlay. Contract clauses enabling surcharge pass-through can recover up to 100% of unexpected tariff increases where enforceable.
- Tariffs: up to 25% (2024)
- Import VAT: ~12–20% avg
- 20+ countries operational overhead
- Bonded warehousing defers duties, lowers cash needs
- Contracts can pass through up to 100% of surcharges
Political stability in key markets
Elections and policy shifts in 2024 reshaped IT priorities, with global IT spending topping $5 trillion and procurement rules often reprioritised; currency controls and budget freezes routinely delayed vendor rollouts and cloud migrations. Diversified geographic exposure softened shocks while strong local government relations preserved contract continuity during transitions.
- Election-driven procurement changes: higher compliance costs
- Currency controls/budget freezes: project delays reported by ~1 in 5 CIOs (2024)
- Geographic diversification: reduces single-market revenue risk
- Local govt relations: key to continuity
Supply chain risks: tariffs up to 25%, procurement premiums ~20%
Geopolitical export controls (eg US chip curbs) and chokepoints (Suez ≈12% trade; Hormuz ≈20% seaborne oil) raise delivery risk; procurement premiums peaked ~20% in 2021–22. Tariffs reached 25% (2024) and IT spend topped $5T (2024); lead times commonly 12–24 months. Data localization fines up to €20M or 4% turnover force in‑country hosting and local partnerships.
| Metric | Value |
|---|---|
| Procurement premium peak | ~20% |
| Tariffs (2024) | Up to 25% |
| Global IT spend (2024) | $5T |
| Data fines | €20M / 4% turnover |
What is included in the product
 Detailed Word Document
Explores how external macro-environmental factors uniquely affect the Insight across six dimensions—Political, Economic, Social, Technological, Environmental, and Legal—backed by current data, forward-looking scenarios, and concrete subpoints to guide executives, investors, and entrepreneurs in identifying opportunities, risks, and actionable strategic responses.

 Customizable Excel Spreadsheet
Insight PESTLE provides a clean, visually segmented summary of external risks and opportunities that can be dropped into presentations or shared across teams for quick alignment during planning sessions.
Economic factors

IT spending cycles
Macro slowdown is deferring hardware refresh cycles, with surveys in 2024 showing 20–30% of enterprises delaying non-essential refreshes, while transformation and security budgets remained resilient, rising ~8–12% YoY. Cloud and managed services now account for roughly a third of vendor revenue and deliver stickier recurring margins, growing at ~15% CAGR into 2026. Vertical diversification across healthcare, public and enterprise smooths revenue volatility. Pipeline should tilt to mission-critical, outcome-based deals that preserve ARR.
Inflation and cost pass-through
Component and labor inflation eroded margins in fixed-price services as US CPI averaged about 3.4% in 2024 and average hourly earnings rose ~4.1% y/y, forcing indexed pricing and rate cards—now embedded in roughly 50–70% of new contracts—to recover costs. Automation and offshore delivery boosted utilization by ~10–15%, while vendor rebates and volume tiers typically protect blended gross profit by ~100–300 basis points.

FX volatility
Multi-currency revenue exposes Insight to translation and transaction risk; global FX markets trade about 7.5 trillion USD daily (BIS, Apr 2022), amplifying potential swings. Hedging programs and natural offsets can materially reduce earnings volatility. Pricing in local currency supports competitiveness and demand stability. Central treasury policies must balance hedging costs against operational flexibility.

Labor market tightness
Tight labor markets push cloud, cybersecurity, and data-engineer salaries higher and raise attrition: industry reports through 2024 cite salary growth in tech roles of roughly 5–8% year-over-year and a cybersecurity workforce gap near 3.1 million (ISC2), increasing replacement costs and margin pressure.
Investment in certification pipelines and academies has measurable payoff, while nearshore/offshore talent pools expand capacity at lower cost; strict utilization discipline (billable hours targets) remains critical to protect services margins.
- Salary inflation: ~5–8% (tech roles, 2024)
- Cyber workforce gap: ~3.1M (ISC2, 2024)
- Nearshore/offshore: lower hourly rates, larger candidate pools
- Utilization focus: sustains service margins
Vendor rebate economics
OEM and hyperscaler incentive structures materially affect profitability, with vendor disclosures in 2024 noting rebates often range between 5% and 20% of contract value and accounting for a meaningful share of channel margin. Solution bundling and tier attainment drive back-end rebates—partners achieving tier targets report up to 30% higher rebate realizations. Aligning sales motions to vendor scorecards can lift ROI 15–40%, while governance and audit controls reduce rebate dilution and channel conflict by as much as 10–20%.
- rebates: 5–20% of contract value
- bundling: +30% rebate attainment
- sales alignment: ROI +15–40%
- governance: leakage −10–20%
Supply chain risks: tariffs up to 25%, procurement premiums ~20%
Macro slowdown delays 20–30% of refreshes while transformation/security budgets grew ~8–12% (2024); cloud/managed ≈33% of revenue, ~15% CAGR to 2026. CPI ~3.4% and avg hourly earnings +4.1% (2024) squeezed margins; indexed pricing and automation raised utilization ~10–15%. Tech salary inflation 5–8% and a 3.1M cyber workforce gap increase replacement costs; rebates 5–20% materially affect channel profit.
| Metric | Value (2024/2026) |
|---|---|
| Refresh delays | 20–30% |
| Transformation/security budgets | +8–12% YoY |
| Cloud/managed revenue | ~33%; 15% CAGR to 2026 |
| CPI / Avg hourly earnings | 3.4% / +4.1% |
| Salary inflation (tech) | 5–8% |
| Cyber workforce gap | 3.1M |
| Vendor rebates | 5–20% of CV |
Preview Before You Purchase
Insight PESTLE Analysis
The preview shown here is the exact Insight PESTLE Analysis you’ll receive after purchase—fully formatted, professionally structured, and ready to use. This screenshot reflects the real file delivered with no placeholders or edits. After checkout you’ll be able to download the same document immediately.

Make Smarter Strategic Decisions with a Complete PESTEL View
Discover how political, economic, social, technological, legal, and environmental forces are shaping Insight’s strategic horizon in our concise PESTLE briefing. Backed by primary data and expert interpretation, this analysis highlights risks and growth levers you can act on immediately. Purchase the full PESTLE for the complete, editable report and use it to strengthen forecasts, board decks, or investment decisions.
Political factors
Geopolitical supply risks
Global tensions and export controls since 2022 (notably US chip curbs) can delay hardware procurement and services; chokepoints like the Suez Canal (≈12% of global trade) and Strait of Hormuz (≈20% of seaborne oil) amplify risk. Insight’s multi-vendor sourcing must hedge country concentration and logistics bottlenecks after procurement premiums spiked up to ~20% in 2021–22. Scenario planning for sanctions, tariffs and alternative routing preserves margin and uptime, while government clients increasingly favor sovereign vendors under domestic procurement rules.
Public sector IT priorities
Government digital modernization and cybersecurity funding, notably historic boosts across 2024–25, are sustaining demand in defense, healthcare and education; agencies prioritize cloud, zero trust and EI/AI projects. Annual budget cycles and appropriation timing limit bookings visibility and often shift spend into next fiscal year. Vendor registrations, local content and bidding rules materially affect win rates. Contract lead times commonly exceed 12–24 months, requiring disciplined capture management.
Data sovereignty mandates
Rising national data localization rules force architecture choices for cloud and managed services. Insight must align offerings with in-country hosting and compliant hyperscaler regions. Partnering with local data centers can accelerate deals and reduce onboarding time. Non-compliance risks disqualification and penalties up to €20 million or 4% of global turnover under GDPR.
Trade tariffs and taxes
Tariff changes on IT hardware — including spikes up to 25% on select imports in 2024 — can compress gross margins or force price increases for clients; import VAT rates averaging 12–20% across target markets add measurable cost. Customs complexity across 20+ countries raises overhead and lead times; strategic inventory placement and bonded warehousing defer duties and reduce cash outlay. Contract clauses enabling surcharge pass-through can recover up to 100% of unexpected tariff increases where enforceable.
- Tariffs: up to 25% (2024)
- Import VAT: ~12–20% avg
- 20+ countries operational overhead
- Bonded warehousing defers duties, lowers cash needs
- Contracts can pass through up to 100% of surcharges
Political stability in key markets
Elections and policy shifts in 2024 reshaped IT priorities, with global IT spending topping $5 trillion and procurement rules often reprioritised; currency controls and budget freezes routinely delayed vendor rollouts and cloud migrations. Diversified geographic exposure softened shocks while strong local government relations preserved contract continuity during transitions.
- Election-driven procurement changes: higher compliance costs
- Currency controls/budget freezes: project delays reported by ~1 in 5 CIOs (2024)
- Geographic diversification: reduces single-market revenue risk
- Local govt relations: key to continuity
Supply chain risks: tariffs up to 25%, procurement premiums ~20%
Geopolitical export controls (eg US chip curbs) and chokepoints (Suez ≈12% trade; Hormuz ≈20% seaborne oil) raise delivery risk; procurement premiums peaked ~20% in 2021–22. Tariffs reached 25% (2024) and IT spend topped $5T (2024); lead times commonly 12–24 months. Data localization fines up to €20M or 4% turnover force in‑country hosting and local partnerships.
| Metric | Value |
|---|---|
| Procurement premium peak | ~20% |
| Tariffs (2024) | Up to 25% |
| Global IT spend (2024) | $5T |
| Data fines | €20M / 4% turnover |
What is included in the product
Detailed Word Document
Explores how external macro-environmental factors uniquely affect the Insight across six dimensions—Political, Economic, Social, Technological, Environmental, and Legal—backed by current data, forward-looking scenarios, and concrete subpoints to guide executives, investors, and entrepreneurs in identifying opportunities, risks, and actionable strategic responses.
Customizable Excel Spreadsheet
Insight PESTLE provides a clean, visually segmented summary of external risks and opportunities that can be dropped into presentations or shared across teams for quick alignment during planning sessions.
Economic factors
IT spending cycles
Macro slowdown is deferring hardware refresh cycles, with surveys in 2024 showing 20–30% of enterprises delaying non-essential refreshes, while transformation and security budgets remained resilient, rising ~8–12% YoY. Cloud and managed services now account for roughly a third of vendor revenue and deliver stickier recurring margins, growing at ~15% CAGR into 2026. Vertical diversification across healthcare, public and enterprise smooths revenue volatility. Pipeline should tilt to mission-critical, outcome-based deals that preserve ARR.
Inflation and cost pass-through
Component and labor inflation eroded margins in fixed-price services as US CPI averaged about 3.4% in 2024 and average hourly earnings rose ~4.1% y/y, forcing indexed pricing and rate cards—now embedded in roughly 50–70% of new contracts—to recover costs. Automation and offshore delivery boosted utilization by ~10–15%, while vendor rebates and volume tiers typically protect blended gross profit by ~100–300 basis points.
FX volatility
Multi-currency revenue exposes Insight to translation and transaction risk; global FX markets trade about 7.5 trillion USD daily (BIS, Apr 2022), amplifying potential swings. Hedging programs and natural offsets can materially reduce earnings volatility. Pricing in local currency supports competitiveness and demand stability. Central treasury policies must balance hedging costs against operational flexibility.
Labor market tightness
Tight labor markets push cloud, cybersecurity, and data-engineer salaries higher and raise attrition: industry reports through 2024 cite salary growth in tech roles of roughly 5–8% year-over-year and a cybersecurity workforce gap near 3.1 million (ISC2), increasing replacement costs and margin pressure.
Investment in certification pipelines and academies has measurable payoff, while nearshore/offshore talent pools expand capacity at lower cost; strict utilization discipline (billable hours targets) remains critical to protect services margins.
- Salary inflation: ~5–8% (tech roles, 2024)
- Cyber workforce gap: ~3.1M (ISC2, 2024)
- Nearshore/offshore: lower hourly rates, larger candidate pools
- Utilization focus: sustains service margins
Vendor rebate economics
OEM and hyperscaler incentive structures materially affect profitability, with vendor disclosures in 2024 noting rebates often range between 5% and 20% of contract value and accounting for a meaningful share of channel margin. Solution bundling and tier attainment drive back-end rebates—partners achieving tier targets report up to 30% higher rebate realizations. Aligning sales motions to vendor scorecards can lift ROI 15–40%, while governance and audit controls reduce rebate dilution and channel conflict by as much as 10–20%.
- rebates: 5–20% of contract value
- bundling: +30% rebate attainment
- sales alignment: ROI +15–40%
- governance: leakage −10–20%
Supply chain risks: tariffs up to 25%, procurement premiums ~20%
Macro slowdown delays 20–30% of refreshes while transformation/security budgets grew ~8–12% (2024); cloud/managed ≈33% of revenue, ~15% CAGR to 2026. CPI ~3.4% and avg hourly earnings +4.1% (2024) squeezed margins; indexed pricing and automation raised utilization ~10–15%. Tech salary inflation 5–8% and a 3.1M cyber workforce gap increase replacement costs; rebates 5–20% materially affect channel profit.
| Metric | Value (2024/2026) |
|---|---|
| Refresh delays | 20–30% |
| Transformation/security budgets | +8–12% YoY |
| Cloud/managed revenue | ~33%; 15% CAGR to 2026 |
| CPI / Avg hourly earnings | 3.4% / +4.1% |
| Salary inflation (tech) | 5–8% |
| Cyber workforce gap | 3.1M |
| Vendor rebates | 5–20% of CV |
Preview Before You Purchase
Insight PESTLE Analysis
The preview shown here is the exact Insight PESTLE Analysis you’ll receive after purchase—fully formatted, professionally structured, and ready to use. This screenshot reflects the real file delivered with no placeholders or edits. After checkout you’ll be able to download the same document immediately.
Original: $10.00
-65%$10.00
$3.50Description
Make Smarter Strategic Decisions with a Complete PESTEL View
Discover how political, economic, social, technological, legal, and environmental forces are shaping Insight’s strategic horizon in our concise PESTLE briefing. Backed by primary data and expert interpretation, this analysis highlights risks and growth levers you can act on immediately. Purchase the full PESTLE for the complete, editable report and use it to strengthen forecasts, board decks, or investment decisions.
Political factors
Geopolitical supply risks
Global tensions and export controls since 2022 (notably US chip curbs) can delay hardware procurement and services; chokepoints like the Suez Canal (≈12% of global trade) and Strait of Hormuz (≈20% of seaborne oil) amplify risk. Insight’s multi-vendor sourcing must hedge country concentration and logistics bottlenecks after procurement premiums spiked up to ~20% in 2021–22. Scenario planning for sanctions, tariffs and alternative routing preserves margin and uptime, while government clients increasingly favor sovereign vendors under domestic procurement rules.
Public sector IT priorities
Government digital modernization and cybersecurity funding, notably historic boosts across 2024–25, are sustaining demand in defense, healthcare and education; agencies prioritize cloud, zero trust and EI/AI projects. Annual budget cycles and appropriation timing limit bookings visibility and often shift spend into next fiscal year. Vendor registrations, local content and bidding rules materially affect win rates. Contract lead times commonly exceed 12–24 months, requiring disciplined capture management.
Data sovereignty mandates
Rising national data localization rules force architecture choices for cloud and managed services. Insight must align offerings with in-country hosting and compliant hyperscaler regions. Partnering with local data centers can accelerate deals and reduce onboarding time. Non-compliance risks disqualification and penalties up to €20 million or 4% of global turnover under GDPR.
Trade tariffs and taxes
Tariff changes on IT hardware — including spikes up to 25% on select imports in 2024 — can compress gross margins or force price increases for clients; import VAT rates averaging 12–20% across target markets add measurable cost. Customs complexity across 20+ countries raises overhead and lead times; strategic inventory placement and bonded warehousing defer duties and reduce cash outlay. Contract clauses enabling surcharge pass-through can recover up to 100% of unexpected tariff increases where enforceable.
- Tariffs: up to 25% (2024)
- Import VAT: ~12–20% avg
- 20+ countries operational overhead
- Bonded warehousing defers duties, lowers cash needs
- Contracts can pass through up to 100% of surcharges
Political stability in key markets
Elections and policy shifts in 2024 reshaped IT priorities, with global IT spending topping $5 trillion and procurement rules often reprioritised; currency controls and budget freezes routinely delayed vendor rollouts and cloud migrations. Diversified geographic exposure softened shocks while strong local government relations preserved contract continuity during transitions.
- Election-driven procurement changes: higher compliance costs
- Currency controls/budget freezes: project delays reported by ~1 in 5 CIOs (2024)
- Geographic diversification: reduces single-market revenue risk
- Local govt relations: key to continuity
Supply chain risks: tariffs up to 25%, procurement premiums ~20%
Geopolitical export controls (eg US chip curbs) and chokepoints (Suez ≈12% trade; Hormuz ≈20% seaborne oil) raise delivery risk; procurement premiums peaked ~20% in 2021–22. Tariffs reached 25% (2024) and IT spend topped $5T (2024); lead times commonly 12–24 months. Data localization fines up to €20M or 4% turnover force in‑country hosting and local partnerships.
| Metric | Value |
|---|---|
| Procurement premium peak | ~20% |
| Tariffs (2024) | Up to 25% |
| Global IT spend (2024) | $5T |
| Data fines | €20M / 4% turnover |
What is included in the product
Detailed Word Document
Explores how external macro-environmental factors uniquely affect the Insight across six dimensions—Political, Economic, Social, Technological, Environmental, and Legal—backed by current data, forward-looking scenarios, and concrete subpoints to guide executives, investors, and entrepreneurs in identifying opportunities, risks, and actionable strategic responses.
Customizable Excel Spreadsheet
Insight PESTLE provides a clean, visually segmented summary of external risks and opportunities that can be dropped into presentations or shared across teams for quick alignment during planning sessions.
Economic factors
IT spending cycles
Macro slowdown is deferring hardware refresh cycles, with surveys in 2024 showing 20–30% of enterprises delaying non-essential refreshes, while transformation and security budgets remained resilient, rising ~8–12% YoY. Cloud and managed services now account for roughly a third of vendor revenue and deliver stickier recurring margins, growing at ~15% CAGR into 2026. Vertical diversification across healthcare, public and enterprise smooths revenue volatility. Pipeline should tilt to mission-critical, outcome-based deals that preserve ARR.
Inflation and cost pass-through
Component and labor inflation eroded margins in fixed-price services as US CPI averaged about 3.4% in 2024 and average hourly earnings rose ~4.1% y/y, forcing indexed pricing and rate cards—now embedded in roughly 50–70% of new contracts—to recover costs. Automation and offshore delivery boosted utilization by ~10–15%, while vendor rebates and volume tiers typically protect blended gross profit by ~100–300 basis points.
FX volatility
Multi-currency revenue exposes Insight to translation and transaction risk; global FX markets trade about 7.5 trillion USD daily (BIS, Apr 2022), amplifying potential swings. Hedging programs and natural offsets can materially reduce earnings volatility. Pricing in local currency supports competitiveness and demand stability. Central treasury policies must balance hedging costs against operational flexibility.
Labor market tightness
Tight labor markets push cloud, cybersecurity, and data-engineer salaries higher and raise attrition: industry reports through 2024 cite salary growth in tech roles of roughly 5–8% year-over-year and a cybersecurity workforce gap near 3.1 million (ISC2), increasing replacement costs and margin pressure.
Investment in certification pipelines and academies has measurable payoff, while nearshore/offshore talent pools expand capacity at lower cost; strict utilization discipline (billable hours targets) remains critical to protect services margins.
- Salary inflation: ~5–8% (tech roles, 2024)
- Cyber workforce gap: ~3.1M (ISC2, 2024)
- Nearshore/offshore: lower hourly rates, larger candidate pools
- Utilization focus: sustains service margins
Vendor rebate economics
OEM and hyperscaler incentive structures materially affect profitability, with vendor disclosures in 2024 noting rebates often range between 5% and 20% of contract value and accounting for a meaningful share of channel margin. Solution bundling and tier attainment drive back-end rebates—partners achieving tier targets report up to 30% higher rebate realizations. Aligning sales motions to vendor scorecards can lift ROI 15–40%, while governance and audit controls reduce rebate dilution and channel conflict by as much as 10–20%.
- rebates: 5–20% of contract value
- bundling: +30% rebate attainment
- sales alignment: ROI +15–40%
- governance: leakage −10–20%
Supply chain risks: tariffs up to 25%, procurement premiums ~20%
Macro slowdown delays 20–30% of refreshes while transformation/security budgets grew ~8–12% (2024); cloud/managed ≈33% of revenue, ~15% CAGR to 2026. CPI ~3.4% and avg hourly earnings +4.1% (2024) squeezed margins; indexed pricing and automation raised utilization ~10–15%. Tech salary inflation 5–8% and a 3.1M cyber workforce gap increase replacement costs; rebates 5–20% materially affect channel profit.
| Metric | Value (2024/2026) |
|---|---|
| Refresh delays | 20–30% |
| Transformation/security budgets | +8–12% YoY |
| Cloud/managed revenue | ~33%; 15% CAGR to 2026 |
| CPI / Avg hourly earnings | 3.4% / +4.1% |
| Salary inflation (tech) | 5–8% |
| Cyber workforce gap | 3.1M |
| Vendor rebates | 5–20% of CV |
Preview Before You Purchase
Insight PESTLE Analysis
The preview shown here is the exact Insight PESTLE Analysis you’ll receive after purchase—fully formatted, professionally structured, and ready to use. This screenshot reflects the real file delivered with no placeholders or edits. After checkout you’ll be able to download the same document immediately.











