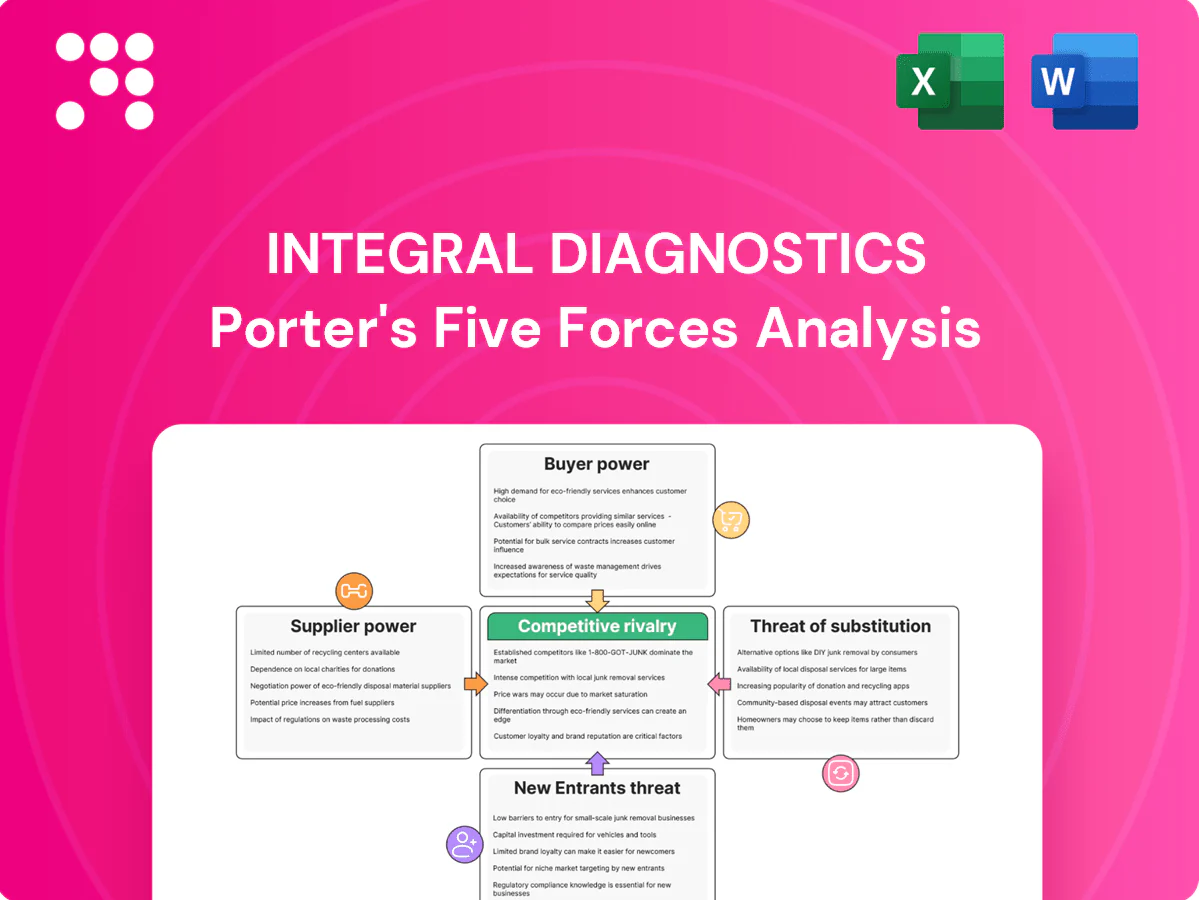
Integral Diagnostics Porter's Five Forces Analysis

Don't Miss the Bigger Picture
Integral Diagnostics’s Porter’s Five Forces analysis distills the competitive dynamics shaping its medical imaging business, from supplier leverage to competitive rivalry and substitute threats. It evaluates buyer power, barriers to entry, and industry intensity to surface strategic risks and growth levers. The summary highlights key vulnerabilities and opportunity areas. Unlock the full report for force-by-force ratings, visuals, and actionable recommendations to inform investment or strategy.
Suppliers Bargaining Power

Concentrated OEM imaging vendors
Imaging hardware is dominated by a few global vendors (GE HealthCare, Siemens Healthineers, Philips, Canon), limiting switching options; the top four held roughly 80% of the market in 2024. Proprietary parts, software and service contracts create strong lock-in, enabling price increases and pushed upgrade cycles. Scale and multi-year (typically 3–5 year) agreements partially mitigate this supplier power.
Specialist radiologist workforce
Specialist radiologists and sonographers are scarce across Australia and New Zealand, and 2024 health workforce reporting confirmed persistent shortfalls, giving talent suppliers strong bargaining leverage over pay and rostering.
Wage inflation in 2024 pushed medical labour costs up roughly 4–6%, with many groups offering signing bonuses and premium rates for night/onsite shifts, squeezing margins.
Flexible scheduling and remote reporting are frequently demanded by recruits, forcing providers to pay premiums or lose capacity.
Integral Diagnostics mitigates risk through expanded training pathways and in-house retention programs to stabilise staffing and contain cost escalation.

Contrast media and consumables
Contrast agents and radioisotopes are concentrated among a few approved suppliers—Bayer, Bracco and Guerbet held roughly 70% of the global contrast-agent market in 2024—so regulatory changes or production outages can quickly spike prices. Short half-life isotopes like Tc-99m (half-life ~6 hours) force just-in-time logistics, increasing dependency and fragility. Multi-sourcing and inventory buffers mitigate shortages but typically raise working capital and storage costs.

PACS/RIS and cloud IT providers
Clinical PACS/RIS and cloud IT are highly sticky—over 90% of radiology departments use PACS, and data migration plus workflow integration create substantial switching costs. Vendors bundle modules and managed services, while cybersecurity and uptime demands (typically 99.99–99.999% SLAs) further entrench suppliers; multi-year SLAs and DICOM/HL7/FHIR interoperability standards help balance bargaining power.
- High stickiness: >90% PACS adoption
- Bundled services raise switching costs
- Cybersecurity & 99.99–99.999% uptime needs
- Multi-year SLAs + DICOM/HL7/FHIR support
Equipment maintenance and facilities
High-end modality uptime depends on OEM or specialist service providers; preventive maintenance contracts are costly and often multi-year—industry data in 2024 indicate service contracts can represent up to 10-15% of equipment lifecycle costs. Prime clinic leases give landlords leverage, while IDX's portfolio scale improves negotiating power and site diversification reduces single-site risk.
- OEM/specialist dependence
- Maintenance 10-15% of lifecycle costs (2024)
- Landlord leverage on premium locations
- Scale enables better service terms and diversification
OEMs ~80%, PACS >90%: supply concentration, wage pressure
Supplier power is high: top-4 imaging OEMs held ~80% of global market in 2024, driving switching costs and service lock-in. Contrast agents concentrated (Bayer/Bracco/Guerbet ~70% in 2024) and Tc-99m just-in-time logistics increase fragility. PACS adoption >90% makes IT sticky; maintenance/service costs run ~10–15% of lifecycle. Medical labour saw ~4–6% wage inflation in 2024, tightening margins.
| Metric | 2024 | Impact |
|---|---|---|
| Top-4 OEM share | ~80% | High price/lock-in |
| Contrast suppliers | ~70% | Supply risk |
| PACS adoption | >90% | High switching cost |
What is included in the product
 Detailed Word Document
Tailored Porter’s Five Forces analysis for Integral Diagnostics uncovering competitive intensity, supplier and buyer power, threat of new entrants and substitutes, and industry dynamics that shape pricing, margins and strategic defenses.

 Customizable Excel Spreadsheet
One-sheet Porter's Five Forces for Integral Diagnostics—clarifies competitive pressures, customizable for new data or regulatory shifts, and export-ready for decks so teams quickly align strategy without complex tools.
Customers Bargaining Power

Referring clinicians concentrate demand
GPs and specialists control patient flow and can steer imaging referrals to preferred providers; in Australia GPs generate over 70% of outpatient imaging referrals, concentrating bargaining power. They demand fast turnarounds and subspecialty reads, with same-day or 24–48 hour reporting increasingly expected. Strong clinician relationships and demonstrated clinical quality are critical to retain referrals, while digital referral platforms (growing double-digit annual adoption in primary care) increase transparency and switching ease.
Public payers and regulators
Medicare (via the MBS) in Australia and public funding in NZ (Te Whatu Ora) set reimbursement levels and fee schedules that cap Integral Diagnostics pricing power; Australia population ~25.9M and NZ ~5.14M (2024) frame payer scale. Pre-authorization rules constrain billing, policy shifts can rapidly change volumes and case mix, making compliance and active advocacy essential.

Private health insurers
Private health insurers, covering roughly 46% of Australians in 2023–24, exert strong bargaining power over Integral Diagnostics by negotiating preferred-provider contracts and rebate levels. They steer members via network design and co-pay structures, pressuring lower episode costs and squeezing imaging margins. Demonstrable quality metrics and rapid access can secure improved contract pricing and guaranteed volumes.

Hospital partners and health systems
Hospital contracts, often retendered every 3–5 years, can be sizable and drive scale economies; buyers demand comprehensive modality coverage and 24/7 service with turnaround KPIs commonly set at 24–48 hours. Price benchmarking and KPI-linked penalties increase margin pressure, while integrated service offerings and joint capital investments (co-located suites, shared equipment) strengthen supplier positioning.
- 3–5 year retenders; 24–48h KPI targets; 24/7 coverage; bundled services/joint investments improve win rates
Price-sensitive patients
Price-sensitive patients often choose providers for non-urgent scans based on out-of-pocket costs, with Integral Diagnostics operating over 60 clinics increasing exposure to comparison shopping.
Visible wait times and online reviews — used by roughly 70% of patients for provider choice — amplify price sensitivity, while bulk-billing availability materially increases demand elasticity.
Convenience, faster booking and perceived quality can offset price focus, preserving margins even when headline pricing is a primary selection factor.
- clinics: over 60
- online-review influence: ~70%
- bulk-billing: increases demand elasticity
- convenience offsets price sensitivity
GPs drive >70% outpatient imaging referrals; clinician relationships and fast subspecialty reports
GPs drive >70% outpatient imaging referrals, so clinician relationships and fast subspecialty reporting are decisive. Medicare MBS and NZ public funding cap pricing while private insurers (≈46% of Australians 2023–24) and hospitals (3–5y retenders, 24–48h KPIs) negotiate rates and volumes. Patients are price- and review-sensitive; Integral Diagnostics operates >60 clinics and faces ~70% online-review influence.
| Metric | Value |
|---|---|
| GP referrals | >70% |
| Australia population (2024) | 25.9M |
| NZ population (2024) | 5.14M |
| Private cover | ≈46% (2023–24) |
| Clinics | >60 |
| Online review influence | ≈70% |
| Hospital retenders / KPI | 3–5y / 24–48h |
What You See Is What You Get
Integral Diagnostics Porter's Five Forces Analysis
This preview displays the exact Integral Diagnostics Porter's Five Forces analysis you'll receive upon purchase—no placeholders or mockups. The full, professionally formatted document is ready for instant download and immediate use once payment is completed. What you see here is precisely what will be delivered.

Don't Miss the Bigger Picture
Integral Diagnostics’s Porter’s Five Forces analysis distills the competitive dynamics shaping its medical imaging business, from supplier leverage to competitive rivalry and substitute threats. It evaluates buyer power, barriers to entry, and industry intensity to surface strategic risks and growth levers. The summary highlights key vulnerabilities and opportunity areas. Unlock the full report for force-by-force ratings, visuals, and actionable recommendations to inform investment or strategy.
Suppliers Bargaining Power
Concentrated OEM imaging vendors
Imaging hardware is dominated by a few global vendors (GE HealthCare, Siemens Healthineers, Philips, Canon), limiting switching options; the top four held roughly 80% of the market in 2024. Proprietary parts, software and service contracts create strong lock-in, enabling price increases and pushed upgrade cycles. Scale and multi-year (typically 3–5 year) agreements partially mitigate this supplier power.
Specialist radiologist workforce
Specialist radiologists and sonographers are scarce across Australia and New Zealand, and 2024 health workforce reporting confirmed persistent shortfalls, giving talent suppliers strong bargaining leverage over pay and rostering.
Wage inflation in 2024 pushed medical labour costs up roughly 4–6%, with many groups offering signing bonuses and premium rates for night/onsite shifts, squeezing margins.
Flexible scheduling and remote reporting are frequently demanded by recruits, forcing providers to pay premiums or lose capacity.
Integral Diagnostics mitigates risk through expanded training pathways and in-house retention programs to stabilise staffing and contain cost escalation.
Contrast media and consumables
Contrast agents and radioisotopes are concentrated among a few approved suppliers—Bayer, Bracco and Guerbet held roughly 70% of the global contrast-agent market in 2024—so regulatory changes or production outages can quickly spike prices. Short half-life isotopes like Tc-99m (half-life ~6 hours) force just-in-time logistics, increasing dependency and fragility. Multi-sourcing and inventory buffers mitigate shortages but typically raise working capital and storage costs.
PACS/RIS and cloud IT providers
Clinical PACS/RIS and cloud IT are highly sticky—over 90% of radiology departments use PACS, and data migration plus workflow integration create substantial switching costs. Vendors bundle modules and managed services, while cybersecurity and uptime demands (typically 99.99–99.999% SLAs) further entrench suppliers; multi-year SLAs and DICOM/HL7/FHIR interoperability standards help balance bargaining power.
- High stickiness: >90% PACS adoption
- Bundled services raise switching costs
- Cybersecurity & 99.99–99.999% uptime needs
- Multi-year SLAs + DICOM/HL7/FHIR support
Equipment maintenance and facilities
High-end modality uptime depends on OEM or specialist service providers; preventive maintenance contracts are costly and often multi-year—industry data in 2024 indicate service contracts can represent up to 10-15% of equipment lifecycle costs. Prime clinic leases give landlords leverage, while IDX's portfolio scale improves negotiating power and site diversification reduces single-site risk.
- OEM/specialist dependence
- Maintenance 10-15% of lifecycle costs (2024)
- Landlord leverage on premium locations
- Scale enables better service terms and diversification
OEMs ~80%, PACS >90%: supply concentration, wage pressure
Supplier power is high: top-4 imaging OEMs held ~80% of global market in 2024, driving switching costs and service lock-in. Contrast agents concentrated (Bayer/Bracco/Guerbet ~70% in 2024) and Tc-99m just-in-time logistics increase fragility. PACS adoption >90% makes IT sticky; maintenance/service costs run ~10–15% of lifecycle. Medical labour saw ~4–6% wage inflation in 2024, tightening margins.
| Metric | 2024 | Impact |
|---|---|---|
| Top-4 OEM share | ~80% | High price/lock-in |
| Contrast suppliers | ~70% | Supply risk |
| PACS adoption | >90% | High switching cost |
What is included in the product
Detailed Word Document
Tailored Porter’s Five Forces analysis for Integral Diagnostics uncovering competitive intensity, supplier and buyer power, threat of new entrants and substitutes, and industry dynamics that shape pricing, margins and strategic defenses.
Customizable Excel Spreadsheet
One-sheet Porter's Five Forces for Integral Diagnostics—clarifies competitive pressures, customizable for new data or regulatory shifts, and export-ready for decks so teams quickly align strategy without complex tools.
Customers Bargaining Power
Referring clinicians concentrate demand
GPs and specialists control patient flow and can steer imaging referrals to preferred providers; in Australia GPs generate over 70% of outpatient imaging referrals, concentrating bargaining power. They demand fast turnarounds and subspecialty reads, with same-day or 24–48 hour reporting increasingly expected. Strong clinician relationships and demonstrated clinical quality are critical to retain referrals, while digital referral platforms (growing double-digit annual adoption in primary care) increase transparency and switching ease.
Public payers and regulators
Medicare (via the MBS) in Australia and public funding in NZ (Te Whatu Ora) set reimbursement levels and fee schedules that cap Integral Diagnostics pricing power; Australia population ~25.9M and NZ ~5.14M (2024) frame payer scale. Pre-authorization rules constrain billing, policy shifts can rapidly change volumes and case mix, making compliance and active advocacy essential.
Private health insurers
Private health insurers, covering roughly 46% of Australians in 2023–24, exert strong bargaining power over Integral Diagnostics by negotiating preferred-provider contracts and rebate levels. They steer members via network design and co-pay structures, pressuring lower episode costs and squeezing imaging margins. Demonstrable quality metrics and rapid access can secure improved contract pricing and guaranteed volumes.
Hospital partners and health systems
Hospital contracts, often retendered every 3–5 years, can be sizable and drive scale economies; buyers demand comprehensive modality coverage and 24/7 service with turnaround KPIs commonly set at 24–48 hours. Price benchmarking and KPI-linked penalties increase margin pressure, while integrated service offerings and joint capital investments (co-located suites, shared equipment) strengthen supplier positioning.
- 3–5 year retenders; 24–48h KPI targets; 24/7 coverage; bundled services/joint investments improve win rates
Price-sensitive patients
Price-sensitive patients often choose providers for non-urgent scans based on out-of-pocket costs, with Integral Diagnostics operating over 60 clinics increasing exposure to comparison shopping.
Visible wait times and online reviews — used by roughly 70% of patients for provider choice — amplify price sensitivity, while bulk-billing availability materially increases demand elasticity.
Convenience, faster booking and perceived quality can offset price focus, preserving margins even when headline pricing is a primary selection factor.
- clinics: over 60
- online-review influence: ~70%
- bulk-billing: increases demand elasticity
- convenience offsets price sensitivity
GPs drive >70% outpatient imaging referrals; clinician relationships and fast subspecialty reports
GPs drive >70% outpatient imaging referrals, so clinician relationships and fast subspecialty reporting are decisive. Medicare MBS and NZ public funding cap pricing while private insurers (≈46% of Australians 2023–24) and hospitals (3–5y retenders, 24–48h KPIs) negotiate rates and volumes. Patients are price- and review-sensitive; Integral Diagnostics operates >60 clinics and faces ~70% online-review influence.
| Metric | Value |
|---|---|
| GP referrals | >70% |
| Australia population (2024) | 25.9M |
| NZ population (2024) | 5.14M |
| Private cover | ≈46% (2023–24) |
| Clinics | >60 |
| Online review influence | ≈70% |
| Hospital retenders / KPI | 3–5y / 24–48h |
What You See Is What You Get
Integral Diagnostics Porter's Five Forces Analysis
This preview displays the exact Integral Diagnostics Porter's Five Forces analysis you'll receive upon purchase—no placeholders or mockups. The full, professionally formatted document is ready for instant download and immediate use once payment is completed. What you see here is precisely what will be delivered.
Description
Don't Miss the Bigger Picture
Integral Diagnostics’s Porter’s Five Forces analysis distills the competitive dynamics shaping its medical imaging business, from supplier leverage to competitive rivalry and substitute threats. It evaluates buyer power, barriers to entry, and industry intensity to surface strategic risks and growth levers. The summary highlights key vulnerabilities and opportunity areas. Unlock the full report for force-by-force ratings, visuals, and actionable recommendations to inform investment or strategy.
Suppliers Bargaining Power
Concentrated OEM imaging vendors
Imaging hardware is dominated by a few global vendors (GE HealthCare, Siemens Healthineers, Philips, Canon), limiting switching options; the top four held roughly 80% of the market in 2024. Proprietary parts, software and service contracts create strong lock-in, enabling price increases and pushed upgrade cycles. Scale and multi-year (typically 3–5 year) agreements partially mitigate this supplier power.
Specialist radiologist workforce
Specialist radiologists and sonographers are scarce across Australia and New Zealand, and 2024 health workforce reporting confirmed persistent shortfalls, giving talent suppliers strong bargaining leverage over pay and rostering.
Wage inflation in 2024 pushed medical labour costs up roughly 4–6%, with many groups offering signing bonuses and premium rates for night/onsite shifts, squeezing margins.
Flexible scheduling and remote reporting are frequently demanded by recruits, forcing providers to pay premiums or lose capacity.
Integral Diagnostics mitigates risk through expanded training pathways and in-house retention programs to stabilise staffing and contain cost escalation.
Contrast media and consumables
Contrast agents and radioisotopes are concentrated among a few approved suppliers—Bayer, Bracco and Guerbet held roughly 70% of the global contrast-agent market in 2024—so regulatory changes or production outages can quickly spike prices. Short half-life isotopes like Tc-99m (half-life ~6 hours) force just-in-time logistics, increasing dependency and fragility. Multi-sourcing and inventory buffers mitigate shortages but typically raise working capital and storage costs.
PACS/RIS and cloud IT providers
Clinical PACS/RIS and cloud IT are highly sticky—over 90% of radiology departments use PACS, and data migration plus workflow integration create substantial switching costs. Vendors bundle modules and managed services, while cybersecurity and uptime demands (typically 99.99–99.999% SLAs) further entrench suppliers; multi-year SLAs and DICOM/HL7/FHIR interoperability standards help balance bargaining power.
- High stickiness: >90% PACS adoption
- Bundled services raise switching costs
- Cybersecurity & 99.99–99.999% uptime needs
- Multi-year SLAs + DICOM/HL7/FHIR support
Equipment maintenance and facilities
High-end modality uptime depends on OEM or specialist service providers; preventive maintenance contracts are costly and often multi-year—industry data in 2024 indicate service contracts can represent up to 10-15% of equipment lifecycle costs. Prime clinic leases give landlords leverage, while IDX's portfolio scale improves negotiating power and site diversification reduces single-site risk.
- OEM/specialist dependence
- Maintenance 10-15% of lifecycle costs (2024)
- Landlord leverage on premium locations
- Scale enables better service terms and diversification
OEMs ~80%, PACS >90%: supply concentration, wage pressure
Supplier power is high: top-4 imaging OEMs held ~80% of global market in 2024, driving switching costs and service lock-in. Contrast agents concentrated (Bayer/Bracco/Guerbet ~70% in 2024) and Tc-99m just-in-time logistics increase fragility. PACS adoption >90% makes IT sticky; maintenance/service costs run ~10–15% of lifecycle. Medical labour saw ~4–6% wage inflation in 2024, tightening margins.
| Metric | 2024 | Impact |
|---|---|---|
| Top-4 OEM share | ~80% | High price/lock-in |
| Contrast suppliers | ~70% | Supply risk |
| PACS adoption | >90% | High switching cost |
What is included in the product
Detailed Word Document
Tailored Porter’s Five Forces analysis for Integral Diagnostics uncovering competitive intensity, supplier and buyer power, threat of new entrants and substitutes, and industry dynamics that shape pricing, margins and strategic defenses.
Customizable Excel Spreadsheet
One-sheet Porter's Five Forces for Integral Diagnostics—clarifies competitive pressures, customizable for new data or regulatory shifts, and export-ready for decks so teams quickly align strategy without complex tools.
Customers Bargaining Power
Referring clinicians concentrate demand
GPs and specialists control patient flow and can steer imaging referrals to preferred providers; in Australia GPs generate over 70% of outpatient imaging referrals, concentrating bargaining power. They demand fast turnarounds and subspecialty reads, with same-day or 24–48 hour reporting increasingly expected. Strong clinician relationships and demonstrated clinical quality are critical to retain referrals, while digital referral platforms (growing double-digit annual adoption in primary care) increase transparency and switching ease.
Public payers and regulators
Medicare (via the MBS) in Australia and public funding in NZ (Te Whatu Ora) set reimbursement levels and fee schedules that cap Integral Diagnostics pricing power; Australia population ~25.9M and NZ ~5.14M (2024) frame payer scale. Pre-authorization rules constrain billing, policy shifts can rapidly change volumes and case mix, making compliance and active advocacy essential.
Private health insurers
Private health insurers, covering roughly 46% of Australians in 2023–24, exert strong bargaining power over Integral Diagnostics by negotiating preferred-provider contracts and rebate levels. They steer members via network design and co-pay structures, pressuring lower episode costs and squeezing imaging margins. Demonstrable quality metrics and rapid access can secure improved contract pricing and guaranteed volumes.
Hospital partners and health systems
Hospital contracts, often retendered every 3–5 years, can be sizable and drive scale economies; buyers demand comprehensive modality coverage and 24/7 service with turnaround KPIs commonly set at 24–48 hours. Price benchmarking and KPI-linked penalties increase margin pressure, while integrated service offerings and joint capital investments (co-located suites, shared equipment) strengthen supplier positioning.
- 3–5 year retenders; 24–48h KPI targets; 24/7 coverage; bundled services/joint investments improve win rates
Price-sensitive patients
Price-sensitive patients often choose providers for non-urgent scans based on out-of-pocket costs, with Integral Diagnostics operating over 60 clinics increasing exposure to comparison shopping.
Visible wait times and online reviews — used by roughly 70% of patients for provider choice — amplify price sensitivity, while bulk-billing availability materially increases demand elasticity.
Convenience, faster booking and perceived quality can offset price focus, preserving margins even when headline pricing is a primary selection factor.
- clinics: over 60
- online-review influence: ~70%
- bulk-billing: increases demand elasticity
- convenience offsets price sensitivity
GPs drive >70% outpatient imaging referrals; clinician relationships and fast subspecialty reports
GPs drive >70% outpatient imaging referrals, so clinician relationships and fast subspecialty reporting are decisive. Medicare MBS and NZ public funding cap pricing while private insurers (≈46% of Australians 2023–24) and hospitals (3–5y retenders, 24–48h KPIs) negotiate rates and volumes. Patients are price- and review-sensitive; Integral Diagnostics operates >60 clinics and faces ~70% online-review influence.
| Metric | Value |
|---|---|
| GP referrals | >70% |
| Australia population (2024) | 25.9M |
| NZ population (2024) | 5.14M |
| Private cover | ≈46% (2023–24) |
| Clinics | >60 |
| Online review influence | ≈70% |
| Hospital retenders / KPI | 3–5y / 24–48h |
What You See Is What You Get
Integral Diagnostics Porter's Five Forces Analysis
This preview displays the exact Integral Diagnostics Porter's Five Forces analysis you'll receive upon purchase—no placeholders or mockups. The full, professionally formatted document is ready for instant download and immediate use once payment is completed. What you see here is precisely what will be delivered.











