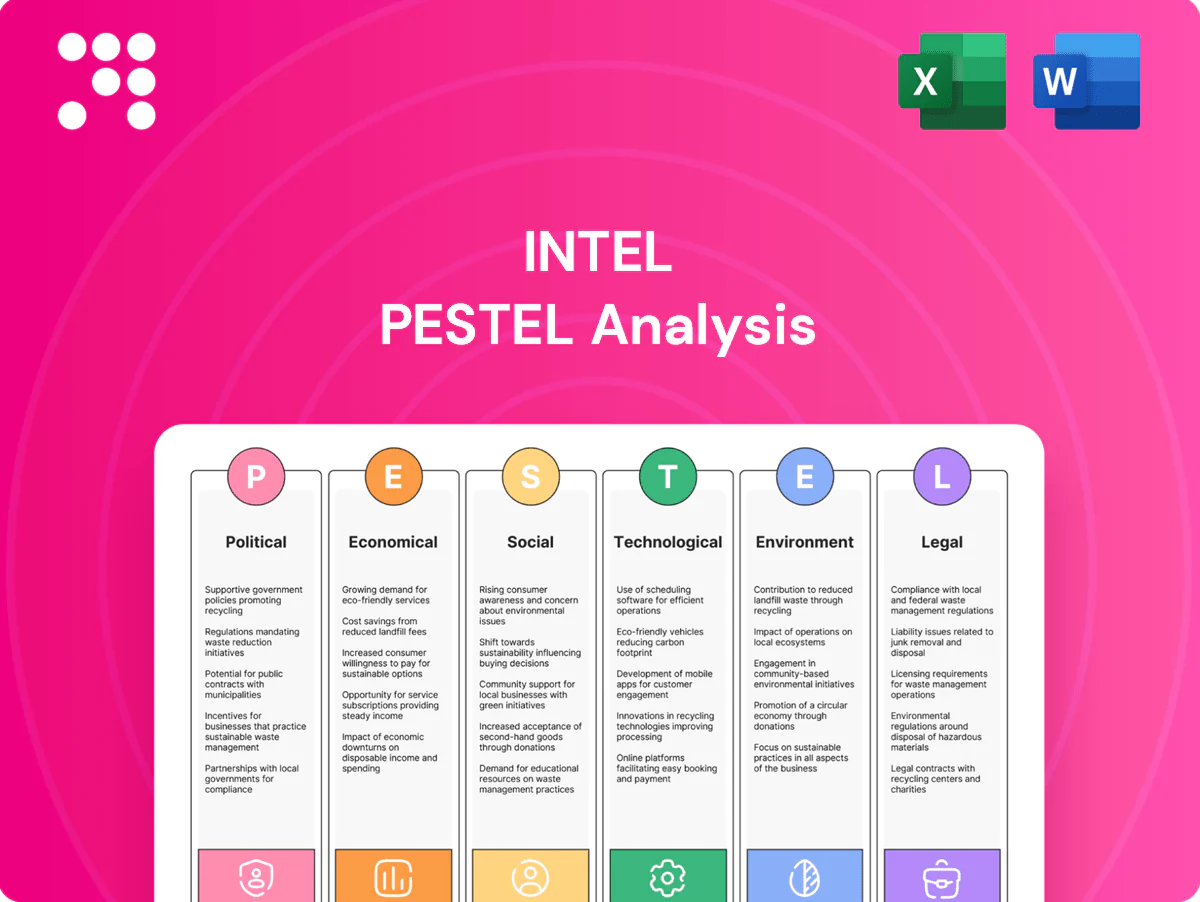
Intel PESTLE Analysis

Plan Smarter. Present Sharper. Compete Stronger.
Gain a competitive edge with our PESTLE Analysis of Intel—three concise sections reveal how political, economic, social, technological, legal, and environmental forces shape Intel’s strategy and risk profile. Ideal for investors, consultants, and strategists, this report turns complex trends into actionable decisions. Purchase the full, editable analysis to download detailed insights and forecast Intel’s next moves.
Political factors

US industrial policy and subsidies
The CHIPS and Science Act, which authorized about $52.7 billion in semiconductor incentives, directly improves Intel’s capex economics for its roughly $20 billion Ohio fab program by enabling billions in grants and tax credits that can raise ROI and hasten node ramps. Meeting compliance milestones and creating promised jobs remains under tight political scrutiny, and post-election policy shifts could change funding cadence and timelines.
Export controls and geopolitics
US export controls introduced in 2022–2024 restricting advanced logic-node chips, HBM and certain tool sales to China directly affect Intel’s data-center and AI addressable market and complicate its foundry customer mix. Compliance raises operating and licensing costs and may cap growth in a key region that previously contributed materially to demand. Heightened US–China tensions and the fact Taiwan supplies ~92% of leading-edge capacity force contingency planning and customer design shifts. Sudden licensing changes can abruptly redirect revenue streams.

Allied reshoring and regionalization
EU, US and allied drives for semiconductor sovereignty — backed by the US CHIPS Act ($52 billion) and the EU mobilization plan (~€43 billion) — prioritize local capacity and secure chains. Intel stands to gain from these US and EU fab incentives while facing customer localization requests that complicate global procurement. Regional duplication raises fixed costs and capital intensity even as it trims geopolitical exposure; Intel’s capex guidance (~$25–27B in 2024) reflects this shift. Vendor qualification increasingly mandates demonstrable political resilience and onshore presence.

Government procurement and standards influence
Defense and public-sector demand for secure, onshore compute creates premium segments for Intel, supported by the US CHIPS Act which authorized roughly 52 billion USD for domestic semiconductor incentives. Participation in standards bodies and security certifications materially influences design wins with government customers. Increasing requirements for supply-chain traceability and trusted manufacturing serve as a differentiator against offshore supply chains.
- CHIPS Act: 52 billion USD in incentives
- Onshore manufacturing = premium, higher-margin contracts
- Standards/certs drive design-win probability
- Traceability/trusted fabs differentiate from offshore
Trade policy, tariffs, and visas
Tariffs on equipment and materials can raise Intel’s bill of materials and delay fab construction; CHIPS Act funding of 52.7 billion USD shifts incentive balances. Visa limits (H‑1B cap 85,000) and changing immigration rules constrain staffing for fabs and R&D. Global minimum tax (Pillar Two at 15%) and cross‑border tax regimes force faster supply‑chain redesigns, so shifts can rapidly alter cost structure.
- Tariffs raise BOM costs and schedule risk
- H‑1B cap 85,000 limits talent mobility
- Pillar Two 15% alters tax planning
US CHIPS Act ($52.7B) & EU €43B spur onshore capex; export controls restrict China access
US CHIPS Act ($52.7B) and EU ~€43B accelerate onshore capex, supporting Intel’s $25–27B 2024 guidance but raising regional duplication costs; export controls (2022–24) and US‑China tensions limit China market access; Taiwan supplies ~92% of leading‑edge capacity, prompting supply‑chain diversification; H‑1B cap 85,000 and Pillar Two 15% tax affect talent and tax planning.
| Factor | Impact | Key data |
|---|---|---|
| Subsidies | Boosts ROI | $52.7B (US), €43B (EU) |
| Export controls | Limits China sales | 2022–24 restrictions |
| Talent/Tax | Constrains hires, raises tax burden | H‑1B 85,000; Pillar Two 15% |
What is included in the product
 Detailed Word Document
Explores how macro-environmental forces uniquely impact Intel across Political, Economic, Social, Technological, Environmental and Legal dimensions, with data-driven trends, forward-looking insights and actionable implications to guide executives, investors and strategists.

 Customizable Excel Spreadsheet
Condensed Intel PESTLE summary, visually segmented by category for quick interpretation, editable for regional or business-line notes and easily dropped into PowerPoints or shared across teams to streamline risk discussions and strategic planning.
Economic factors

AI and data center investment cycle
Surging AI/accelerator demand is shifting server silicon mix toward accelerators, raising memory bandwidth and platform attach; IDC estimated worldwide AI systems spending at $154 billion in 2024. Intel’s CPU, accelerator and Ethernet portfolios position it to capture hyperscaler and enterprise capex cycles. Timing of AI ROI can amplify or delay orders. Backlogs and multi-month lead times drive quarterly revenue volatility for Intel.
PC refresh and enterprise spend
PC demand remains cyclical with refresh waves tied to Windows transitions and hybrid work; global PC shipments fell ≈5% in 2024 while commercial share stayed near 55%, keeping ASPs supported by enterprise upgrades. Weak consumer cycles compressed margins and pressured channel pricing, so inventory health is vital to avoid price erosion. Growth in embedded and edge PCs—accelerating in industrial and retail—adds resilience to Intel’s client mix.

Interest rates and capital intensity
Higher interest rates (Fed funds ~5.25–5.50% in mid‑2025) lift WACC and strain multiyear fab returns, while lower rates improve project NPV and debt affordability for mega‑fabs and High‑NA EUV tools. Intel reported $18.6bn capex in 2023 and maintains front‑loaded spending, so financing conditions materially affect free cash flow; CHIPS Act support of up to $8.5bn can bridge timing gaps.

Supply chain costs and currencies
Material, specialty-chemical and semiconductor-grade gas costs materially raise wafer cost profiles; critical lithography tools (ASML EUV ~€150 million per tool) have lead times >12 months, constraining node transitions and capacity.
FX swings affect Intel’s USD-reported results because sales and inputs are exposed to EUR and Asian currencies; hedging reduces but cannot eliminate volatility.
- Material/gas: raise per-wafer costs
- ASML EUV: ~€150 million, >12-month lead times
- FX: USD reporting, EUR/Asian exposure
- Hedging: mitigates but not removes risk
Competition and pricing dynamics
Price/performance gains from TSMC and Samsung — TSMC held roughly 54% of global foundry revenue in 2024 with capex near US$36B — and momentum in the AMD/ARM ecosystem have pressured ASPs and share, forcing Intel Foundry Services to trade lower pricing for utilization while yield learning curves materially affect gross margin.
- TSMC ~54% foundry share (2024)
- TSMC capex ~US$36B (2024)
- AMD revenue ~US$23.6B (2024)
- Customer consolidation raises bargaining power
US CHIPS Act ($52.7B) & EU €43B spur onshore capex; export controls restrict China access
Surging AI spend ($154bn 2024) shifts server mix to accelerators, raising memory attach and quarterly revenue volatility. PC shipments fell ≈5% in 2024, commercial share ~55% supporting ASPs but consumer weakness pressures margins. Higher rates (Fed funds ~5.25–5.50% mid‑2025) raise WACC; Intel capex front‑loaded ($18.6bn 2023) with CHIPS support up to $8.5bn. Supply costs: ASML EUV ~€150m/tool; TSMC ~54% foundry share, capex ~$36bn (2024).
| Metric | Value |
|---|---|
| AI spend 2024 | $154bn |
| PC shipments 2024 | -≈5% |
| Fed funds mid‑2025 | ~5.25–5.50% |
| Intel capex 2023 | $18.6bn |
| CHIPS support | up to $8.5bn |
| ASML EUV | ~€150m/tool |
| TSMC foundry 2024 | ~54%; capex ~$36bn |
Preview Before You Purchase
Intel PESTLE Analysis
The preview shown here is the exact Intel PESTLE Analysis document you’ll receive after purchase—fully formatted and ready to use. The content, layout, and insights on political, economic, social, technological, legal, and environmental factors are final. No placeholders, no surprises—download the same file you see now.

Plan Smarter. Present Sharper. Compete Stronger.
Gain a competitive edge with our PESTLE Analysis of Intel—three concise sections reveal how political, economic, social, technological, legal, and environmental forces shape Intel’s strategy and risk profile. Ideal for investors, consultants, and strategists, this report turns complex trends into actionable decisions. Purchase the full, editable analysis to download detailed insights and forecast Intel’s next moves.
Political factors
US industrial policy and subsidies
The CHIPS and Science Act, which authorized about $52.7 billion in semiconductor incentives, directly improves Intel’s capex economics for its roughly $20 billion Ohio fab program by enabling billions in grants and tax credits that can raise ROI and hasten node ramps. Meeting compliance milestones and creating promised jobs remains under tight political scrutiny, and post-election policy shifts could change funding cadence and timelines.
Export controls and geopolitics
US export controls introduced in 2022–2024 restricting advanced logic-node chips, HBM and certain tool sales to China directly affect Intel’s data-center and AI addressable market and complicate its foundry customer mix. Compliance raises operating and licensing costs and may cap growth in a key region that previously contributed materially to demand. Heightened US–China tensions and the fact Taiwan supplies ~92% of leading-edge capacity force contingency planning and customer design shifts. Sudden licensing changes can abruptly redirect revenue streams.
Allied reshoring and regionalization
EU, US and allied drives for semiconductor sovereignty — backed by the US CHIPS Act ($52 billion) and the EU mobilization plan (~€43 billion) — prioritize local capacity and secure chains. Intel stands to gain from these US and EU fab incentives while facing customer localization requests that complicate global procurement. Regional duplication raises fixed costs and capital intensity even as it trims geopolitical exposure; Intel’s capex guidance (~$25–27B in 2024) reflects this shift. Vendor qualification increasingly mandates demonstrable political resilience and onshore presence.
Government procurement and standards influence
Defense and public-sector demand for secure, onshore compute creates premium segments for Intel, supported by the US CHIPS Act which authorized roughly 52 billion USD for domestic semiconductor incentives. Participation in standards bodies and security certifications materially influences design wins with government customers. Increasing requirements for supply-chain traceability and trusted manufacturing serve as a differentiator against offshore supply chains.
- CHIPS Act: 52 billion USD in incentives
- Onshore manufacturing = premium, higher-margin contracts
- Standards/certs drive design-win probability
- Traceability/trusted fabs differentiate from offshore
Trade policy, tariffs, and visas
Tariffs on equipment and materials can raise Intel’s bill of materials and delay fab construction; CHIPS Act funding of 52.7 billion USD shifts incentive balances. Visa limits (H‑1B cap 85,000) and changing immigration rules constrain staffing for fabs and R&D. Global minimum tax (Pillar Two at 15%) and cross‑border tax regimes force faster supply‑chain redesigns, so shifts can rapidly alter cost structure.
- Tariffs raise BOM costs and schedule risk
- H‑1B cap 85,000 limits talent mobility
- Pillar Two 15% alters tax planning
US CHIPS Act ($52.7B) & EU €43B spur onshore capex; export controls restrict China access
US CHIPS Act ($52.7B) and EU ~€43B accelerate onshore capex, supporting Intel’s $25–27B 2024 guidance but raising regional duplication costs; export controls (2022–24) and US‑China tensions limit China market access; Taiwan supplies ~92% of leading‑edge capacity, prompting supply‑chain diversification; H‑1B cap 85,000 and Pillar Two 15% tax affect talent and tax planning.
| Factor | Impact | Key data |
|---|---|---|
| Subsidies | Boosts ROI | $52.7B (US), €43B (EU) |
| Export controls | Limits China sales | 2022–24 restrictions |
| Talent/Tax | Constrains hires, raises tax burden | H‑1B 85,000; Pillar Two 15% |
What is included in the product
Detailed Word Document
Explores how macro-environmental forces uniquely impact Intel across Political, Economic, Social, Technological, Environmental and Legal dimensions, with data-driven trends, forward-looking insights and actionable implications to guide executives, investors and strategists.
Customizable Excel Spreadsheet
Condensed Intel PESTLE summary, visually segmented by category for quick interpretation, editable for regional or business-line notes and easily dropped into PowerPoints or shared across teams to streamline risk discussions and strategic planning.
Economic factors
AI and data center investment cycle
Surging AI/accelerator demand is shifting server silicon mix toward accelerators, raising memory bandwidth and platform attach; IDC estimated worldwide AI systems spending at $154 billion in 2024. Intel’s CPU, accelerator and Ethernet portfolios position it to capture hyperscaler and enterprise capex cycles. Timing of AI ROI can amplify or delay orders. Backlogs and multi-month lead times drive quarterly revenue volatility for Intel.
PC refresh and enterprise spend
PC demand remains cyclical with refresh waves tied to Windows transitions and hybrid work; global PC shipments fell ≈5% in 2024 while commercial share stayed near 55%, keeping ASPs supported by enterprise upgrades. Weak consumer cycles compressed margins and pressured channel pricing, so inventory health is vital to avoid price erosion. Growth in embedded and edge PCs—accelerating in industrial and retail—adds resilience to Intel’s client mix.
Interest rates and capital intensity
Higher interest rates (Fed funds ~5.25–5.50% in mid‑2025) lift WACC and strain multiyear fab returns, while lower rates improve project NPV and debt affordability for mega‑fabs and High‑NA EUV tools. Intel reported $18.6bn capex in 2023 and maintains front‑loaded spending, so financing conditions materially affect free cash flow; CHIPS Act support of up to $8.5bn can bridge timing gaps.
Supply chain costs and currencies
Material, specialty-chemical and semiconductor-grade gas costs materially raise wafer cost profiles; critical lithography tools (ASML EUV ~€150 million per tool) have lead times >12 months, constraining node transitions and capacity.
FX swings affect Intel’s USD-reported results because sales and inputs are exposed to EUR and Asian currencies; hedging reduces but cannot eliminate volatility.
- Material/gas: raise per-wafer costs
- ASML EUV: ~€150 million, >12-month lead times
- FX: USD reporting, EUR/Asian exposure
- Hedging: mitigates but not removes risk
Competition and pricing dynamics
Price/performance gains from TSMC and Samsung — TSMC held roughly 54% of global foundry revenue in 2024 with capex near US$36B — and momentum in the AMD/ARM ecosystem have pressured ASPs and share, forcing Intel Foundry Services to trade lower pricing for utilization while yield learning curves materially affect gross margin.
- TSMC ~54% foundry share (2024)
- TSMC capex ~US$36B (2024)
- AMD revenue ~US$23.6B (2024)
- Customer consolidation raises bargaining power
US CHIPS Act ($52.7B) & EU €43B spur onshore capex; export controls restrict China access
Surging AI spend ($154bn 2024) shifts server mix to accelerators, raising memory attach and quarterly revenue volatility. PC shipments fell ≈5% in 2024, commercial share ~55% supporting ASPs but consumer weakness pressures margins. Higher rates (Fed funds ~5.25–5.50% mid‑2025) raise WACC; Intel capex front‑loaded ($18.6bn 2023) with CHIPS support up to $8.5bn. Supply costs: ASML EUV ~€150m/tool; TSMC ~54% foundry share, capex ~$36bn (2024).
| Metric | Value |
|---|---|
| AI spend 2024 | $154bn |
| PC shipments 2024 | -≈5% |
| Fed funds mid‑2025 | ~5.25–5.50% |
| Intel capex 2023 | $18.6bn |
| CHIPS support | up to $8.5bn |
| ASML EUV | ~€150m/tool |
| TSMC foundry 2024 | ~54%; capex ~$36bn |
Preview Before You Purchase
Intel PESTLE Analysis
The preview shown here is the exact Intel PESTLE Analysis document you’ll receive after purchase—fully formatted and ready to use. The content, layout, and insights on political, economic, social, technological, legal, and environmental factors are final. No placeholders, no surprises—download the same file you see now.
Description
Plan Smarter. Present Sharper. Compete Stronger.
Gain a competitive edge with our PESTLE Analysis of Intel—three concise sections reveal how political, economic, social, technological, legal, and environmental forces shape Intel’s strategy and risk profile. Ideal for investors, consultants, and strategists, this report turns complex trends into actionable decisions. Purchase the full, editable analysis to download detailed insights and forecast Intel’s next moves.
Political factors
US industrial policy and subsidies
The CHIPS and Science Act, which authorized about $52.7 billion in semiconductor incentives, directly improves Intel’s capex economics for its roughly $20 billion Ohio fab program by enabling billions in grants and tax credits that can raise ROI and hasten node ramps. Meeting compliance milestones and creating promised jobs remains under tight political scrutiny, and post-election policy shifts could change funding cadence and timelines.
Export controls and geopolitics
US export controls introduced in 2022–2024 restricting advanced logic-node chips, HBM and certain tool sales to China directly affect Intel’s data-center and AI addressable market and complicate its foundry customer mix. Compliance raises operating and licensing costs and may cap growth in a key region that previously contributed materially to demand. Heightened US–China tensions and the fact Taiwan supplies ~92% of leading-edge capacity force contingency planning and customer design shifts. Sudden licensing changes can abruptly redirect revenue streams.
Allied reshoring and regionalization
EU, US and allied drives for semiconductor sovereignty — backed by the US CHIPS Act ($52 billion) and the EU mobilization plan (~€43 billion) — prioritize local capacity and secure chains. Intel stands to gain from these US and EU fab incentives while facing customer localization requests that complicate global procurement. Regional duplication raises fixed costs and capital intensity even as it trims geopolitical exposure; Intel’s capex guidance (~$25–27B in 2024) reflects this shift. Vendor qualification increasingly mandates demonstrable political resilience and onshore presence.
Government procurement and standards influence
Defense and public-sector demand for secure, onshore compute creates premium segments for Intel, supported by the US CHIPS Act which authorized roughly 52 billion USD for domestic semiconductor incentives. Participation in standards bodies and security certifications materially influences design wins with government customers. Increasing requirements for supply-chain traceability and trusted manufacturing serve as a differentiator against offshore supply chains.
- CHIPS Act: 52 billion USD in incentives
- Onshore manufacturing = premium, higher-margin contracts
- Standards/certs drive design-win probability
- Traceability/trusted fabs differentiate from offshore
Trade policy, tariffs, and visas
Tariffs on equipment and materials can raise Intel’s bill of materials and delay fab construction; CHIPS Act funding of 52.7 billion USD shifts incentive balances. Visa limits (H‑1B cap 85,000) and changing immigration rules constrain staffing for fabs and R&D. Global minimum tax (Pillar Two at 15%) and cross‑border tax regimes force faster supply‑chain redesigns, so shifts can rapidly alter cost structure.
- Tariffs raise BOM costs and schedule risk
- H‑1B cap 85,000 limits talent mobility
- Pillar Two 15% alters tax planning
US CHIPS Act ($52.7B) & EU €43B spur onshore capex; export controls restrict China access
US CHIPS Act ($52.7B) and EU ~€43B accelerate onshore capex, supporting Intel’s $25–27B 2024 guidance but raising regional duplication costs; export controls (2022–24) and US‑China tensions limit China market access; Taiwan supplies ~92% of leading‑edge capacity, prompting supply‑chain diversification; H‑1B cap 85,000 and Pillar Two 15% tax affect talent and tax planning.
| Factor | Impact | Key data |
|---|---|---|
| Subsidies | Boosts ROI | $52.7B (US), €43B (EU) |
| Export controls | Limits China sales | 2022–24 restrictions |
| Talent/Tax | Constrains hires, raises tax burden | H‑1B 85,000; Pillar Two 15% |
What is included in the product
Detailed Word Document
Explores how macro-environmental forces uniquely impact Intel across Political, Economic, Social, Technological, Environmental and Legal dimensions, with data-driven trends, forward-looking insights and actionable implications to guide executives, investors and strategists.
Customizable Excel Spreadsheet
Condensed Intel PESTLE summary, visually segmented by category for quick interpretation, editable for regional or business-line notes and easily dropped into PowerPoints or shared across teams to streamline risk discussions and strategic planning.
Economic factors
AI and data center investment cycle
Surging AI/accelerator demand is shifting server silicon mix toward accelerators, raising memory bandwidth and platform attach; IDC estimated worldwide AI systems spending at $154 billion in 2024. Intel’s CPU, accelerator and Ethernet portfolios position it to capture hyperscaler and enterprise capex cycles. Timing of AI ROI can amplify or delay orders. Backlogs and multi-month lead times drive quarterly revenue volatility for Intel.
PC refresh and enterprise spend
PC demand remains cyclical with refresh waves tied to Windows transitions and hybrid work; global PC shipments fell ≈5% in 2024 while commercial share stayed near 55%, keeping ASPs supported by enterprise upgrades. Weak consumer cycles compressed margins and pressured channel pricing, so inventory health is vital to avoid price erosion. Growth in embedded and edge PCs—accelerating in industrial and retail—adds resilience to Intel’s client mix.
Interest rates and capital intensity
Higher interest rates (Fed funds ~5.25–5.50% in mid‑2025) lift WACC and strain multiyear fab returns, while lower rates improve project NPV and debt affordability for mega‑fabs and High‑NA EUV tools. Intel reported $18.6bn capex in 2023 and maintains front‑loaded spending, so financing conditions materially affect free cash flow; CHIPS Act support of up to $8.5bn can bridge timing gaps.
Supply chain costs and currencies
Material, specialty-chemical and semiconductor-grade gas costs materially raise wafer cost profiles; critical lithography tools (ASML EUV ~€150 million per tool) have lead times >12 months, constraining node transitions and capacity.
FX swings affect Intel’s USD-reported results because sales and inputs are exposed to EUR and Asian currencies; hedging reduces but cannot eliminate volatility.
- Material/gas: raise per-wafer costs
- ASML EUV: ~€150 million, >12-month lead times
- FX: USD reporting, EUR/Asian exposure
- Hedging: mitigates but not removes risk
Competition and pricing dynamics
Price/performance gains from TSMC and Samsung — TSMC held roughly 54% of global foundry revenue in 2024 with capex near US$36B — and momentum in the AMD/ARM ecosystem have pressured ASPs and share, forcing Intel Foundry Services to trade lower pricing for utilization while yield learning curves materially affect gross margin.
- TSMC ~54% foundry share (2024)
- TSMC capex ~US$36B (2024)
- AMD revenue ~US$23.6B (2024)
- Customer consolidation raises bargaining power
US CHIPS Act ($52.7B) & EU €43B spur onshore capex; export controls restrict China access
Surging AI spend ($154bn 2024) shifts server mix to accelerators, raising memory attach and quarterly revenue volatility. PC shipments fell ≈5% in 2024, commercial share ~55% supporting ASPs but consumer weakness pressures margins. Higher rates (Fed funds ~5.25–5.50% mid‑2025) raise WACC; Intel capex front‑loaded ($18.6bn 2023) with CHIPS support up to $8.5bn. Supply costs: ASML EUV ~€150m/tool; TSMC ~54% foundry share, capex ~$36bn (2024).
| Metric | Value |
|---|---|
| AI spend 2024 | $154bn |
| PC shipments 2024 | -≈5% |
| Fed funds mid‑2025 | ~5.25–5.50% |
| Intel capex 2023 | $18.6bn |
| CHIPS support | up to $8.5bn |
| ASML EUV | ~€150m/tool |
| TSMC foundry 2024 | ~54%; capex ~$36bn |
Preview Before You Purchase
Intel PESTLE Analysis
The preview shown here is the exact Intel PESTLE Analysis document you’ll receive after purchase—fully formatted and ready to use. The content, layout, and insights on political, economic, social, technological, legal, and environmental factors are final. No placeholders, no surprises—download the same file you see now.











