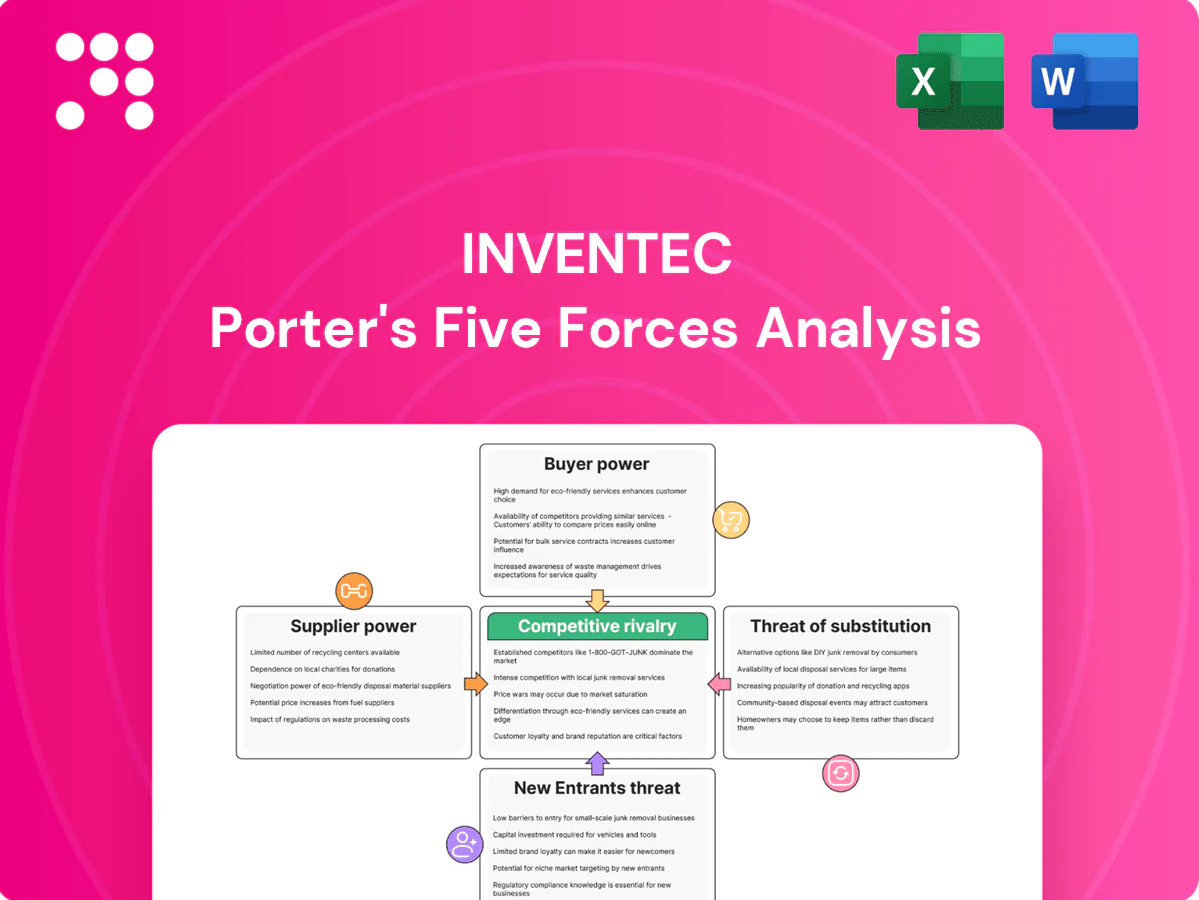
Inventec Porter's Five Forces Analysis

Elevate Your Analysis with the Complete Porter's Five Forces Analysis
Inventec faces moderate supplier power, intense buyer price sensitivity, and rising competitive threats from OEMs and cloud-driven substitutes; this snapshot highlights key pressure points shaping its margins and positioning. The complete report reveals the real forces shaping Inventec’s industry—from supplier influence to threat of new entrants. Unlock the full Porter's Five Forces Analysis to explore Inventec’s competitive dynamics in detail.
Suppliers Bargaining Power

Concentrated critical components
Advanced semiconductors, panels and high-layer PCBs are sourced from a concentrated supplier base, with TSMC holding about 53% foundry share in 2024 and top memory vendors (Samsung ~41%, Micron ~31%, SK Hynix ~28%) dominating capacity, which raises supplier leverage on pricing and allocations. AI server-grade CPUs, GPUs, NICs and HBM remain especially constrained, and supplier prioritization shifts with cycles, extending Inventec’s lead times and concentration risk.
Technological lock-in and specs
Platform designs optimized for specific chipsets and firmware stacks create switching frictions that cement technological lock-in. Qualification cycles for alternative parts typically run 6–18 months and can cost several million USD, raising switching barriers. Firmware and security compliance further tie builds to approved vendors. This lock-in materially boosts supplier bargaining power on key nodes.

Volatile input costs
Commodity swings in memory, batteries and metals—often 20–50% moves in memory and 30–100% volatility in lithium inputs in recent years—can compress Inventec margins when pass-through is limited. In tight cycles suppliers shorten quotations to 7–30 days and enforce take-or-pay. Price-adjustment clauses only partially mitigate swings. Inventory hedging ties up capital and raises obsolescence write-down risk of 5–15%.

Scale-based mitigation
Inventec leverages volume and a multi-category footprint to multi-source components and extract better terms, with aggregated demand across servers, PCs and IoT increasing negotiating leverage. Vendor-managed inventory and long-term agreements help secure allocations during shortages. Strategic partnerships that co-develop reference designs allow trading committed volume for cost relief and priority supply.
- Multi-sourcing enabled by cross-category scale
- Aggregated demand boosts bargaining leverage
- VMI and LTAs secure allocation
- Co-development trades volume for cost/priority
Logistics and geopolitical exposure
Export controls and tariffs (up to 25% on some China-origin goods) and logistics chokepoints empower regionally advantaged suppliers; firms nearer compliant supply chains gain pricing leverage. Relocating capacity to Vietnam or Mexico diversifies risk but introduces ramp costs and dual-sourcing complexity. Stricter 2024 traceability and ESG rules narrow qualified vendors, raising supplier power in compliant tiers.
Concentrated suppliers, long qualification cycles and tariffs squeeze pricing and margins
Concentrated suppliers (TSMC ~53% foundry; Samsung ~41%, Micron ~31%, SK Hynix ~28% memory in 2024) raise pricing and allocation leverage. Qualification cycles (6–18 months) and firmware lock-in increase switching costs. Commodity swings and 5–15% obsolescence write-downs compress margins; tariffs up to 25% and ESG traceability narrow vendor pools.
| Metric | Value | Impact |
|---|---|---|
| TSMC foundry share | ~53% | High price/allocation power |
| Top memory vendors | Samsung 41%/Micron 31%/SK 28% | Concentrated capacity |
| Qualification time | 6–18 months | High switching cost |
| Inventory write-down | 5–15% | Margin risk |
| Tariffs | Up to 25% | Regional cost variance |
What is included in the product
 Detailed Word Document
Tailored exclusively for Inventec, this Porter's Five Forces analysis uncovers key drivers of competition, supplier and buyer power, threats from new entrants and substitutes, and disruptive forces shaping market share and profitability.

 Customizable Excel Spreadsheet
One-sheet Inventec Porter's Five Forces that instantly visualizes competitive pressure with an editable spider chart and clean layout—ready for pitch decks or boardrooms. Customize scores, duplicate scenarios (pre/post regulation) and swap in your own data without macros for fast, non-technical decision-making.
Customers Bargaining Power

Highly concentrated customer base
Global brands and hyperscalers concentrate demand and exert strong price and volume leverage, with Synergy Research reporting 2024 cloud infrastructure shares roughly: AWS 32%, Microsoft 23%, Google 11%, intensifying buyer clout. Dual-sourcing among ODMs enables rapid share shifts and quarter-to-quarter order swings, forcing fast capacity reallocation. Quarterly business reviews impose continuous cost-down and yield targets, materially elevating buyer power over Inventec.
Design influence and customization
In 2024 enterprise and cloud customers increasingly dictated specifications, certifications and roadmaps, with hyperscalers driving roughly 60% of server procurement and leveraging roadmap visibility to secure favorable pricing and lead times. Mid-cycle engineering change orders frequently force suppliers to absorb added costs, while JDM/ODM models shift more NRE onto suppliers unless explicitly negotiated in contracts.

Switching costs moderate
Requalification and tooling create friction for buyers, but established second sources and cross-qualified suppliers mean lock-in is limited; in 2024 the top three ODMs still account for roughly 50% of capacity in key segments, keeping alternatives available. Standardized reference platforms (BIOS, chassis modules) further ease migration across ODMs. Service-level penalties incentivize performance yet create contractual exit triggers when missed. Net effect: buyers retain credible switching threats.

Long contracts with claw-backs
Long contracts with claw-backs tie volume commitments to rolling forecasts and take-back rights, compressing Inventec margins as 2024 EMS practice commonly embeds open-book cost-transparency and rebates, with warranty/DOA terms shifting risk upstream and continuous-improvement clauses capturing supplier value.
- Rolling forecasts: take-back rights
- Open-book models: margin compression
- Warranty/DOA: risk upstream
- Rebates/CI clauses: buyer value capture
ODM-direct vs branded channels
Hyperscalers buying ODM-direct in 2024 intensified price pressure and eroded brand premiums, while PCs and IoT channels still route through retail brands that force aggressive cost-downs; Inventec faces slimmer margins as channel mix shifts. A move toward AI server production in 2024 can rebalance buyer power if capacity tightens and component shortages persist. Bargaining strength varies with end-market cycles, weakening in downturns and tightening when AI-driven demand spikes.
- 2024: hyperscaler ODM-direct increases price leverage
- PC/IoT: retail brands enforce cost-downs
- AI server mix: potential power rebalance if capacity constrained
- Buyer leverage fluctuates by end-market cycle
Hyperscalers drive 60% of server buys; top-3 ODMs ~50% capacity
Hyperscalers concentrate demand (AWS 32% Microsoft 23% Google 11% in cloud infra 2024) and drive ~60% of server procurement, exerting strong price and volume leverage. Dual-sourcing and top-3 ODMs ~50% capacity keep switching credible, while rolling forecasts, open-book models and rebates compress Inventec margins. AI server tightness could temporarily rebalance buyer power.
| Metric | 2024 |
|---|---|
| Hyperscaler cloud share | AWS32%/MS23%/GCP11% |
| Server procurement via hyperscalers | ~60% |
| Top-3 ODM capacity | ~50% |
Preview the Actual Deliverable
Inventec Porter's Five Forces Analysis
This preview shows the exact Inventec Porter's Five Forces Analysis you'll receive immediately after purchase—no placeholders or samples. The document displayed is fully formatted, professionally written, and ready for download and use the moment you buy. You're viewing the final deliverable.

Elevate Your Analysis with the Complete Porter's Five Forces Analysis
Inventec faces moderate supplier power, intense buyer price sensitivity, and rising competitive threats from OEMs and cloud-driven substitutes; this snapshot highlights key pressure points shaping its margins and positioning. The complete report reveals the real forces shaping Inventec’s industry—from supplier influence to threat of new entrants. Unlock the full Porter's Five Forces Analysis to explore Inventec’s competitive dynamics in detail.
Suppliers Bargaining Power
Concentrated critical components
Advanced semiconductors, panels and high-layer PCBs are sourced from a concentrated supplier base, with TSMC holding about 53% foundry share in 2024 and top memory vendors (Samsung ~41%, Micron ~31%, SK Hynix ~28%) dominating capacity, which raises supplier leverage on pricing and allocations. AI server-grade CPUs, GPUs, NICs and HBM remain especially constrained, and supplier prioritization shifts with cycles, extending Inventec’s lead times and concentration risk.
Technological lock-in and specs
Platform designs optimized for specific chipsets and firmware stacks create switching frictions that cement technological lock-in. Qualification cycles for alternative parts typically run 6–18 months and can cost several million USD, raising switching barriers. Firmware and security compliance further tie builds to approved vendors. This lock-in materially boosts supplier bargaining power on key nodes.
Volatile input costs
Commodity swings in memory, batteries and metals—often 20–50% moves in memory and 30–100% volatility in lithium inputs in recent years—can compress Inventec margins when pass-through is limited. In tight cycles suppliers shorten quotations to 7–30 days and enforce take-or-pay. Price-adjustment clauses only partially mitigate swings. Inventory hedging ties up capital and raises obsolescence write-down risk of 5–15%.
Scale-based mitigation
Inventec leverages volume and a multi-category footprint to multi-source components and extract better terms, with aggregated demand across servers, PCs and IoT increasing negotiating leverage. Vendor-managed inventory and long-term agreements help secure allocations during shortages. Strategic partnerships that co-develop reference designs allow trading committed volume for cost relief and priority supply.
- Multi-sourcing enabled by cross-category scale
- Aggregated demand boosts bargaining leverage
- VMI and LTAs secure allocation
- Co-development trades volume for cost/priority
Logistics and geopolitical exposure
Export controls and tariffs (up to 25% on some China-origin goods) and logistics chokepoints empower regionally advantaged suppliers; firms nearer compliant supply chains gain pricing leverage. Relocating capacity to Vietnam or Mexico diversifies risk but introduces ramp costs and dual-sourcing complexity. Stricter 2024 traceability and ESG rules narrow qualified vendors, raising supplier power in compliant tiers.
Concentrated suppliers, long qualification cycles and tariffs squeeze pricing and margins
Concentrated suppliers (TSMC ~53% foundry; Samsung ~41%, Micron ~31%, SK Hynix ~28% memory in 2024) raise pricing and allocation leverage. Qualification cycles (6–18 months) and firmware lock-in increase switching costs. Commodity swings and 5–15% obsolescence write-downs compress margins; tariffs up to 25% and ESG traceability narrow vendor pools.
| Metric | Value | Impact |
|---|---|---|
| TSMC foundry share | ~53% | High price/allocation power |
| Top memory vendors | Samsung 41%/Micron 31%/SK 28% | Concentrated capacity |
| Qualification time | 6–18 months | High switching cost |
| Inventory write-down | 5–15% | Margin risk |
| Tariffs | Up to 25% | Regional cost variance |
What is included in the product
Detailed Word Document
Tailored exclusively for Inventec, this Porter's Five Forces analysis uncovers key drivers of competition, supplier and buyer power, threats from new entrants and substitutes, and disruptive forces shaping market share and profitability.
Customizable Excel Spreadsheet
One-sheet Inventec Porter's Five Forces that instantly visualizes competitive pressure with an editable spider chart and clean layout—ready for pitch decks or boardrooms. Customize scores, duplicate scenarios (pre/post regulation) and swap in your own data without macros for fast, non-technical decision-making.
Customers Bargaining Power
Highly concentrated customer base
Global brands and hyperscalers concentrate demand and exert strong price and volume leverage, with Synergy Research reporting 2024 cloud infrastructure shares roughly: AWS 32%, Microsoft 23%, Google 11%, intensifying buyer clout. Dual-sourcing among ODMs enables rapid share shifts and quarter-to-quarter order swings, forcing fast capacity reallocation. Quarterly business reviews impose continuous cost-down and yield targets, materially elevating buyer power over Inventec.
Design influence and customization
In 2024 enterprise and cloud customers increasingly dictated specifications, certifications and roadmaps, with hyperscalers driving roughly 60% of server procurement and leveraging roadmap visibility to secure favorable pricing and lead times. Mid-cycle engineering change orders frequently force suppliers to absorb added costs, while JDM/ODM models shift more NRE onto suppliers unless explicitly negotiated in contracts.
Switching costs moderate
Requalification and tooling create friction for buyers, but established second sources and cross-qualified suppliers mean lock-in is limited; in 2024 the top three ODMs still account for roughly 50% of capacity in key segments, keeping alternatives available. Standardized reference platforms (BIOS, chassis modules) further ease migration across ODMs. Service-level penalties incentivize performance yet create contractual exit triggers when missed. Net effect: buyers retain credible switching threats.
Long contracts with claw-backs
Long contracts with claw-backs tie volume commitments to rolling forecasts and take-back rights, compressing Inventec margins as 2024 EMS practice commonly embeds open-book cost-transparency and rebates, with warranty/DOA terms shifting risk upstream and continuous-improvement clauses capturing supplier value.
- Rolling forecasts: take-back rights
- Open-book models: margin compression
- Warranty/DOA: risk upstream
- Rebates/CI clauses: buyer value capture
ODM-direct vs branded channels
Hyperscalers buying ODM-direct in 2024 intensified price pressure and eroded brand premiums, while PCs and IoT channels still route through retail brands that force aggressive cost-downs; Inventec faces slimmer margins as channel mix shifts. A move toward AI server production in 2024 can rebalance buyer power if capacity tightens and component shortages persist. Bargaining strength varies with end-market cycles, weakening in downturns and tightening when AI-driven demand spikes.
- 2024: hyperscaler ODM-direct increases price leverage
- PC/IoT: retail brands enforce cost-downs
- AI server mix: potential power rebalance if capacity constrained
- Buyer leverage fluctuates by end-market cycle
Hyperscalers drive 60% of server buys; top-3 ODMs ~50% capacity
Hyperscalers concentrate demand (AWS 32% Microsoft 23% Google 11% in cloud infra 2024) and drive ~60% of server procurement, exerting strong price and volume leverage. Dual-sourcing and top-3 ODMs ~50% capacity keep switching credible, while rolling forecasts, open-book models and rebates compress Inventec margins. AI server tightness could temporarily rebalance buyer power.
| Metric | 2024 |
|---|---|
| Hyperscaler cloud share | AWS32%/MS23%/GCP11% |
| Server procurement via hyperscalers | ~60% |
| Top-3 ODM capacity | ~50% |
Preview the Actual Deliverable
Inventec Porter's Five Forces Analysis
This preview shows the exact Inventec Porter's Five Forces Analysis you'll receive immediately after purchase—no placeholders or samples. The document displayed is fully formatted, professionally written, and ready for download and use the moment you buy. You're viewing the final deliverable.
Original: $10.00
-65%$10.00
$3.50Description
Elevate Your Analysis with the Complete Porter's Five Forces Analysis
Inventec faces moderate supplier power, intense buyer price sensitivity, and rising competitive threats from OEMs and cloud-driven substitutes; this snapshot highlights key pressure points shaping its margins and positioning. The complete report reveals the real forces shaping Inventec’s industry—from supplier influence to threat of new entrants. Unlock the full Porter's Five Forces Analysis to explore Inventec’s competitive dynamics in detail.
Suppliers Bargaining Power
Concentrated critical components
Advanced semiconductors, panels and high-layer PCBs are sourced from a concentrated supplier base, with TSMC holding about 53% foundry share in 2024 and top memory vendors (Samsung ~41%, Micron ~31%, SK Hynix ~28%) dominating capacity, which raises supplier leverage on pricing and allocations. AI server-grade CPUs, GPUs, NICs and HBM remain especially constrained, and supplier prioritization shifts with cycles, extending Inventec’s lead times and concentration risk.
Technological lock-in and specs
Platform designs optimized for specific chipsets and firmware stacks create switching frictions that cement technological lock-in. Qualification cycles for alternative parts typically run 6–18 months and can cost several million USD, raising switching barriers. Firmware and security compliance further tie builds to approved vendors. This lock-in materially boosts supplier bargaining power on key nodes.
Volatile input costs
Commodity swings in memory, batteries and metals—often 20–50% moves in memory and 30–100% volatility in lithium inputs in recent years—can compress Inventec margins when pass-through is limited. In tight cycles suppliers shorten quotations to 7–30 days and enforce take-or-pay. Price-adjustment clauses only partially mitigate swings. Inventory hedging ties up capital and raises obsolescence write-down risk of 5–15%.
Scale-based mitigation
Inventec leverages volume and a multi-category footprint to multi-source components and extract better terms, with aggregated demand across servers, PCs and IoT increasing negotiating leverage. Vendor-managed inventory and long-term agreements help secure allocations during shortages. Strategic partnerships that co-develop reference designs allow trading committed volume for cost relief and priority supply.
- Multi-sourcing enabled by cross-category scale
- Aggregated demand boosts bargaining leverage
- VMI and LTAs secure allocation
- Co-development trades volume for cost/priority
Logistics and geopolitical exposure
Export controls and tariffs (up to 25% on some China-origin goods) and logistics chokepoints empower regionally advantaged suppliers; firms nearer compliant supply chains gain pricing leverage. Relocating capacity to Vietnam or Mexico diversifies risk but introduces ramp costs and dual-sourcing complexity. Stricter 2024 traceability and ESG rules narrow qualified vendors, raising supplier power in compliant tiers.
Concentrated suppliers, long qualification cycles and tariffs squeeze pricing and margins
Concentrated suppliers (TSMC ~53% foundry; Samsung ~41%, Micron ~31%, SK Hynix ~28% memory in 2024) raise pricing and allocation leverage. Qualification cycles (6–18 months) and firmware lock-in increase switching costs. Commodity swings and 5–15% obsolescence write-downs compress margins; tariffs up to 25% and ESG traceability narrow vendor pools.
| Metric | Value | Impact |
|---|---|---|
| TSMC foundry share | ~53% | High price/allocation power |
| Top memory vendors | Samsung 41%/Micron 31%/SK 28% | Concentrated capacity |
| Qualification time | 6–18 months | High switching cost |
| Inventory write-down | 5–15% | Margin risk |
| Tariffs | Up to 25% | Regional cost variance |
What is included in the product
Detailed Word Document
Tailored exclusively for Inventec, this Porter's Five Forces analysis uncovers key drivers of competition, supplier and buyer power, threats from new entrants and substitutes, and disruptive forces shaping market share and profitability.
Customizable Excel Spreadsheet
One-sheet Inventec Porter's Five Forces that instantly visualizes competitive pressure with an editable spider chart and clean layout—ready for pitch decks or boardrooms. Customize scores, duplicate scenarios (pre/post regulation) and swap in your own data without macros for fast, non-technical decision-making.
Customers Bargaining Power
Highly concentrated customer base
Global brands and hyperscalers concentrate demand and exert strong price and volume leverage, with Synergy Research reporting 2024 cloud infrastructure shares roughly: AWS 32%, Microsoft 23%, Google 11%, intensifying buyer clout. Dual-sourcing among ODMs enables rapid share shifts and quarter-to-quarter order swings, forcing fast capacity reallocation. Quarterly business reviews impose continuous cost-down and yield targets, materially elevating buyer power over Inventec.
Design influence and customization
In 2024 enterprise and cloud customers increasingly dictated specifications, certifications and roadmaps, with hyperscalers driving roughly 60% of server procurement and leveraging roadmap visibility to secure favorable pricing and lead times. Mid-cycle engineering change orders frequently force suppliers to absorb added costs, while JDM/ODM models shift more NRE onto suppliers unless explicitly negotiated in contracts.
Switching costs moderate
Requalification and tooling create friction for buyers, but established second sources and cross-qualified suppliers mean lock-in is limited; in 2024 the top three ODMs still account for roughly 50% of capacity in key segments, keeping alternatives available. Standardized reference platforms (BIOS, chassis modules) further ease migration across ODMs. Service-level penalties incentivize performance yet create contractual exit triggers when missed. Net effect: buyers retain credible switching threats.
Long contracts with claw-backs
Long contracts with claw-backs tie volume commitments to rolling forecasts and take-back rights, compressing Inventec margins as 2024 EMS practice commonly embeds open-book cost-transparency and rebates, with warranty/DOA terms shifting risk upstream and continuous-improvement clauses capturing supplier value.
- Rolling forecasts: take-back rights
- Open-book models: margin compression
- Warranty/DOA: risk upstream
- Rebates/CI clauses: buyer value capture
ODM-direct vs branded channels
Hyperscalers buying ODM-direct in 2024 intensified price pressure and eroded brand premiums, while PCs and IoT channels still route through retail brands that force aggressive cost-downs; Inventec faces slimmer margins as channel mix shifts. A move toward AI server production in 2024 can rebalance buyer power if capacity tightens and component shortages persist. Bargaining strength varies with end-market cycles, weakening in downturns and tightening when AI-driven demand spikes.
- 2024: hyperscaler ODM-direct increases price leverage
- PC/IoT: retail brands enforce cost-downs
- AI server mix: potential power rebalance if capacity constrained
- Buyer leverage fluctuates by end-market cycle
Hyperscalers drive 60% of server buys; top-3 ODMs ~50% capacity
Hyperscalers concentrate demand (AWS 32% Microsoft 23% Google 11% in cloud infra 2024) and drive ~60% of server procurement, exerting strong price and volume leverage. Dual-sourcing and top-3 ODMs ~50% capacity keep switching credible, while rolling forecasts, open-book models and rebates compress Inventec margins. AI server tightness could temporarily rebalance buyer power.
| Metric | 2024 |
|---|---|
| Hyperscaler cloud share | AWS32%/MS23%/GCP11% |
| Server procurement via hyperscalers | ~60% |
| Top-3 ODM capacity | ~50% |
Preview the Actual Deliverable
Inventec Porter's Five Forces Analysis
This preview shows the exact Inventec Porter's Five Forces Analysis you'll receive immediately after purchase—no placeholders or samples. The document displayed is fully formatted, professionally written, and ready for download and use the moment you buy. You're viewing the final deliverable.











