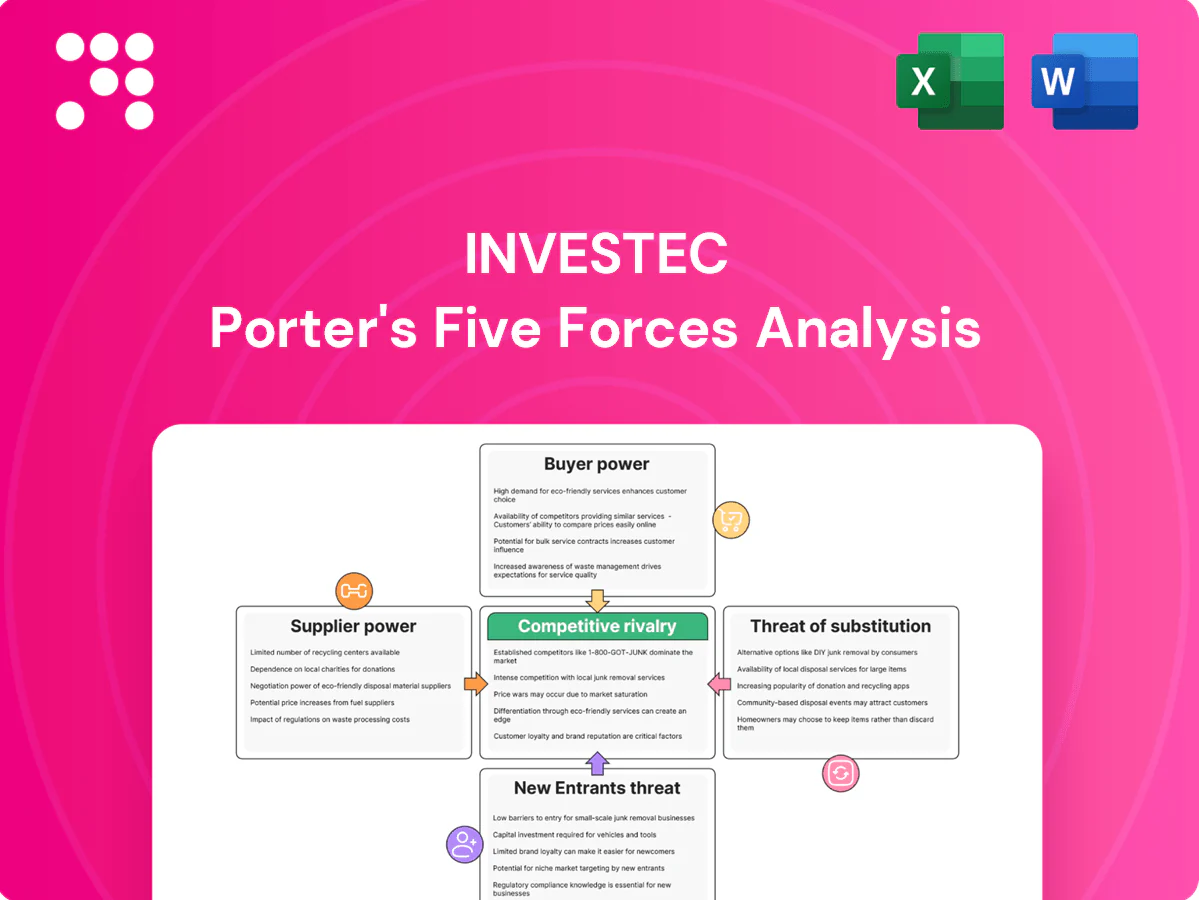
Investec Porter's Five Forces Analysis

Elevate Your Analysis with the Complete Porter's Five Forces Analysis
Investec’s Porter's Five Forces snapshot highlights competitive intensity, supplier and buyer power, threat of substitutes, and entry barriers shaping its strategic position, with focused observations on revenue drivers and margin pressures. This brief only scratches the surface—unlock the full Porter's Five Forces Analysis to explore Investec’s competitive dynamics, market pressures, and strategic advantages in detail.
Suppliers Bargaining Power

Concentrated wholesale funding
Investec taps wholesale markets and institutional lenders for term funding, concentrating bargaining power among a limited set of counterparties; pricing tightens in risk-off cycles, raising spreads and covenant demands. Dependence on strong credit ratings makes the group sensitive to sentiment shifts, while diversification by tenor, currency and instrument mitigates but does not eliminate this leverage.
Dependence on specialist talent
Private bankers, wealth managers and investment bankers are scarce, highly mobile professionals who command premium compensation, giving them significant bargaining power as suppliers of human capital.
Retention costs and deferred compensation structures create leverage for employees to negotiate terms and exit packages, while client relationships frequently follow bankers, amplifying this power.
Investec mitigates attrition risk through a strong culture and equity participation schemes that align incentives and encourage longer tenure.

Critical tech and data vendors
Core banking platforms, market data feeds and cybersecurity providers (eg Temenos, FIS, Fiserv, Finastra among core vendors) are few and costly to switch, creating vendor lock-in and high integration complexity that raise switching costs and give suppliers leverage on pricing and terms. Service outages or data incidents directly interrupt client delivery and regulatory reporting; IBM's 2024 Cost of a Data Breach report cites an average breach cost of $4.45m. Multi-vendor strategies and selective in-house tooling can materially rebalance supplier power.

Payment, clearing, and custody rails
Access to UK and South African payment, clearing and custody rails is essential for Investec; UK RTGS/CHAPS handles about £700 billion daily and South African RTGS settles large-value ZAR flows, giving infrastructure providers leverage via standardized fees and participation rules. Operational and collateral requirements raise cost-to-serve materially, while direct membership and scale can modestly offset dependence.
- Fee concentration: standardized schedules sustain supplier leverage
- Operational burden: collateral/liquidity needs increase treasury costs
- Mitigant: direct membership and scale reduce but do not eliminate dependence
Regulatory capital and ratings
Capital providers and rating agencies act as suppliers by shaping Investec’s balance-sheet capacity and funding costs; Investec reported a CET1 ratio of 13.1% at Mar‑24, constraining leverage and product economics. Model approvals and regulatory buffers directly affect pricing and return on capital, while any downgrade can immediately reprice liabilities and widen credit spreads.
- Capital buffer: CET1 13.1% (Mar‑24)
- Rating impact: downgrades reprice funding
- Model approvals: affect product ROE
- Mitigation: proactive capital planning, diversified funding
CET1 13.1%;RTGS £700bn/day;$4.45m
Investec faces concentrated supplier power from wholesale funders and rating agencies, with CET1 13.1% (Mar‑24) constraining pricing flexibility. Skilled bankers command premium pay and mobility, raising retention costs. Core tech vendors and payment rails (UK RTGS ~£700bn/day) create lock-in and outage risk; average data breach cost $4.45m (IBM 2024).
| Supplier | Metric | Impact |
|---|---|---|
| Capital/rating | CET1 13.1% | Higher funding cost |
| Payments infra | UK RTGS ~£700bn/day | Fee/leverage |
| Tech/vendors | Avg breach $4.45m | Operational risk |
What is included in the product
 Detailed Word Document
Uncovers competitive drivers—buyer and supplier power, rivalry, entry barriers and substitutes—shaping Investec’s profitability and strategic positioning, with industry data and actionable insights for decision-making.

 Customizable Excel Spreadsheet
A clear, one-sheet Investec Porter's Five Forces summary—perfect for quick strategic decisions and boardroom decks. Customize pressure levels and swap in your own data to reflect shifting market trends without complex tools.
Customers Bargaining Power

Sophisticated HNWI and institutions
Clients are highly financially literate, routinely comparison-shopping and negotiating fees and spreads, with over 22 million HNWIs globally in 2024 increasing competitive scrutiny. Institutional mandates are frequently awarded via competitive RFPs, intensifying price pressure and driving margin compression. HNWIs demand bespoke solutions and transparent performance reporting, and deep relationships temper but do not eliminate their bargaining power.
Multi-bank relationships
Clients commonly maintain parallel relationships with 2–4 banks, enabling easy benchmarking and leverage in negotiations; wallet share is contested across product lines, pushing providers to bundle services or offer targeted discounts. Cross-selling helps defend margins but invites scrutiny on measurable value and fee transparency. Differentiated advisory and higher-tier service levels are critical to retention and preserving fee income.

Moderate switching costs
Digital onboarding and custodial transfers have cut friction materially—by 2024 about 70% of wealth platforms reported account openings within 48–72 hours—making price and UX more salient to clients. Complex lending, structured products and bespoke portfolios still anchor high-net-worth clients, creating switching inertia for roughly 30–40% of AUM. KYC/AML re-papering adds regulatory friction but is manageable for most firms, while superior digital UX or pricing can trigger rapid churn.

Fee compression trends
Wealth and asset management face sustained pressure from passive and low-cost competitors as ETF/ETP assets topped $10 trillion in 2023. Clients push for lower basis-point fees and tiered pricing, and performance volatility accelerates renegotiations. Value-added advisory and alternative access can defend yield.
- Passive scale: ETF/ETP assets >10 trillion (2023)
- Fee pressure: demand for lower bps and tiering
- Renegotiation risk: tied to performance volatility
Service quality sensitivity
Private clients and institutions react swiftly to service lapses; industry surveys in 2024 show over 60% of HNW clients consider service quality a primary switch factor, so response times, execution quality and platform reliability materially affect retention.
Word-of-mouth and peer networks amplify reputational impacts, with referral churn driving measurable AUM outflows in short windows; consistent, proactive communication reduces buyer leverage events and stabilizes fee negotiation.
- service sensitivity: >60% (2024)
- key drivers: response time, execution, platform uptime
- mitigation: proactive comms, rapid remediation
HNWIs squeeze fees; service lapses drive churn amid >$10tn ETF boom
Clients (22m HNWIs in 2024) are highly price‑sensitive, routinely benchmarking fees and pushing margins amid ETF/ETP scale of >$10tn (2023). Parallel bank relationships (2–4) and fast digital onboarding (~70% accounts in 48–72h) increase leverage, though 30–40% AUM shows switching inertia for bespoke services. Service lapses trigger churn; >60% of HNWIs cite service quality as primary switch factor (2024).
| Metric | Value |
|---|---|
| HNWIs (2024) | 22m |
| ETF/ETP AUM (2023) | >$10tn |
| Fast onboarding | ~70% in 48–72h |
| Switching inertia | 30–40% AUM |
| Service sensitivity (2024) | >60% |
Full Version Awaits
Investec Porter's Five Forces Analysis
This Investec Porter’s Five Forces Analysis delivers a concise, professionally formatted assessment of competitive rivalry, supplier and buyer power, threat of substitutes and new entrants, and strategic implications. This preview is the exact document you’ll receive immediately after purchase—no placeholders, ready for download and use. It’s the final deliverable, prepared for immediate application in decision-making.

Elevate Your Analysis with the Complete Porter's Five Forces Analysis
Investec’s Porter's Five Forces snapshot highlights competitive intensity, supplier and buyer power, threat of substitutes, and entry barriers shaping its strategic position, with focused observations on revenue drivers and margin pressures. This brief only scratches the surface—unlock the full Porter's Five Forces Analysis to explore Investec’s competitive dynamics, market pressures, and strategic advantages in detail.
Suppliers Bargaining Power
Concentrated wholesale funding
Investec taps wholesale markets and institutional lenders for term funding, concentrating bargaining power among a limited set of counterparties; pricing tightens in risk-off cycles, raising spreads and covenant demands. Dependence on strong credit ratings makes the group sensitive to sentiment shifts, while diversification by tenor, currency and instrument mitigates but does not eliminate this leverage.
Dependence on specialist talent
Private bankers, wealth managers and investment bankers are scarce, highly mobile professionals who command premium compensation, giving them significant bargaining power as suppliers of human capital.
Retention costs and deferred compensation structures create leverage for employees to negotiate terms and exit packages, while client relationships frequently follow bankers, amplifying this power.
Investec mitigates attrition risk through a strong culture and equity participation schemes that align incentives and encourage longer tenure.
Critical tech and data vendors
Core banking platforms, market data feeds and cybersecurity providers (eg Temenos, FIS, Fiserv, Finastra among core vendors) are few and costly to switch, creating vendor lock-in and high integration complexity that raise switching costs and give suppliers leverage on pricing and terms. Service outages or data incidents directly interrupt client delivery and regulatory reporting; IBM's 2024 Cost of a Data Breach report cites an average breach cost of $4.45m. Multi-vendor strategies and selective in-house tooling can materially rebalance supplier power.
Payment, clearing, and custody rails
Access to UK and South African payment, clearing and custody rails is essential for Investec; UK RTGS/CHAPS handles about £700 billion daily and South African RTGS settles large-value ZAR flows, giving infrastructure providers leverage via standardized fees and participation rules. Operational and collateral requirements raise cost-to-serve materially, while direct membership and scale can modestly offset dependence.
- Fee concentration: standardized schedules sustain supplier leverage
- Operational burden: collateral/liquidity needs increase treasury costs
- Mitigant: direct membership and scale reduce but do not eliminate dependence
Regulatory capital and ratings
Capital providers and rating agencies act as suppliers by shaping Investec’s balance-sheet capacity and funding costs; Investec reported a CET1 ratio of 13.1% at Mar‑24, constraining leverage and product economics. Model approvals and regulatory buffers directly affect pricing and return on capital, while any downgrade can immediately reprice liabilities and widen credit spreads.
- Capital buffer: CET1 13.1% (Mar‑24)
- Rating impact: downgrades reprice funding
- Model approvals: affect product ROE
- Mitigation: proactive capital planning, diversified funding
CET1 13.1%;RTGS £700bn/day;$4.45m
Investec faces concentrated supplier power from wholesale funders and rating agencies, with CET1 13.1% (Mar‑24) constraining pricing flexibility. Skilled bankers command premium pay and mobility, raising retention costs. Core tech vendors and payment rails (UK RTGS ~£700bn/day) create lock-in and outage risk; average data breach cost $4.45m (IBM 2024).
| Supplier | Metric | Impact |
|---|---|---|
| Capital/rating | CET1 13.1% | Higher funding cost |
| Payments infra | UK RTGS ~£700bn/day | Fee/leverage |
| Tech/vendors | Avg breach $4.45m | Operational risk |
What is included in the product
Detailed Word Document
Uncovers competitive drivers—buyer and supplier power, rivalry, entry barriers and substitutes—shaping Investec’s profitability and strategic positioning, with industry data and actionable insights for decision-making.
Customizable Excel Spreadsheet
A clear, one-sheet Investec Porter's Five Forces summary—perfect for quick strategic decisions and boardroom decks. Customize pressure levels and swap in your own data to reflect shifting market trends without complex tools.
Customers Bargaining Power
Sophisticated HNWI and institutions
Clients are highly financially literate, routinely comparison-shopping and negotiating fees and spreads, with over 22 million HNWIs globally in 2024 increasing competitive scrutiny. Institutional mandates are frequently awarded via competitive RFPs, intensifying price pressure and driving margin compression. HNWIs demand bespoke solutions and transparent performance reporting, and deep relationships temper but do not eliminate their bargaining power.
Multi-bank relationships
Clients commonly maintain parallel relationships with 2–4 banks, enabling easy benchmarking and leverage in negotiations; wallet share is contested across product lines, pushing providers to bundle services or offer targeted discounts. Cross-selling helps defend margins but invites scrutiny on measurable value and fee transparency. Differentiated advisory and higher-tier service levels are critical to retention and preserving fee income.
Moderate switching costs
Digital onboarding and custodial transfers have cut friction materially—by 2024 about 70% of wealth platforms reported account openings within 48–72 hours—making price and UX more salient to clients. Complex lending, structured products and bespoke portfolios still anchor high-net-worth clients, creating switching inertia for roughly 30–40% of AUM. KYC/AML re-papering adds regulatory friction but is manageable for most firms, while superior digital UX or pricing can trigger rapid churn.
Fee compression trends
Wealth and asset management face sustained pressure from passive and low-cost competitors as ETF/ETP assets topped $10 trillion in 2023. Clients push for lower basis-point fees and tiered pricing, and performance volatility accelerates renegotiations. Value-added advisory and alternative access can defend yield.
- Passive scale: ETF/ETP assets >10 trillion (2023)
- Fee pressure: demand for lower bps and tiering
- Renegotiation risk: tied to performance volatility
Service quality sensitivity
Private clients and institutions react swiftly to service lapses; industry surveys in 2024 show over 60% of HNW clients consider service quality a primary switch factor, so response times, execution quality and platform reliability materially affect retention.
Word-of-mouth and peer networks amplify reputational impacts, with referral churn driving measurable AUM outflows in short windows; consistent, proactive communication reduces buyer leverage events and stabilizes fee negotiation.
- service sensitivity: >60% (2024)
- key drivers: response time, execution, platform uptime
- mitigation: proactive comms, rapid remediation
HNWIs squeeze fees; service lapses drive churn amid >$10tn ETF boom
Clients (22m HNWIs in 2024) are highly price‑sensitive, routinely benchmarking fees and pushing margins amid ETF/ETP scale of >$10tn (2023). Parallel bank relationships (2–4) and fast digital onboarding (~70% accounts in 48–72h) increase leverage, though 30–40% AUM shows switching inertia for bespoke services. Service lapses trigger churn; >60% of HNWIs cite service quality as primary switch factor (2024).
| Metric | Value |
|---|---|
| HNWIs (2024) | 22m |
| ETF/ETP AUM (2023) | >$10tn |
| Fast onboarding | ~70% in 48–72h |
| Switching inertia | 30–40% AUM |
| Service sensitivity (2024) | >60% |
Full Version Awaits
Investec Porter's Five Forces Analysis
This Investec Porter’s Five Forces Analysis delivers a concise, professionally formatted assessment of competitive rivalry, supplier and buyer power, threat of substitutes and new entrants, and strategic implications. This preview is the exact document you’ll receive immediately after purchase—no placeholders, ready for download and use. It’s the final deliverable, prepared for immediate application in decision-making.
Description
Elevate Your Analysis with the Complete Porter's Five Forces Analysis
Investec’s Porter's Five Forces snapshot highlights competitive intensity, supplier and buyer power, threat of substitutes, and entry barriers shaping its strategic position, with focused observations on revenue drivers and margin pressures. This brief only scratches the surface—unlock the full Porter's Five Forces Analysis to explore Investec’s competitive dynamics, market pressures, and strategic advantages in detail.
Suppliers Bargaining Power
Concentrated wholesale funding
Investec taps wholesale markets and institutional lenders for term funding, concentrating bargaining power among a limited set of counterparties; pricing tightens in risk-off cycles, raising spreads and covenant demands. Dependence on strong credit ratings makes the group sensitive to sentiment shifts, while diversification by tenor, currency and instrument mitigates but does not eliminate this leverage.
Dependence on specialist talent
Private bankers, wealth managers and investment bankers are scarce, highly mobile professionals who command premium compensation, giving them significant bargaining power as suppliers of human capital.
Retention costs and deferred compensation structures create leverage for employees to negotiate terms and exit packages, while client relationships frequently follow bankers, amplifying this power.
Investec mitigates attrition risk through a strong culture and equity participation schemes that align incentives and encourage longer tenure.
Critical tech and data vendors
Core banking platforms, market data feeds and cybersecurity providers (eg Temenos, FIS, Fiserv, Finastra among core vendors) are few and costly to switch, creating vendor lock-in and high integration complexity that raise switching costs and give suppliers leverage on pricing and terms. Service outages or data incidents directly interrupt client delivery and regulatory reporting; IBM's 2024 Cost of a Data Breach report cites an average breach cost of $4.45m. Multi-vendor strategies and selective in-house tooling can materially rebalance supplier power.
Payment, clearing, and custody rails
Access to UK and South African payment, clearing and custody rails is essential for Investec; UK RTGS/CHAPS handles about £700 billion daily and South African RTGS settles large-value ZAR flows, giving infrastructure providers leverage via standardized fees and participation rules. Operational and collateral requirements raise cost-to-serve materially, while direct membership and scale can modestly offset dependence.
- Fee concentration: standardized schedules sustain supplier leverage
- Operational burden: collateral/liquidity needs increase treasury costs
- Mitigant: direct membership and scale reduce but do not eliminate dependence
Regulatory capital and ratings
Capital providers and rating agencies act as suppliers by shaping Investec’s balance-sheet capacity and funding costs; Investec reported a CET1 ratio of 13.1% at Mar‑24, constraining leverage and product economics. Model approvals and regulatory buffers directly affect pricing and return on capital, while any downgrade can immediately reprice liabilities and widen credit spreads.
- Capital buffer: CET1 13.1% (Mar‑24)
- Rating impact: downgrades reprice funding
- Model approvals: affect product ROE
- Mitigation: proactive capital planning, diversified funding
CET1 13.1%;RTGS £700bn/day;$4.45m
Investec faces concentrated supplier power from wholesale funders and rating agencies, with CET1 13.1% (Mar‑24) constraining pricing flexibility. Skilled bankers command premium pay and mobility, raising retention costs. Core tech vendors and payment rails (UK RTGS ~£700bn/day) create lock-in and outage risk; average data breach cost $4.45m (IBM 2024).
| Supplier | Metric | Impact |
|---|---|---|
| Capital/rating | CET1 13.1% | Higher funding cost |
| Payments infra | UK RTGS ~£700bn/day | Fee/leverage |
| Tech/vendors | Avg breach $4.45m | Operational risk |
What is included in the product
Detailed Word Document
Uncovers competitive drivers—buyer and supplier power, rivalry, entry barriers and substitutes—shaping Investec’s profitability and strategic positioning, with industry data and actionable insights for decision-making.
Customizable Excel Spreadsheet
A clear, one-sheet Investec Porter's Five Forces summary—perfect for quick strategic decisions and boardroom decks. Customize pressure levels and swap in your own data to reflect shifting market trends without complex tools.
Customers Bargaining Power
Sophisticated HNWI and institutions
Clients are highly financially literate, routinely comparison-shopping and negotiating fees and spreads, with over 22 million HNWIs globally in 2024 increasing competitive scrutiny. Institutional mandates are frequently awarded via competitive RFPs, intensifying price pressure and driving margin compression. HNWIs demand bespoke solutions and transparent performance reporting, and deep relationships temper but do not eliminate their bargaining power.
Multi-bank relationships
Clients commonly maintain parallel relationships with 2–4 banks, enabling easy benchmarking and leverage in negotiations; wallet share is contested across product lines, pushing providers to bundle services or offer targeted discounts. Cross-selling helps defend margins but invites scrutiny on measurable value and fee transparency. Differentiated advisory and higher-tier service levels are critical to retention and preserving fee income.
Moderate switching costs
Digital onboarding and custodial transfers have cut friction materially—by 2024 about 70% of wealth platforms reported account openings within 48–72 hours—making price and UX more salient to clients. Complex lending, structured products and bespoke portfolios still anchor high-net-worth clients, creating switching inertia for roughly 30–40% of AUM. KYC/AML re-papering adds regulatory friction but is manageable for most firms, while superior digital UX or pricing can trigger rapid churn.
Fee compression trends
Wealth and asset management face sustained pressure from passive and low-cost competitors as ETF/ETP assets topped $10 trillion in 2023. Clients push for lower basis-point fees and tiered pricing, and performance volatility accelerates renegotiations. Value-added advisory and alternative access can defend yield.
- Passive scale: ETF/ETP assets >10 trillion (2023)
- Fee pressure: demand for lower bps and tiering
- Renegotiation risk: tied to performance volatility
Service quality sensitivity
Private clients and institutions react swiftly to service lapses; industry surveys in 2024 show over 60% of HNW clients consider service quality a primary switch factor, so response times, execution quality and platform reliability materially affect retention.
Word-of-mouth and peer networks amplify reputational impacts, with referral churn driving measurable AUM outflows in short windows; consistent, proactive communication reduces buyer leverage events and stabilizes fee negotiation.
- service sensitivity: >60% (2024)
- key drivers: response time, execution, platform uptime
- mitigation: proactive comms, rapid remediation
HNWIs squeeze fees; service lapses drive churn amid >$10tn ETF boom
Clients (22m HNWIs in 2024) are highly price‑sensitive, routinely benchmarking fees and pushing margins amid ETF/ETP scale of >$10tn (2023). Parallel bank relationships (2–4) and fast digital onboarding (~70% accounts in 48–72h) increase leverage, though 30–40% AUM shows switching inertia for bespoke services. Service lapses trigger churn; >60% of HNWIs cite service quality as primary switch factor (2024).
| Metric | Value |
|---|---|
| HNWIs (2024) | 22m |
| ETF/ETP AUM (2023) | >$10tn |
| Fast onboarding | ~70% in 48–72h |
| Switching inertia | 30–40% AUM |
| Service sensitivity (2024) | >60% |
Full Version Awaits
Investec Porter's Five Forces Analysis
This Investec Porter’s Five Forces Analysis delivers a concise, professionally formatted assessment of competitive rivalry, supplier and buyer power, threat of substitutes and new entrants, and strategic implications. This preview is the exact document you’ll receive immediately after purchase—no placeholders, ready for download and use. It’s the final deliverable, prepared for immediate application in decision-making.











