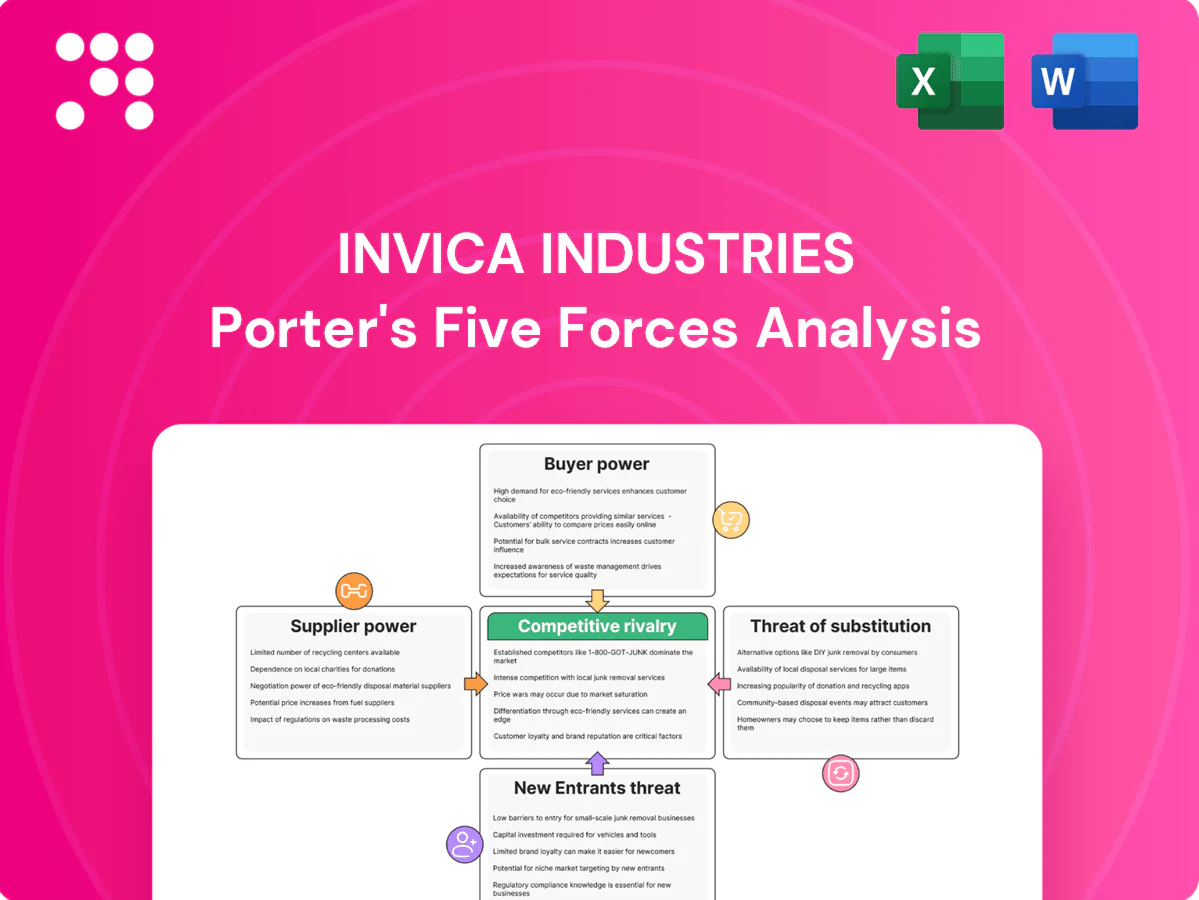
Invica Industries Porter's Five Forces Analysis

Elevate Your Analysis with the Complete Porter's Five Forces Analysis
Invica Industries faces moderate supplier leverage, focused buyer segments, and evolving substitute threats that collectively shape its competitive intensity; rival rivalry is driven by scale and innovation. This brief snapshot only scratches the surface. Unlock the full Porter's Five Forces Analysis to explore Invica Industries’s competitive dynamics, market pressures, and strategic advantages in detail.
Suppliers Bargaining Power

Concentrated miners and smelters
Upstream supply of copper, aluminium and nickel is dominated by large miners and smelters—China holds about 60% of primary aluminium capacity and roughly half of global refined copper processing, while a few miners such as Codelco, BHP and Freeport control major mine volumes. Shutdowns, geopolitical shocks or maintenance can tighten availability and lift supplier leverage for traders dependent on a limited roster. Long‑term offtakes and regional diversification can temper this risk.
LME-linked pricing and premiums
Producers price off LME/SHFE benchmarks plus regional premiums, leaving little negotiation room; in 2024 LME-linked contracts remained the staple benchmark. Premiums can widen materially in tight markets, often adding roughly $50–200/tonne regionally, letting suppliers capture extra margin. Traders must pass through or hedge these moves via LME futures/options to protect spreads. Transparent benchmarks limit arbitrary base pricing but not premium swings.

Quality certifications and traceability
Industrial buyers of Invica demand certified grades, ESG provenance and consistent specs, and sourcing often hinges on accreditation: the 2023 ISO survey reported over 1.3 million ISO 9001 certificates globally, creating a pool of suppliers traders cannot easily replace. Suppliers with recognized certifications and responsible-sourcing credentials therefore hold bargaining power, constraining switching options. Building a certified supplier portfolio reduces single-supplier dependence and procurement risk.

Credit terms and allocation control
Suppliers shape Invica Industries cash cycles through advance-payment demands, LC requirements and shipment timing, often forcing earlier cash outflows and higher working capital; the ICC estimated a global trade finance gap near 1.7 trillion USD in 2023, tightening access to LCs and trade lines. In tight commodity markets suppliers prioritize long-standing buyers, squeezing smaller traders and compressing margins via allocation control. Strengthening balance sheet metrics and securing trade finance lines raises bargaining power and access to allocations.
- Advance payments reduce free cash flow
- LC reliance increases financing costs
- Allocation control compresses gross margins
- Strong balance sheet + trade lines improve supplier terms
Logistics and freight bottlenecks
Supply leverage: upstream concentration, LME pricing, trade finance gaps raise premiums
Upstream concentration (China ~60% AL, top miners Codelco/BHP/Freeport ~40% of major copper supply) and 2024 LME-linked pricing give suppliers high leverage; regional premiums often add $50–200/t. Trade finance strain (ICC gap ~1.7T USD in 2023) plus LC/advance pay needs tighten cash cycles and allocation power. Freight spikes (spot +~30% vs 2019) and certification requirements further raise switching costs.
| Factor | 2023–24 Metric |
|---|---|
| China aluminium share | ~60% |
| Supplier concentration (copper majors) | ~40% |
| Regional premiums | $50–200/tonne |
| Trade finance gap | $1.7T (2023) |
| Freight spike | +~30% vs 2019 |
What is included in the product
 Detailed Word Document
Tailored exclusively for Invica Industries, this analysis uncovers key drivers of competition, customer influence, and market entry risks while identifying disruptive forces and substitutes that threaten market share. It also evaluates control held by suppliers and buyers and explores market dynamics that deter new entrants and protect incumbents.

 Customizable Excel Spreadsheet
A concise one-sheet Porter's Five Forces summary for Invica Industries—perfect for quick strategic decisions and boardroom slides. Customize force levels to reflect new data or market shifts.
Customers Bargaining Power

Large industrial buyers consolidate demand
Large industrial buyers in automotive, construction and electrical OEMs aggregate sizeable volumes and negotiate aggressively. Top 10 automotive OEMs produced about 79 million light vehicles in 2023, concentrating purchasing power and enabling multi-year contracts, vendor‑managed inventory and tighter spreads. They demand technical support and penalties for delays, shifting risk to suppliers and boosting buyer power over traders.
High price transparency
LME and SHFE publish daily settlement prices and premiums, making market levels visible each trading day; buyers benchmark quotes instantly and solicit multiple offers, often within 24–48 hours. This transparency has compressed intermediary margins to mid-single digits (≈3–6% in 2024), forcing traders to compete on service rather than price alone. Value-added services—logistics, financing, technical support—become decisive to defend margins.

Switching among traders is feasible
For standard grades, buyers can switch among traders if specifications and reliability match, and low switching costs heighten price competition—2024 industry surveys show roughly 54% of repeat orders evaluate alternate suppliers within 12 months. Relationship quality and flexible credit terms often decide wins in tight bids. Strong service differentiation—logistics, JIT delivery, technical support—reduces buyer bargaining leverage and preserves margins.

Demand cyclicality and inventory timing
- Order cuts → lower volumes
- Deferred deliveries → higher WC
- Flexible contracts → risk allocation
ESG and compliance requirements
Buyers increasingly demand low-carbon, responsibly sourced metals with traceable audit trails; EU CSRD rollout in 2024 extends reporting to about 50,000 firms, raising qualification hurdles for traders. Non-compliant supply is often excluded, narrowing trader options and increasing buyer leverage. Offering verified supply can command a measurable value premium.
- CSRD 2024: ~50,000 firms affected
- Higher qualification barriers for traders
- Verified supply = premium pricing opportunity
OEM concentration boosts buyer power as market transparency cuts trader margins to 3-6%
Large OEMs concentrate buying (top 10 = 79M vehicles in 2023) and secure long contracts, raising buyer power. Market transparency (LME/SHFE) cut trader margins to ~3–6% in 2024 and 54% of buyers evaluate alternatives within 12 months. CSRD expansion (~50,000 firms in 2024) raises compliance hurdles, favoring verified‑supply traders.
| Metric | Value |
|---|---|
| Top‑10 OEM output (2023) | ≈79M vehicles |
| Trader margins (2024) | ≈3–6% |
| Buyers switching eval (12m) | ≈54% |
| Firms affected by CSRD (2024) | ≈50,000 |
Preview Before You Purchase
Invica Industries Porter's Five Forces Analysis
This preview shows the complete Porter’s Five Forces analysis for Invica Industries and is the exact file you’ll receive after purchase—fully formatted and ready to use. It covers competitive rivalry, supplier and buyer power, threats of substitution and entry with actionable insights. No samples or placeholders—instant download upon payment.

Elevate Your Analysis with the Complete Porter's Five Forces Analysis
Invica Industries faces moderate supplier leverage, focused buyer segments, and evolving substitute threats that collectively shape its competitive intensity; rival rivalry is driven by scale and innovation. This brief snapshot only scratches the surface. Unlock the full Porter's Five Forces Analysis to explore Invica Industries’s competitive dynamics, market pressures, and strategic advantages in detail.
Suppliers Bargaining Power
Concentrated miners and smelters
Upstream supply of copper, aluminium and nickel is dominated by large miners and smelters—China holds about 60% of primary aluminium capacity and roughly half of global refined copper processing, while a few miners such as Codelco, BHP and Freeport control major mine volumes. Shutdowns, geopolitical shocks or maintenance can tighten availability and lift supplier leverage for traders dependent on a limited roster. Long‑term offtakes and regional diversification can temper this risk.
LME-linked pricing and premiums
Producers price off LME/SHFE benchmarks plus regional premiums, leaving little negotiation room; in 2024 LME-linked contracts remained the staple benchmark. Premiums can widen materially in tight markets, often adding roughly $50–200/tonne regionally, letting suppliers capture extra margin. Traders must pass through or hedge these moves via LME futures/options to protect spreads. Transparent benchmarks limit arbitrary base pricing but not premium swings.
Quality certifications and traceability
Industrial buyers of Invica demand certified grades, ESG provenance and consistent specs, and sourcing often hinges on accreditation: the 2023 ISO survey reported over 1.3 million ISO 9001 certificates globally, creating a pool of suppliers traders cannot easily replace. Suppliers with recognized certifications and responsible-sourcing credentials therefore hold bargaining power, constraining switching options. Building a certified supplier portfolio reduces single-supplier dependence and procurement risk.
Credit terms and allocation control
Suppliers shape Invica Industries cash cycles through advance-payment demands, LC requirements and shipment timing, often forcing earlier cash outflows and higher working capital; the ICC estimated a global trade finance gap near 1.7 trillion USD in 2023, tightening access to LCs and trade lines. In tight commodity markets suppliers prioritize long-standing buyers, squeezing smaller traders and compressing margins via allocation control. Strengthening balance sheet metrics and securing trade finance lines raises bargaining power and access to allocations.
- Advance payments reduce free cash flow
- LC reliance increases financing costs
- Allocation control compresses gross margins
- Strong balance sheet + trade lines improve supplier terms
Logistics and freight bottlenecks
Supply leverage: upstream concentration, LME pricing, trade finance gaps raise premiums
Upstream concentration (China ~60% AL, top miners Codelco/BHP/Freeport ~40% of major copper supply) and 2024 LME-linked pricing give suppliers high leverage; regional premiums often add $50–200/t. Trade finance strain (ICC gap ~1.7T USD in 2023) plus LC/advance pay needs tighten cash cycles and allocation power. Freight spikes (spot +~30% vs 2019) and certification requirements further raise switching costs.
| Factor | 2023–24 Metric |
|---|---|
| China aluminium share | ~60% |
| Supplier concentration (copper majors) | ~40% |
| Regional premiums | $50–200/tonne |
| Trade finance gap | $1.7T (2023) |
| Freight spike | +~30% vs 2019 |
What is included in the product
Detailed Word Document
Tailored exclusively for Invica Industries, this analysis uncovers key drivers of competition, customer influence, and market entry risks while identifying disruptive forces and substitutes that threaten market share. It also evaluates control held by suppliers and buyers and explores market dynamics that deter new entrants and protect incumbents.
Customizable Excel Spreadsheet
A concise one-sheet Porter's Five Forces summary for Invica Industries—perfect for quick strategic decisions and boardroom slides. Customize force levels to reflect new data or market shifts.
Customers Bargaining Power
Large industrial buyers consolidate demand
Large industrial buyers in automotive, construction and electrical OEMs aggregate sizeable volumes and negotiate aggressively. Top 10 automotive OEMs produced about 79 million light vehicles in 2023, concentrating purchasing power and enabling multi-year contracts, vendor‑managed inventory and tighter spreads. They demand technical support and penalties for delays, shifting risk to suppliers and boosting buyer power over traders.
High price transparency
LME and SHFE publish daily settlement prices and premiums, making market levels visible each trading day; buyers benchmark quotes instantly and solicit multiple offers, often within 24–48 hours. This transparency has compressed intermediary margins to mid-single digits (≈3–6% in 2024), forcing traders to compete on service rather than price alone. Value-added services—logistics, financing, technical support—become decisive to defend margins.
Switching among traders is feasible
For standard grades, buyers can switch among traders if specifications and reliability match, and low switching costs heighten price competition—2024 industry surveys show roughly 54% of repeat orders evaluate alternate suppliers within 12 months. Relationship quality and flexible credit terms often decide wins in tight bids. Strong service differentiation—logistics, JIT delivery, technical support—reduces buyer bargaining leverage and preserves margins.
Demand cyclicality and inventory timing
- Order cuts → lower volumes
- Deferred deliveries → higher WC
- Flexible contracts → risk allocation
ESG and compliance requirements
Buyers increasingly demand low-carbon, responsibly sourced metals with traceable audit trails; EU CSRD rollout in 2024 extends reporting to about 50,000 firms, raising qualification hurdles for traders. Non-compliant supply is often excluded, narrowing trader options and increasing buyer leverage. Offering verified supply can command a measurable value premium.
- CSRD 2024: ~50,000 firms affected
- Higher qualification barriers for traders
- Verified supply = premium pricing opportunity
OEM concentration boosts buyer power as market transparency cuts trader margins to 3-6%
Large OEMs concentrate buying (top 10 = 79M vehicles in 2023) and secure long contracts, raising buyer power. Market transparency (LME/SHFE) cut trader margins to ~3–6% in 2024 and 54% of buyers evaluate alternatives within 12 months. CSRD expansion (~50,000 firms in 2024) raises compliance hurdles, favoring verified‑supply traders.
| Metric | Value |
|---|---|
| Top‑10 OEM output (2023) | ≈79M vehicles |
| Trader margins (2024) | ≈3–6% |
| Buyers switching eval (12m) | ≈54% |
| Firms affected by CSRD (2024) | ≈50,000 |
Preview Before You Purchase
Invica Industries Porter's Five Forces Analysis
This preview shows the complete Porter’s Five Forces analysis for Invica Industries and is the exact file you’ll receive after purchase—fully formatted and ready to use. It covers competitive rivalry, supplier and buyer power, threats of substitution and entry with actionable insights. No samples or placeholders—instant download upon payment.
Description
Elevate Your Analysis with the Complete Porter's Five Forces Analysis
Invica Industries faces moderate supplier leverage, focused buyer segments, and evolving substitute threats that collectively shape its competitive intensity; rival rivalry is driven by scale and innovation. This brief snapshot only scratches the surface. Unlock the full Porter's Five Forces Analysis to explore Invica Industries’s competitive dynamics, market pressures, and strategic advantages in detail.
Suppliers Bargaining Power
Concentrated miners and smelters
Upstream supply of copper, aluminium and nickel is dominated by large miners and smelters—China holds about 60% of primary aluminium capacity and roughly half of global refined copper processing, while a few miners such as Codelco, BHP and Freeport control major mine volumes. Shutdowns, geopolitical shocks or maintenance can tighten availability and lift supplier leverage for traders dependent on a limited roster. Long‑term offtakes and regional diversification can temper this risk.
LME-linked pricing and premiums
Producers price off LME/SHFE benchmarks plus regional premiums, leaving little negotiation room; in 2024 LME-linked contracts remained the staple benchmark. Premiums can widen materially in tight markets, often adding roughly $50–200/tonne regionally, letting suppliers capture extra margin. Traders must pass through or hedge these moves via LME futures/options to protect spreads. Transparent benchmarks limit arbitrary base pricing but not premium swings.
Quality certifications and traceability
Industrial buyers of Invica demand certified grades, ESG provenance and consistent specs, and sourcing often hinges on accreditation: the 2023 ISO survey reported over 1.3 million ISO 9001 certificates globally, creating a pool of suppliers traders cannot easily replace. Suppliers with recognized certifications and responsible-sourcing credentials therefore hold bargaining power, constraining switching options. Building a certified supplier portfolio reduces single-supplier dependence and procurement risk.
Credit terms and allocation control
Suppliers shape Invica Industries cash cycles through advance-payment demands, LC requirements and shipment timing, often forcing earlier cash outflows and higher working capital; the ICC estimated a global trade finance gap near 1.7 trillion USD in 2023, tightening access to LCs and trade lines. In tight commodity markets suppliers prioritize long-standing buyers, squeezing smaller traders and compressing margins via allocation control. Strengthening balance sheet metrics and securing trade finance lines raises bargaining power and access to allocations.
- Advance payments reduce free cash flow
- LC reliance increases financing costs
- Allocation control compresses gross margins
- Strong balance sheet + trade lines improve supplier terms
Logistics and freight bottlenecks
Supply leverage: upstream concentration, LME pricing, trade finance gaps raise premiums
Upstream concentration (China ~60% AL, top miners Codelco/BHP/Freeport ~40% of major copper supply) and 2024 LME-linked pricing give suppliers high leverage; regional premiums often add $50–200/t. Trade finance strain (ICC gap ~1.7T USD in 2023) plus LC/advance pay needs tighten cash cycles and allocation power. Freight spikes (spot +~30% vs 2019) and certification requirements further raise switching costs.
| Factor | 2023–24 Metric |
|---|---|
| China aluminium share | ~60% |
| Supplier concentration (copper majors) | ~40% |
| Regional premiums | $50–200/tonne |
| Trade finance gap | $1.7T (2023) |
| Freight spike | +~30% vs 2019 |
What is included in the product
Detailed Word Document
Tailored exclusively for Invica Industries, this analysis uncovers key drivers of competition, customer influence, and market entry risks while identifying disruptive forces and substitutes that threaten market share. It also evaluates control held by suppliers and buyers and explores market dynamics that deter new entrants and protect incumbents.
Customizable Excel Spreadsheet
A concise one-sheet Porter's Five Forces summary for Invica Industries—perfect for quick strategic decisions and boardroom slides. Customize force levels to reflect new data or market shifts.
Customers Bargaining Power
Large industrial buyers consolidate demand
Large industrial buyers in automotive, construction and electrical OEMs aggregate sizeable volumes and negotiate aggressively. Top 10 automotive OEMs produced about 79 million light vehicles in 2023, concentrating purchasing power and enabling multi-year contracts, vendor‑managed inventory and tighter spreads. They demand technical support and penalties for delays, shifting risk to suppliers and boosting buyer power over traders.
High price transparency
LME and SHFE publish daily settlement prices and premiums, making market levels visible each trading day; buyers benchmark quotes instantly and solicit multiple offers, often within 24–48 hours. This transparency has compressed intermediary margins to mid-single digits (≈3–6% in 2024), forcing traders to compete on service rather than price alone. Value-added services—logistics, financing, technical support—become decisive to defend margins.
Switching among traders is feasible
For standard grades, buyers can switch among traders if specifications and reliability match, and low switching costs heighten price competition—2024 industry surveys show roughly 54% of repeat orders evaluate alternate suppliers within 12 months. Relationship quality and flexible credit terms often decide wins in tight bids. Strong service differentiation—logistics, JIT delivery, technical support—reduces buyer bargaining leverage and preserves margins.
Demand cyclicality and inventory timing
- Order cuts → lower volumes
- Deferred deliveries → higher WC
- Flexible contracts → risk allocation
ESG and compliance requirements
Buyers increasingly demand low-carbon, responsibly sourced metals with traceable audit trails; EU CSRD rollout in 2024 extends reporting to about 50,000 firms, raising qualification hurdles for traders. Non-compliant supply is often excluded, narrowing trader options and increasing buyer leverage. Offering verified supply can command a measurable value premium.
- CSRD 2024: ~50,000 firms affected
- Higher qualification barriers for traders
- Verified supply = premium pricing opportunity
OEM concentration boosts buyer power as market transparency cuts trader margins to 3-6%
Large OEMs concentrate buying (top 10 = 79M vehicles in 2023) and secure long contracts, raising buyer power. Market transparency (LME/SHFE) cut trader margins to ~3–6% in 2024 and 54% of buyers evaluate alternatives within 12 months. CSRD expansion (~50,000 firms in 2024) raises compliance hurdles, favoring verified‑supply traders.
| Metric | Value |
|---|---|
| Top‑10 OEM output (2023) | ≈79M vehicles |
| Trader margins (2024) | ≈3–6% |
| Buyers switching eval (12m) | ≈54% |
| Firms affected by CSRD (2024) | ≈50,000 |
Preview Before You Purchase
Invica Industries Porter's Five Forces Analysis
This preview shows the complete Porter’s Five Forces analysis for Invica Industries and is the exact file you’ll receive after purchase—fully formatted and ready to use. It covers competitive rivalry, supplier and buyer power, threats of substitution and entry with actionable insights. No samples or placeholders—instant download upon payment.











