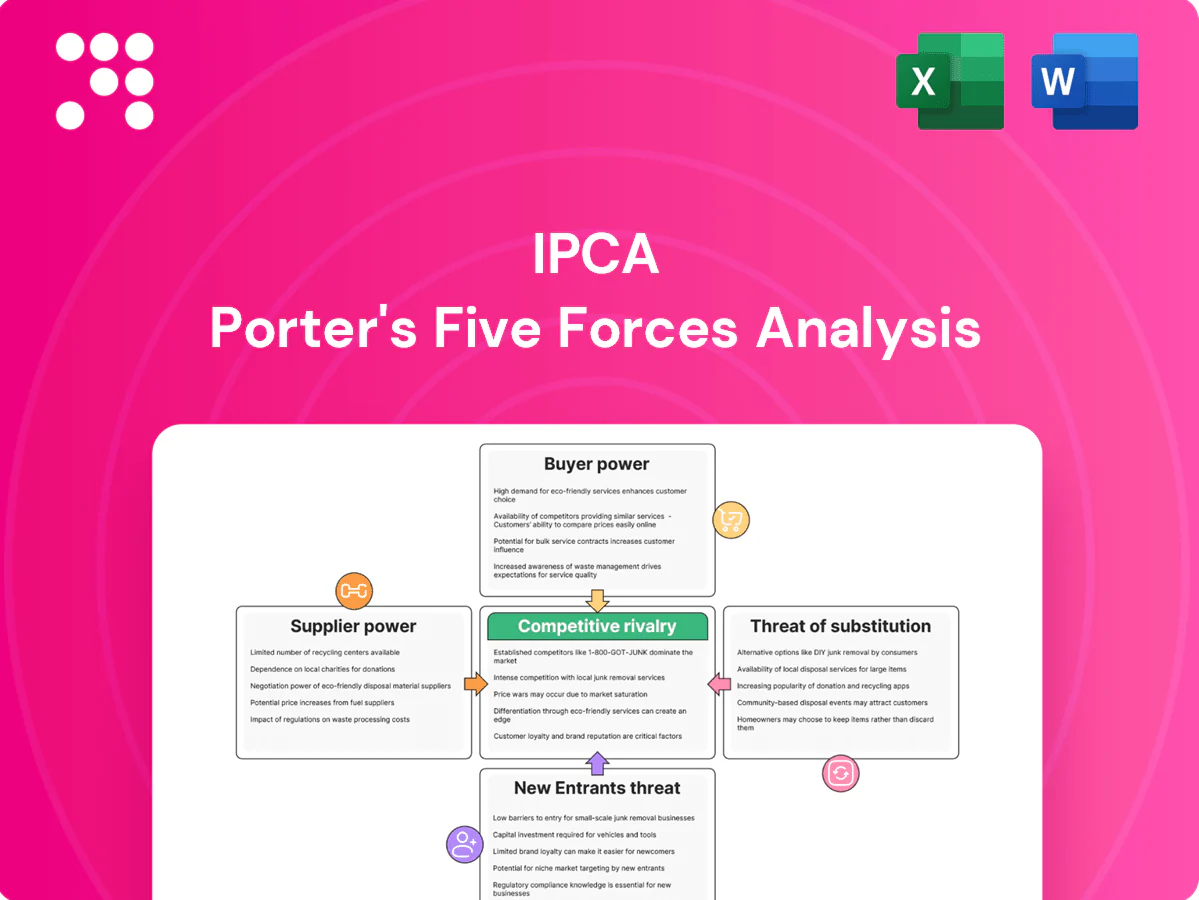
Ipca Porter's Five Forces Analysis

A Must-Have Tool for Decision-Makers
This snapshot highlights Ipca’s industry structure—supplier power, buyer leverage, threat of new entrants, substitutes and competitive rivalry. Use it to capture immediate strategic signals and inform investment decisions. Unlock the complete Porter's Five Forces Analysis for force-by-force ratings, visuals and tailored business implications.
Suppliers Bargaining Power

KSM/solvent dependence
Ipca sources key starting materials and solvents from a limited supplier base concentrated in India and China, with China supplying roughly 66% of India’s bulk drug intermediates in 2024, increasing exposure to price swings. Concentration in specific intermediates can elevate supplier bargaining power in the short run, pressuring margins during tight supply. Dual-sourcing and vendor qualification reduce but do not eliminate risk; any disruption can ripple into API and formulation output.
Regulatory-grade inputs
Pharma-grade excipients and intermediates must meet stringent global standards, narrowing approved supplier pools; the global excipients market was about USD 6.5bn in 2024, with the top suppliers controlling roughly 55% of volumes. Compliance and GMP upgrade costs have risen ~20% for vendors, allowing firmer pricing. Ipca’s supplier audits and quality agreements reduce substitutability and increase reliance on niche, compliant suppliers.

Supplier switching costs
Changing approved suppliers requires validation, stability studies (typically 6–12 months) and regulatory notifications (commonly 3–9 months), raising technical/time costs and dependence on incumbents; for WHO‑prequalified or tender‑linked products variation timelines often extend 9–12 months and procurement lead times 6–18 months, allowing suppliers to extract better commercial terms during negotiations.

Backward integration
Ipca’s sizable API presence and 11 manufacturing facilities (2024) reduce reliance on external suppliers for many inputs, lowering supplier leverage. Backward integration and captive capabilities dampen supplier power in core API lines, though dependence remains for select KSMs and specialized reagents procured externally. Overall effect is mixed but generally moderating on supplier bargaining power.
- API scale: lowers supplier dependence
- Backward integration: moderates supplier power
- Residual risk: KSMs and specialty reagents
Logistics & geopolitics
Freight volatility (container rates ~1,500–2,000 USD/FEU in 2024 vs peaks >10,000 USD/FEU in 2021), INR at ~83/USd in 2024 and ongoing geopolitics raise import cost and reliability risks for Ipca.
Just-in-time strains in shocks lift supplier leverage; buffer inventories reduce disruption but increase working capital; global vendor diversification partly offsets risk.
- Freight volatility: 1,500–2,000 USD/FEU (2024)
- Currency: INR ~83/USD (2024)
- Mitigation: buffer inventories vs working capital
- Risk offset: global vendor diversification
Pharma supply risk - China 66% intermediates; freight & INR raise costs
Ipca faces moderate supplier bargaining power: China supplied ~66% of India’s bulk drug intermediates in 2024, concentrating price and availability risk for select KSMs. Pharma-grade excipients market ~USD 6.5bn in 2024 with top suppliers ~55% share, raising switching costs; validation and regulatory variation often take 6–12 months. Ipca’s 11 plants and backward integration moderate supplier leverage, though freight (USD 1,500–2,000/FEU) and INR ~83/USD add cost volatility.
| Metric | Value (2024) | Impact |
|---|---|---|
| China share (intermediates) | ~66% | Concentration risk |
| Excipients market | USD 6.5bn | Fewer suppliers |
| Ipca facilities | 11 | Lower dependence |
| Freight | USD 1,500–2,000/FEU | Cost volatility |
What is included in the product
 Detailed Word Document
Tailored Porter's Five Forces analysis for Ipca that uncovers key drivers of competition, customer influence, supplier power, and market entry risks, identifying disruptive substitutes and emerging threats to market share. Detailed strategic commentary highlights pricing influence, barriers protecting incumbents, and actionable insights for investors, managers, and academics.

 Customizable Excel Spreadsheet
A concise, one-sheet Porter's Five Forces for Ipca that turns strategic complexity into quick decisions—customize force levels, swap in current data, and view instant pressure via a spider chart for deck-ready visuals.
Customers Bargaining Power

Government tenders
Large public tenders and multilateral procurement (e.g., anti-malarials) centralize volume and increase price sensitivity; Global Fund commitments reached 14.25 billion USD at the 2023 replenishment, underscoring scale. Buyers exert high bargaining power via competitive bidding and framework agreements, tightening margins. Compliance, quality certifications and on-time delivery become key differentiators that protect pricing and access to these channels.
Distributor leverage
In branded generics, wholesalers and retail chains press Ipca for deeper discounts and preferential shelf space as consolidation lifts their leverage; large chains now command greater bargaining clout. Ipca must trade discounts against prescriber pull-through and marketing support, with working capital terms commonly stretching 60–90 days, reflecting the power dynamic.

Price controls
India’s NPPA enforces DPCO 2013 pricing for drugs on the NLEM (NLEM 2015 lists 348 drugs), using ceiling prices calculated from simple averages of brands with market share >1%, compressing realizations. Ceiling limits reduce sellers’ ability to pass rising input costs, effectively increasing buyer bargaining power. Ipca must manage portfolio mix and margin protection via non-NLEM and specialty products. Export markets can offset volumes but face tender-driven price erosion.

Therapeutic substitutability
Therapeutic substitutability is high for Ipca as genericized categories offer many interchangeable alternatives, empowering prescribers and payers; in India generics accounted for about 70% of prescriptions by volume in 2024. Switching costs for patients are low where bioequivalent options exist, so price and availability dominate purchasing decisions, though formulation differentiation and brand equity can preserve margins for select products.
- High substitutability — many bioequivalents
- Low patient switching costs
- Price/availability prioritized by buyers
- Formulation/brand equity can mitigate pressure
Brand loyalty
In India’s branded generics (market ~USD 42bn in 2024) physician and patient familiarity gives franchise-level stickiness that moderates buyer power for Ipca; however, loyalty erodes quickly under aggressive competitor pricing or stock-outs, as seen in several acute care segments in 2024. Continuous medical outreach and high service levels remain essential to retain share.
- Branded generics: majority of prescriptions (>70%) in 2024
- Risk: price cuts/stock-outs reduce loyalty fast
- Mitigation: sustained MCO and service excellence
Branded generics margin squeeze: powerful buyers, pricing caps and channel consolidation
Buyers wield high bargaining power via large tenders and framework contracts (Global Fund replenishment 14.25 billion USD in 2023) and DPCO/NLEM pricing (348 drugs), compressing margins. Branded generics (India market ~USD 42bn in 2024; >70% prescriptions by volume) face channel consolidation, 60–90 day payment terms and high substitutability, forcing discounts or focus on specialty/non-NLEM lines. Quality, on-time delivery and brand/franchise support are key defenses.
| Metric | Value (2023/24) |
|---|---|
| Global Fund replenishment | 14.25 bn USD (2023) |
| India pharma market | ~42 bn USD (2024) |
| Generics prescriptions | >70% by volume (2024) |
| NLEM drugs | 348 |
| Payment terms | 60–90 days |
Full Version Awaits
Ipca Porter's Five Forces Analysis
This preview shows the exact Ipca Porter's Five Forces analysis you'll receive after purchase — a complete, professionally formatted assessment of competitive rivalry, buyer and supplier power, threat of substitutes, and barriers to entry. You'll get instant access to this same file with no placeholders or mockups.

A Must-Have Tool for Decision-Makers
This snapshot highlights Ipca’s industry structure—supplier power, buyer leverage, threat of new entrants, substitutes and competitive rivalry. Use it to capture immediate strategic signals and inform investment decisions. Unlock the complete Porter's Five Forces Analysis for force-by-force ratings, visuals and tailored business implications.
Suppliers Bargaining Power
KSM/solvent dependence
Ipca sources key starting materials and solvents from a limited supplier base concentrated in India and China, with China supplying roughly 66% of India’s bulk drug intermediates in 2024, increasing exposure to price swings. Concentration in specific intermediates can elevate supplier bargaining power in the short run, pressuring margins during tight supply. Dual-sourcing and vendor qualification reduce but do not eliminate risk; any disruption can ripple into API and formulation output.
Regulatory-grade inputs
Pharma-grade excipients and intermediates must meet stringent global standards, narrowing approved supplier pools; the global excipients market was about USD 6.5bn in 2024, with the top suppliers controlling roughly 55% of volumes. Compliance and GMP upgrade costs have risen ~20% for vendors, allowing firmer pricing. Ipca’s supplier audits and quality agreements reduce substitutability and increase reliance on niche, compliant suppliers.
Supplier switching costs
Changing approved suppliers requires validation, stability studies (typically 6–12 months) and regulatory notifications (commonly 3–9 months), raising technical/time costs and dependence on incumbents; for WHO‑prequalified or tender‑linked products variation timelines often extend 9–12 months and procurement lead times 6–18 months, allowing suppliers to extract better commercial terms during negotiations.
Backward integration
Ipca’s sizable API presence and 11 manufacturing facilities (2024) reduce reliance on external suppliers for many inputs, lowering supplier leverage. Backward integration and captive capabilities dampen supplier power in core API lines, though dependence remains for select KSMs and specialized reagents procured externally. Overall effect is mixed but generally moderating on supplier bargaining power.
- API scale: lowers supplier dependence
- Backward integration: moderates supplier power
- Residual risk: KSMs and specialty reagents
Logistics & geopolitics
Freight volatility (container rates ~1,500–2,000 USD/FEU in 2024 vs peaks >10,000 USD/FEU in 2021), INR at ~83/USd in 2024 and ongoing geopolitics raise import cost and reliability risks for Ipca.
Just-in-time strains in shocks lift supplier leverage; buffer inventories reduce disruption but increase working capital; global vendor diversification partly offsets risk.
- Freight volatility: 1,500–2,000 USD/FEU (2024)
- Currency: INR ~83/USD (2024)
- Mitigation: buffer inventories vs working capital
- Risk offset: global vendor diversification
Pharma supply risk - China 66% intermediates; freight & INR raise costs
Ipca faces moderate supplier bargaining power: China supplied ~66% of India’s bulk drug intermediates in 2024, concentrating price and availability risk for select KSMs. Pharma-grade excipients market ~USD 6.5bn in 2024 with top suppliers ~55% share, raising switching costs; validation and regulatory variation often take 6–12 months. Ipca’s 11 plants and backward integration moderate supplier leverage, though freight (USD 1,500–2,000/FEU) and INR ~83/USD add cost volatility.
| Metric | Value (2024) | Impact |
|---|---|---|
| China share (intermediates) | ~66% | Concentration risk |
| Excipients market | USD 6.5bn | Fewer suppliers |
| Ipca facilities | 11 | Lower dependence |
| Freight | USD 1,500–2,000/FEU | Cost volatility |
What is included in the product
Detailed Word Document
Tailored Porter's Five Forces analysis for Ipca that uncovers key drivers of competition, customer influence, supplier power, and market entry risks, identifying disruptive substitutes and emerging threats to market share. Detailed strategic commentary highlights pricing influence, barriers protecting incumbents, and actionable insights for investors, managers, and academics.
Customizable Excel Spreadsheet
A concise, one-sheet Porter's Five Forces for Ipca that turns strategic complexity into quick decisions—customize force levels, swap in current data, and view instant pressure via a spider chart for deck-ready visuals.
Customers Bargaining Power
Government tenders
Large public tenders and multilateral procurement (e.g., anti-malarials) centralize volume and increase price sensitivity; Global Fund commitments reached 14.25 billion USD at the 2023 replenishment, underscoring scale. Buyers exert high bargaining power via competitive bidding and framework agreements, tightening margins. Compliance, quality certifications and on-time delivery become key differentiators that protect pricing and access to these channels.
Distributor leverage
In branded generics, wholesalers and retail chains press Ipca for deeper discounts and preferential shelf space as consolidation lifts their leverage; large chains now command greater bargaining clout. Ipca must trade discounts against prescriber pull-through and marketing support, with working capital terms commonly stretching 60–90 days, reflecting the power dynamic.
Price controls
India’s NPPA enforces DPCO 2013 pricing for drugs on the NLEM (NLEM 2015 lists 348 drugs), using ceiling prices calculated from simple averages of brands with market share >1%, compressing realizations. Ceiling limits reduce sellers’ ability to pass rising input costs, effectively increasing buyer bargaining power. Ipca must manage portfolio mix and margin protection via non-NLEM and specialty products. Export markets can offset volumes but face tender-driven price erosion.
Therapeutic substitutability
Therapeutic substitutability is high for Ipca as genericized categories offer many interchangeable alternatives, empowering prescribers and payers; in India generics accounted for about 70% of prescriptions by volume in 2024. Switching costs for patients are low where bioequivalent options exist, so price and availability dominate purchasing decisions, though formulation differentiation and brand equity can preserve margins for select products.
- High substitutability — many bioequivalents
- Low patient switching costs
- Price/availability prioritized by buyers
- Formulation/brand equity can mitigate pressure
Brand loyalty
In India’s branded generics (market ~USD 42bn in 2024) physician and patient familiarity gives franchise-level stickiness that moderates buyer power for Ipca; however, loyalty erodes quickly under aggressive competitor pricing or stock-outs, as seen in several acute care segments in 2024. Continuous medical outreach and high service levels remain essential to retain share.
- Branded generics: majority of prescriptions (>70%) in 2024
- Risk: price cuts/stock-outs reduce loyalty fast
- Mitigation: sustained MCO and service excellence
Branded generics margin squeeze: powerful buyers, pricing caps and channel consolidation
Buyers wield high bargaining power via large tenders and framework contracts (Global Fund replenishment 14.25 billion USD in 2023) and DPCO/NLEM pricing (348 drugs), compressing margins. Branded generics (India market ~USD 42bn in 2024; >70% prescriptions by volume) face channel consolidation, 60–90 day payment terms and high substitutability, forcing discounts or focus on specialty/non-NLEM lines. Quality, on-time delivery and brand/franchise support are key defenses.
| Metric | Value (2023/24) |
|---|---|
| Global Fund replenishment | 14.25 bn USD (2023) |
| India pharma market | ~42 bn USD (2024) |
| Generics prescriptions | >70% by volume (2024) |
| NLEM drugs | 348 |
| Payment terms | 60–90 days |
Full Version Awaits
Ipca Porter's Five Forces Analysis
This preview shows the exact Ipca Porter's Five Forces analysis you'll receive after purchase — a complete, professionally formatted assessment of competitive rivalry, buyer and supplier power, threat of substitutes, and barriers to entry. You'll get instant access to this same file with no placeholders or mockups.
Description
A Must-Have Tool for Decision-Makers
This snapshot highlights Ipca’s industry structure—supplier power, buyer leverage, threat of new entrants, substitutes and competitive rivalry. Use it to capture immediate strategic signals and inform investment decisions. Unlock the complete Porter's Five Forces Analysis for force-by-force ratings, visuals and tailored business implications.
Suppliers Bargaining Power
KSM/solvent dependence
Ipca sources key starting materials and solvents from a limited supplier base concentrated in India and China, with China supplying roughly 66% of India’s bulk drug intermediates in 2024, increasing exposure to price swings. Concentration in specific intermediates can elevate supplier bargaining power in the short run, pressuring margins during tight supply. Dual-sourcing and vendor qualification reduce but do not eliminate risk; any disruption can ripple into API and formulation output.
Regulatory-grade inputs
Pharma-grade excipients and intermediates must meet stringent global standards, narrowing approved supplier pools; the global excipients market was about USD 6.5bn in 2024, with the top suppliers controlling roughly 55% of volumes. Compliance and GMP upgrade costs have risen ~20% for vendors, allowing firmer pricing. Ipca’s supplier audits and quality agreements reduce substitutability and increase reliance on niche, compliant suppliers.
Supplier switching costs
Changing approved suppliers requires validation, stability studies (typically 6–12 months) and regulatory notifications (commonly 3–9 months), raising technical/time costs and dependence on incumbents; for WHO‑prequalified or tender‑linked products variation timelines often extend 9–12 months and procurement lead times 6–18 months, allowing suppliers to extract better commercial terms during negotiations.
Backward integration
Ipca’s sizable API presence and 11 manufacturing facilities (2024) reduce reliance on external suppliers for many inputs, lowering supplier leverage. Backward integration and captive capabilities dampen supplier power in core API lines, though dependence remains for select KSMs and specialized reagents procured externally. Overall effect is mixed but generally moderating on supplier bargaining power.
- API scale: lowers supplier dependence
- Backward integration: moderates supplier power
- Residual risk: KSMs and specialty reagents
Logistics & geopolitics
Freight volatility (container rates ~1,500–2,000 USD/FEU in 2024 vs peaks >10,000 USD/FEU in 2021), INR at ~83/USd in 2024 and ongoing geopolitics raise import cost and reliability risks for Ipca.
Just-in-time strains in shocks lift supplier leverage; buffer inventories reduce disruption but increase working capital; global vendor diversification partly offsets risk.
- Freight volatility: 1,500–2,000 USD/FEU (2024)
- Currency: INR ~83/USD (2024)
- Mitigation: buffer inventories vs working capital
- Risk offset: global vendor diversification
Pharma supply risk - China 66% intermediates; freight & INR raise costs
Ipca faces moderate supplier bargaining power: China supplied ~66% of India’s bulk drug intermediates in 2024, concentrating price and availability risk for select KSMs. Pharma-grade excipients market ~USD 6.5bn in 2024 with top suppliers ~55% share, raising switching costs; validation and regulatory variation often take 6–12 months. Ipca’s 11 plants and backward integration moderate supplier leverage, though freight (USD 1,500–2,000/FEU) and INR ~83/USD add cost volatility.
| Metric | Value (2024) | Impact |
|---|---|---|
| China share (intermediates) | ~66% | Concentration risk |
| Excipients market | USD 6.5bn | Fewer suppliers |
| Ipca facilities | 11 | Lower dependence |
| Freight | USD 1,500–2,000/FEU | Cost volatility |
What is included in the product
Detailed Word Document
Tailored Porter's Five Forces analysis for Ipca that uncovers key drivers of competition, customer influence, supplier power, and market entry risks, identifying disruptive substitutes and emerging threats to market share. Detailed strategic commentary highlights pricing influence, barriers protecting incumbents, and actionable insights for investors, managers, and academics.
Customizable Excel Spreadsheet
A concise, one-sheet Porter's Five Forces for Ipca that turns strategic complexity into quick decisions—customize force levels, swap in current data, and view instant pressure via a spider chart for deck-ready visuals.
Customers Bargaining Power
Government tenders
Large public tenders and multilateral procurement (e.g., anti-malarials) centralize volume and increase price sensitivity; Global Fund commitments reached 14.25 billion USD at the 2023 replenishment, underscoring scale. Buyers exert high bargaining power via competitive bidding and framework agreements, tightening margins. Compliance, quality certifications and on-time delivery become key differentiators that protect pricing and access to these channels.
Distributor leverage
In branded generics, wholesalers and retail chains press Ipca for deeper discounts and preferential shelf space as consolidation lifts their leverage; large chains now command greater bargaining clout. Ipca must trade discounts against prescriber pull-through and marketing support, with working capital terms commonly stretching 60–90 days, reflecting the power dynamic.
Price controls
India’s NPPA enforces DPCO 2013 pricing for drugs on the NLEM (NLEM 2015 lists 348 drugs), using ceiling prices calculated from simple averages of brands with market share >1%, compressing realizations. Ceiling limits reduce sellers’ ability to pass rising input costs, effectively increasing buyer bargaining power. Ipca must manage portfolio mix and margin protection via non-NLEM and specialty products. Export markets can offset volumes but face tender-driven price erosion.
Therapeutic substitutability
Therapeutic substitutability is high for Ipca as genericized categories offer many interchangeable alternatives, empowering prescribers and payers; in India generics accounted for about 70% of prescriptions by volume in 2024. Switching costs for patients are low where bioequivalent options exist, so price and availability dominate purchasing decisions, though formulation differentiation and brand equity can preserve margins for select products.
- High substitutability — many bioequivalents
- Low patient switching costs
- Price/availability prioritized by buyers
- Formulation/brand equity can mitigate pressure
Brand loyalty
In India’s branded generics (market ~USD 42bn in 2024) physician and patient familiarity gives franchise-level stickiness that moderates buyer power for Ipca; however, loyalty erodes quickly under aggressive competitor pricing or stock-outs, as seen in several acute care segments in 2024. Continuous medical outreach and high service levels remain essential to retain share.
- Branded generics: majority of prescriptions (>70%) in 2024
- Risk: price cuts/stock-outs reduce loyalty fast
- Mitigation: sustained MCO and service excellence
Branded generics margin squeeze: powerful buyers, pricing caps and channel consolidation
Buyers wield high bargaining power via large tenders and framework contracts (Global Fund replenishment 14.25 billion USD in 2023) and DPCO/NLEM pricing (348 drugs), compressing margins. Branded generics (India market ~USD 42bn in 2024; >70% prescriptions by volume) face channel consolidation, 60–90 day payment terms and high substitutability, forcing discounts or focus on specialty/non-NLEM lines. Quality, on-time delivery and brand/franchise support are key defenses.
| Metric | Value (2023/24) |
|---|---|
| Global Fund replenishment | 14.25 bn USD (2023) |
| India pharma market | ~42 bn USD (2024) |
| Generics prescriptions | >70% by volume (2024) |
| NLEM drugs | 348 |
| Payment terms | 60–90 days |
Full Version Awaits
Ipca Porter's Five Forces Analysis
This preview shows the exact Ipca Porter's Five Forces analysis you'll receive after purchase — a complete, professionally formatted assessment of competitive rivalry, buyer and supplier power, threat of substitutes, and barriers to entry. You'll get instant access to this same file with no placeholders or mockups.











