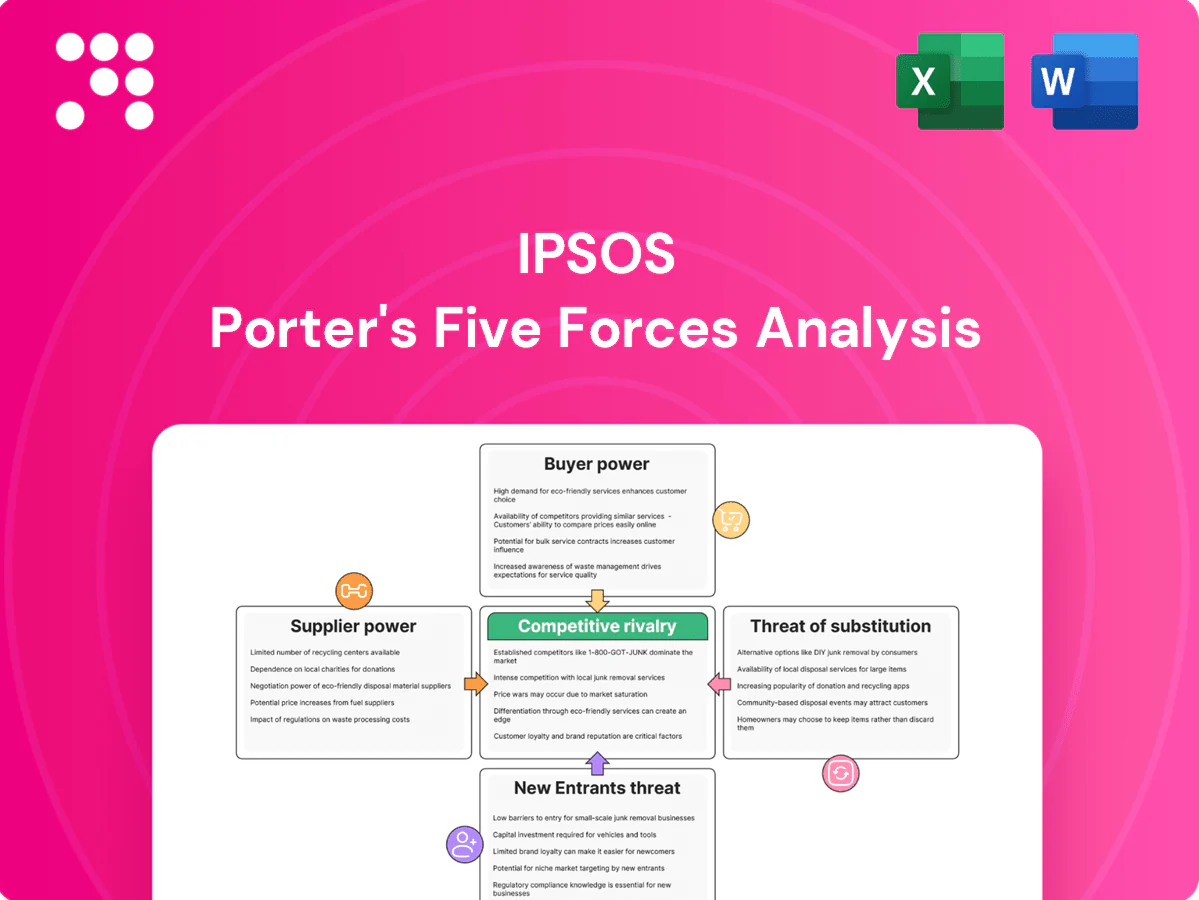
Ipsos Porter's Five Forces Analysis

Go Beyond the Preview—Access the Full Strategic Report
Ipsos faces moderate buyer power and rising substitute threats as digital research tools lower entry barriers; supplier leverage is limited but talent scarcity raises costs. Competitive rivalry is intense among global firms and new entrants pose niche threats. This snapshot only scratches the surface. Unlock the full Porter's Five Forces Analysis to explore Ipsos’s competitive dynamics in detail.
Suppliers Bargaining Power

Panel and sample marketplaces
Independent panel owners and sample exchanges supply respondent access, a core input for Ipsos, and in 2024 Ipsos increased investment in proprietary panels to reduce supplier dependence. Concentration among high-quality panels gives them leverage on pricing and quotas, raising costs for buyers. Multi-sourcing and in-house panels mitigate dependence, but quality variance and fraud risks boost switching and vetting costs.
Data and API providers
Third-party data (location, purchase, demographic, social APIs) augments Ipsos surveys but is often scarce or proprietary; the data-broker market was estimated near $200bn globally in 2024, increasing supplier leverage. Strict licensing, GDPR/CPRA constraints and API rate limits raise costs and switching frictions. Ipsos reported roughly €2.3bn revenue in 2023 and offsets exposure via partnerships and first-party assets, yet unique datasets remain hard to replace quickly.

Tech stack vendors
Cloud, survey platforms, transcription and AI/ML tools are essential enablers for Ipsos; the top three cloud providers held about 64% of the cloud market in 2024, creating supplier concentration risk. Integration and strict security/compliance needs increase vendor stickiness and switching costs. Supplier price hikes or feature gating can compress margins. Strategic vendor diversification and selective internal tooling development reduce supplier leverage.

Local fieldwork and specialists
Local moderators, translators, ethnographers and CATI facilities exert notable supplier power in niche markets; 2024 industry data indicate premiums of roughly 20–35% for scarce languages or segments, which increases scheduling leverage. Long-term relationships and preferred supplier networks commonly reduce cost volatility and secure capacity. Heightened quality-control needs raise coordination time and project management costs.
- Scarcity premium: 20–35% (2024)
- Preferred suppliers cut volatility
- QC increases coordination effort
Incentive and compliance costs
- Incentives: $10–30
- Processor fees: 1.5–3.5% + $0.25–$0.50
- Compliance retainers: $50k–200k
- 2024 cost pressures: inflation + regulatory changes
Moderate-high supplier power, pricing pressure from data brokers and cloud concentration
Supplier power is moderate-high: proprietary panels reduce exposure but top panels hold pricing leverage; data-broker market ≈$200bn (2024) raises supplier rents; top-3 cloud share ≈64% (2024) creates vendor stickiness; respondent incentives $10–30 and processor fees 1.5–3.5% + $0.25–$0.50 squeeze margins.
| Item | 2024 Figure |
|---|---|
| Data-broker market | $200bn |
| Top-3 cloud share | 64% |
| Incentives | $10–30 |
| Processor fees | 1.5–3.5% + $0.25–$0.50 |
| Scarcity premium | 20–35% |
What is included in the product
 Detailed Word Document
Comprehensive Porter's Five Forces analysis tailored to Ipsos, detailing competitive rivalry, buyer and supplier power, threat of new entrants and substitutes, plus disruptive and regulatory risks, with strategic commentary and editable Word format for easy integration into reports, investor materials, or internal strategy decks.

 Customizable Excel Spreadsheet
A concise Ipsos Porter's Five Forces one-sheet that simplifies competitive pressure, with adjustable scores and an instant radar chart for strategic clarity—ready to drop into decks or dashboards without complex setup.
Customers Bargaining Power

Enterprise and government RFPs
Large enterprise and government RFPs run competitive tenders that emphasize price, methodology and past performance, with procurement cycles often spanning 6–24 months. Public procurement represented about 12% of GDP in OECD countries in 2024, giving large buyers scale and bargaining leverage. Volume discounts and published rate cards are commonly required and losing a multi-year frame agreement can materially dent an agency’s project pipeline.
Moderate switching costs
Standardized methodologies across the roughly US$90 billion global market research industry in 2024 make switching between providers feasible, reducing lock-in. Institutional knowledge, longitudinal trackers and established trust create frictions that raise effective switching costs. Buyers leverage this mix to extract better commercial terms, often securing discounts or service bundles. Widespread use of multi-vendor rosters (commonly 3–5 suppliers) keeps downward pressure on rates.

Speed and agility demands
Clients now demand rapid turnarounds and always-on dashboards, and Ipsos reported roughly €2.0bn in 2024 revenue, reflecting scale to meet these expectations. Tight timelines frequently shift rush costs onto vendors, raising buyer bargaining power through service-level penalties. Differentiation via faster, automated workflows and real-time delivery can rebalance power by reducing penalty exposure and improving margin.

DIY and benchmarking options
DIY platforms and internal analytics now provide credible low-cost alternatives for simpler research, pressuring Ipsos on commoditized surveys; ESOMAR estimated the global market research industry at about $85bn in 2024, amplifying buyer leverage.
Procurement routinely benchmarks rates across regions and suppliers, anchoring pricing and compressing margins on repeatable work, while complex, high-stakes projects remain less price-elastic.
- DIY alternatives up buyer leverage
- Benchmarks anchor fees
- Margins compressed on commoditized studies
- High-stakes projects retain pricing power
Global coverage requirements
Multinational buyers favor vendors who can deliver consistently across markets; Ipsos operates in over 90 markets, meeting that baseline for global coverage. Buyer consolidation into a few preferred global partners raises selection competition. After onboarding, clients push for rate harmonization. Distinct cross-border capabilities can command premiums when rare.
- Global reach: Ipsos in 90+ markets
- Consolidation: fewer global partners
- Post-onboard leverage: rate harmonization
- Premiums: for unique cross-border capabilities
Public procurement (~12% GDP) and rosters squeeze fees; scale and methods cushion
Large buyers (public procurement ~12% of OECD GDP in 2024) and multi-vendor rosters drive price/term pressure; losing frame agreements hurts pipelines. Standardized methods in the ~$85–90bn market and DIY tools raise switching options, while Ipsos scale (€2.0bn 2024) offsets some pressure on complex projects.
| Metric | 2024 |
|---|---|
| Global MR market | $85–90bn |
| Ipsos revenue | €2.0bn |
| Public procurement | ~12% GDP (OECD) |
Full Version Awaits
Ipsos Porter's Five Forces Analysis
This preview shows the exact Ipsos Porter's Five Forces analysis you'll receive after purchase—no placeholders or surprises. The document displayed is the full, professionally formatted file, ready for immediate download and use. Once you complete payment you'll have instant access to this identical deliverable.

Go Beyond the Preview—Access the Full Strategic Report
Ipsos faces moderate buyer power and rising substitute threats as digital research tools lower entry barriers; supplier leverage is limited but talent scarcity raises costs. Competitive rivalry is intense among global firms and new entrants pose niche threats. This snapshot only scratches the surface. Unlock the full Porter's Five Forces Analysis to explore Ipsos’s competitive dynamics in detail.
Suppliers Bargaining Power
Panel and sample marketplaces
Independent panel owners and sample exchanges supply respondent access, a core input for Ipsos, and in 2024 Ipsos increased investment in proprietary panels to reduce supplier dependence. Concentration among high-quality panels gives them leverage on pricing and quotas, raising costs for buyers. Multi-sourcing and in-house panels mitigate dependence, but quality variance and fraud risks boost switching and vetting costs.
Data and API providers
Third-party data (location, purchase, demographic, social APIs) augments Ipsos surveys but is often scarce or proprietary; the data-broker market was estimated near $200bn globally in 2024, increasing supplier leverage. Strict licensing, GDPR/CPRA constraints and API rate limits raise costs and switching frictions. Ipsos reported roughly €2.3bn revenue in 2023 and offsets exposure via partnerships and first-party assets, yet unique datasets remain hard to replace quickly.
Tech stack vendors
Cloud, survey platforms, transcription and AI/ML tools are essential enablers for Ipsos; the top three cloud providers held about 64% of the cloud market in 2024, creating supplier concentration risk. Integration and strict security/compliance needs increase vendor stickiness and switching costs. Supplier price hikes or feature gating can compress margins. Strategic vendor diversification and selective internal tooling development reduce supplier leverage.
Local fieldwork and specialists
Local moderators, translators, ethnographers and CATI facilities exert notable supplier power in niche markets; 2024 industry data indicate premiums of roughly 20–35% for scarce languages or segments, which increases scheduling leverage. Long-term relationships and preferred supplier networks commonly reduce cost volatility and secure capacity. Heightened quality-control needs raise coordination time and project management costs.
- Scarcity premium: 20–35% (2024)
- Preferred suppliers cut volatility
- QC increases coordination effort
Incentive and compliance costs
- Incentives: $10–30
- Processor fees: 1.5–3.5% + $0.25–$0.50
- Compliance retainers: $50k–200k
- 2024 cost pressures: inflation + regulatory changes
Moderate-high supplier power, pricing pressure from data brokers and cloud concentration
Supplier power is moderate-high: proprietary panels reduce exposure but top panels hold pricing leverage; data-broker market ≈$200bn (2024) raises supplier rents; top-3 cloud share ≈64% (2024) creates vendor stickiness; respondent incentives $10–30 and processor fees 1.5–3.5% + $0.25–$0.50 squeeze margins.
| Item | 2024 Figure |
|---|---|
| Data-broker market | $200bn |
| Top-3 cloud share | 64% |
| Incentives | $10–30 |
| Processor fees | 1.5–3.5% + $0.25–$0.50 |
| Scarcity premium | 20–35% |
What is included in the product
Detailed Word Document
Comprehensive Porter's Five Forces analysis tailored to Ipsos, detailing competitive rivalry, buyer and supplier power, threat of new entrants and substitutes, plus disruptive and regulatory risks, with strategic commentary and editable Word format for easy integration into reports, investor materials, or internal strategy decks.
Customizable Excel Spreadsheet
A concise Ipsos Porter's Five Forces one-sheet that simplifies competitive pressure, with adjustable scores and an instant radar chart for strategic clarity—ready to drop into decks or dashboards without complex setup.
Customers Bargaining Power
Enterprise and government RFPs
Large enterprise and government RFPs run competitive tenders that emphasize price, methodology and past performance, with procurement cycles often spanning 6–24 months. Public procurement represented about 12% of GDP in OECD countries in 2024, giving large buyers scale and bargaining leverage. Volume discounts and published rate cards are commonly required and losing a multi-year frame agreement can materially dent an agency’s project pipeline.
Moderate switching costs
Standardized methodologies across the roughly US$90 billion global market research industry in 2024 make switching between providers feasible, reducing lock-in. Institutional knowledge, longitudinal trackers and established trust create frictions that raise effective switching costs. Buyers leverage this mix to extract better commercial terms, often securing discounts or service bundles. Widespread use of multi-vendor rosters (commonly 3–5 suppliers) keeps downward pressure on rates.
Speed and agility demands
Clients now demand rapid turnarounds and always-on dashboards, and Ipsos reported roughly €2.0bn in 2024 revenue, reflecting scale to meet these expectations. Tight timelines frequently shift rush costs onto vendors, raising buyer bargaining power through service-level penalties. Differentiation via faster, automated workflows and real-time delivery can rebalance power by reducing penalty exposure and improving margin.
DIY and benchmarking options
DIY platforms and internal analytics now provide credible low-cost alternatives for simpler research, pressuring Ipsos on commoditized surveys; ESOMAR estimated the global market research industry at about $85bn in 2024, amplifying buyer leverage.
Procurement routinely benchmarks rates across regions and suppliers, anchoring pricing and compressing margins on repeatable work, while complex, high-stakes projects remain less price-elastic.
- DIY alternatives up buyer leverage
- Benchmarks anchor fees
- Margins compressed on commoditized studies
- High-stakes projects retain pricing power
Global coverage requirements
Multinational buyers favor vendors who can deliver consistently across markets; Ipsos operates in over 90 markets, meeting that baseline for global coverage. Buyer consolidation into a few preferred global partners raises selection competition. After onboarding, clients push for rate harmonization. Distinct cross-border capabilities can command premiums when rare.
- Global reach: Ipsos in 90+ markets
- Consolidation: fewer global partners
- Post-onboard leverage: rate harmonization
- Premiums: for unique cross-border capabilities
Public procurement (~12% GDP) and rosters squeeze fees; scale and methods cushion
Large buyers (public procurement ~12% of OECD GDP in 2024) and multi-vendor rosters drive price/term pressure; losing frame agreements hurts pipelines. Standardized methods in the ~$85–90bn market and DIY tools raise switching options, while Ipsos scale (€2.0bn 2024) offsets some pressure on complex projects.
| Metric | 2024 |
|---|---|
| Global MR market | $85–90bn |
| Ipsos revenue | €2.0bn |
| Public procurement | ~12% GDP (OECD) |
Full Version Awaits
Ipsos Porter's Five Forces Analysis
This preview shows the exact Ipsos Porter's Five Forces analysis you'll receive after purchase—no placeholders or surprises. The document displayed is the full, professionally formatted file, ready for immediate download and use. Once you complete payment you'll have instant access to this identical deliverable.
Original: $10.00
-65%$10.00
$3.50Description
Go Beyond the Preview—Access the Full Strategic Report
Ipsos faces moderate buyer power and rising substitute threats as digital research tools lower entry barriers; supplier leverage is limited but talent scarcity raises costs. Competitive rivalry is intense among global firms and new entrants pose niche threats. This snapshot only scratches the surface. Unlock the full Porter's Five Forces Analysis to explore Ipsos’s competitive dynamics in detail.
Suppliers Bargaining Power
Panel and sample marketplaces
Independent panel owners and sample exchanges supply respondent access, a core input for Ipsos, and in 2024 Ipsos increased investment in proprietary panels to reduce supplier dependence. Concentration among high-quality panels gives them leverage on pricing and quotas, raising costs for buyers. Multi-sourcing and in-house panels mitigate dependence, but quality variance and fraud risks boost switching and vetting costs.
Data and API providers
Third-party data (location, purchase, demographic, social APIs) augments Ipsos surveys but is often scarce or proprietary; the data-broker market was estimated near $200bn globally in 2024, increasing supplier leverage. Strict licensing, GDPR/CPRA constraints and API rate limits raise costs and switching frictions. Ipsos reported roughly €2.3bn revenue in 2023 and offsets exposure via partnerships and first-party assets, yet unique datasets remain hard to replace quickly.
Tech stack vendors
Cloud, survey platforms, transcription and AI/ML tools are essential enablers for Ipsos; the top three cloud providers held about 64% of the cloud market in 2024, creating supplier concentration risk. Integration and strict security/compliance needs increase vendor stickiness and switching costs. Supplier price hikes or feature gating can compress margins. Strategic vendor diversification and selective internal tooling development reduce supplier leverage.
Local fieldwork and specialists
Local moderators, translators, ethnographers and CATI facilities exert notable supplier power in niche markets; 2024 industry data indicate premiums of roughly 20–35% for scarce languages or segments, which increases scheduling leverage. Long-term relationships and preferred supplier networks commonly reduce cost volatility and secure capacity. Heightened quality-control needs raise coordination time and project management costs.
- Scarcity premium: 20–35% (2024)
- Preferred suppliers cut volatility
- QC increases coordination effort
Incentive and compliance costs
- Incentives: $10–30
- Processor fees: 1.5–3.5% + $0.25–$0.50
- Compliance retainers: $50k–200k
- 2024 cost pressures: inflation + regulatory changes
Moderate-high supplier power, pricing pressure from data brokers and cloud concentration
Supplier power is moderate-high: proprietary panels reduce exposure but top panels hold pricing leverage; data-broker market ≈$200bn (2024) raises supplier rents; top-3 cloud share ≈64% (2024) creates vendor stickiness; respondent incentives $10–30 and processor fees 1.5–3.5% + $0.25–$0.50 squeeze margins.
| Item | 2024 Figure |
|---|---|
| Data-broker market | $200bn |
| Top-3 cloud share | 64% |
| Incentives | $10–30 |
| Processor fees | 1.5–3.5% + $0.25–$0.50 |
| Scarcity premium | 20–35% |
What is included in the product
Detailed Word Document
Comprehensive Porter's Five Forces analysis tailored to Ipsos, detailing competitive rivalry, buyer and supplier power, threat of new entrants and substitutes, plus disruptive and regulatory risks, with strategic commentary and editable Word format for easy integration into reports, investor materials, or internal strategy decks.
Customizable Excel Spreadsheet
A concise Ipsos Porter's Five Forces one-sheet that simplifies competitive pressure, with adjustable scores and an instant radar chart for strategic clarity—ready to drop into decks or dashboards without complex setup.
Customers Bargaining Power
Enterprise and government RFPs
Large enterprise and government RFPs run competitive tenders that emphasize price, methodology and past performance, with procurement cycles often spanning 6–24 months. Public procurement represented about 12% of GDP in OECD countries in 2024, giving large buyers scale and bargaining leverage. Volume discounts and published rate cards are commonly required and losing a multi-year frame agreement can materially dent an agency’s project pipeline.
Moderate switching costs
Standardized methodologies across the roughly US$90 billion global market research industry in 2024 make switching between providers feasible, reducing lock-in. Institutional knowledge, longitudinal trackers and established trust create frictions that raise effective switching costs. Buyers leverage this mix to extract better commercial terms, often securing discounts or service bundles. Widespread use of multi-vendor rosters (commonly 3–5 suppliers) keeps downward pressure on rates.
Speed and agility demands
Clients now demand rapid turnarounds and always-on dashboards, and Ipsos reported roughly €2.0bn in 2024 revenue, reflecting scale to meet these expectations. Tight timelines frequently shift rush costs onto vendors, raising buyer bargaining power through service-level penalties. Differentiation via faster, automated workflows and real-time delivery can rebalance power by reducing penalty exposure and improving margin.
DIY and benchmarking options
DIY platforms and internal analytics now provide credible low-cost alternatives for simpler research, pressuring Ipsos on commoditized surveys; ESOMAR estimated the global market research industry at about $85bn in 2024, amplifying buyer leverage.
Procurement routinely benchmarks rates across regions and suppliers, anchoring pricing and compressing margins on repeatable work, while complex, high-stakes projects remain less price-elastic.
- DIY alternatives up buyer leverage
- Benchmarks anchor fees
- Margins compressed on commoditized studies
- High-stakes projects retain pricing power
Global coverage requirements
Multinational buyers favor vendors who can deliver consistently across markets; Ipsos operates in over 90 markets, meeting that baseline for global coverage. Buyer consolidation into a few preferred global partners raises selection competition. After onboarding, clients push for rate harmonization. Distinct cross-border capabilities can command premiums when rare.
- Global reach: Ipsos in 90+ markets
- Consolidation: fewer global partners
- Post-onboard leverage: rate harmonization
- Premiums: for unique cross-border capabilities
Public procurement (~12% GDP) and rosters squeeze fees; scale and methods cushion
Large buyers (public procurement ~12% of OECD GDP in 2024) and multi-vendor rosters drive price/term pressure; losing frame agreements hurts pipelines. Standardized methods in the ~$85–90bn market and DIY tools raise switching options, while Ipsos scale (€2.0bn 2024) offsets some pressure on complex projects.
| Metric | 2024 |
|---|---|
| Global MR market | $85–90bn |
| Ipsos revenue | €2.0bn |
| Public procurement | ~12% GDP (OECD) |
Full Version Awaits
Ipsos Porter's Five Forces Analysis
This preview shows the exact Ipsos Porter's Five Forces analysis you'll receive after purchase—no placeholders or surprises. The document displayed is the full, professionally formatted file, ready for immediate download and use. Once you complete payment you'll have instant access to this identical deliverable.











