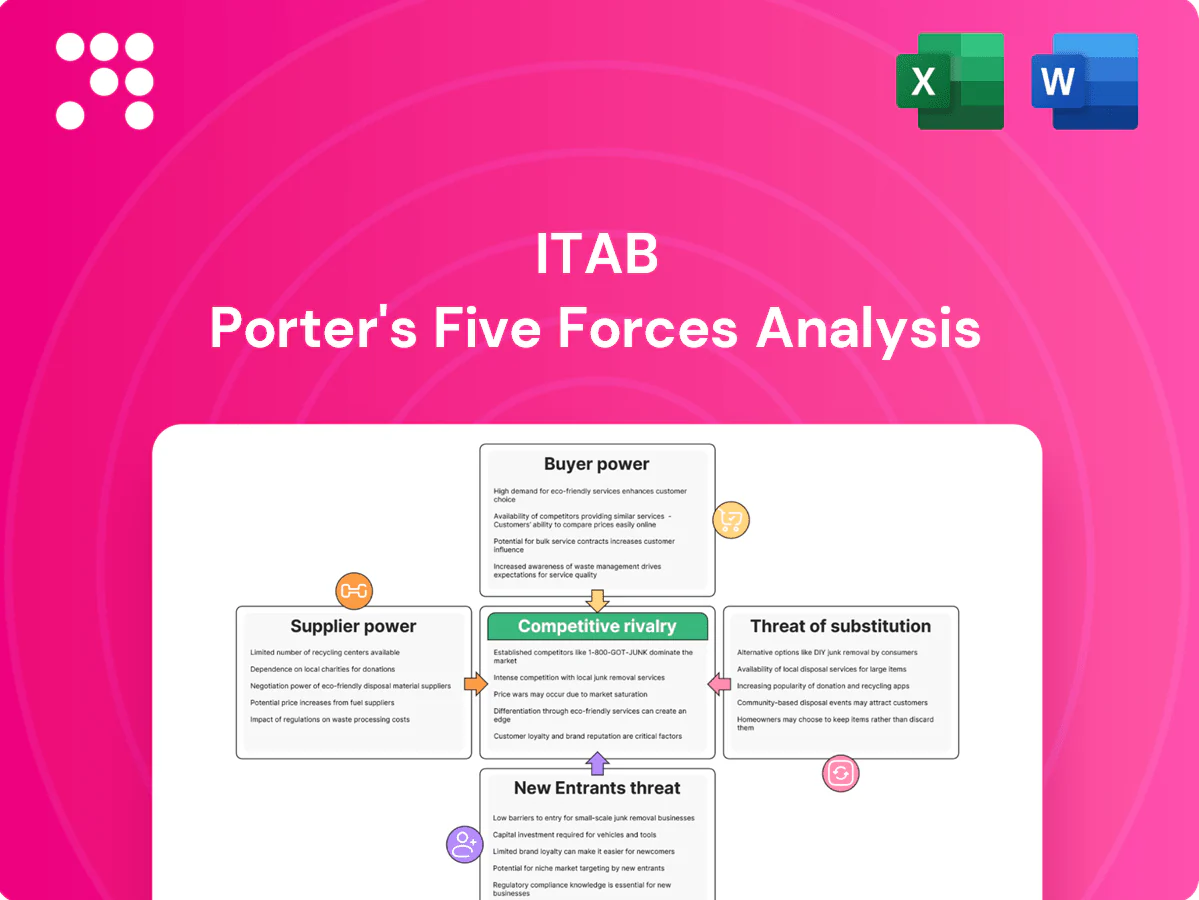
ITAB Porter's Five Forces Analysis

From Overview to Strategy Blueprint
ITAB faces moderate buyer power, niche supplier relationships, and evolving substitute threats as retail tech shifts toward integrated solutions; competitive rivalry is intense among specialized display and lighting providers. This snapshot only scratches the surface—unlock the full Porter's Five Forces Analysis to explore ITAB’s strategic levers, force-by-force ratings, visuals, and actionable recommendations.
Suppliers Bargaining Power

Specialized component inputs
ITAB depends on specialized components such as scanners, sensors, motors and LED drivers sourced from a limited supplier pool, with the top five suppliers reportedly covering about 60% of component spend in 2024, giving niche vendors pricing and lead-time leverage. Dual-sourcing and design-for-alternatives can cut single-supplier risk, while long-term framework agreements have reduced cost volatility and improved availability, lowering procurement lead-time variability by an estimated 15% in 2024.
Global logistics and lead times
Complex multi-region supply chains expose ITAB to shipping constraints and geopolitical disruptions, with industry reports in 2024 highlighting persistent bottlenecks on key Asia-Europe lanes that extend transit variability.
Extended lead times shift bargaining power to suppliers with constrained capacity, prompting buyers to face longer replenishment cycles and higher penalty risks in 2024 market conditions.
Nearshoring and buffer inventories have reduced exposure for many firms, while digital supply visibility platforms implemented in 2024 improve scheduling accuracy and supplier accountability.

Commodity metals and electronics
Steel, aluminum and electronic components drove 20-25% of ITABs bill-of-materials in 2024, and suppliers passed through surcharges of roughly 10-20% when commodity prices or chip tightness spiked; hedging and indexed contracts reduced volatility exposure by about 30% in practice, while modular designs enabled material substitution and cut material-cost sensitivity by an estimated 10-15%.

Switching costs in qualified parts
Safety, compliance, and retail uptime drive requirement for qualified parts and approvals, making re-qualification a major barrier: most retailers target 99.9% POS uptime in 2024, so re-qualification delays directly threaten operations and favor incumbents. Maintaining approved alternate vendors and standardizing interfaces cut re-certification needs and lower supplier power.
- Re-qualification creates switching friction
- 99.9% uptime targets increase incumbents' leverage
- Approved alternates and standardized interfaces reduce supplier power
Co-development dependencies
Custom shop-fitting and checkout innovations at ITAB often require co-engineering with key suppliers, creating deep integration that can lock in specifications and pricing and raise supplier bargaining power. Clear IP terms and multi-partner development mitigate lock-in by distributing design ownership. Stage-gates with competitive tendering at each phase force market-based pricing and preserve negotiation leverage.
- Co-engineering increases supplier leverage
- IP clarity reduces overreliance
- Stage-gates ensure competitive quotes
Supplier concentration ≈60% spend; nearshoring and dual‑sourcing cut lead‑time variability ≈15%
Supplier concentration (top 5 ≈60% spend) and re-qualification needs (retailer 99.9% POS uptime) give suppliers pricing and lead-time leverage; dual-sourcing, long-term frameworks and nearshoring cut lead-time variability ~15% in 2024. Commodity/electronics were 20–25% of BOM with surcharges of 10–20%; hedging/index contracts lowered cost volatility ~30%. Co‑engineering raises lock‑in; stage‑gates restore leverage.
| Metric | 2024 |
|---|---|
| Top‑5 supplier share | ≈60% |
| Lead‑time variability reduction | ≈15% |
| BOM: commodities/electronics | 20–25% |
| Surcharges on spikes | 10–20% |
| Volatility reduction (hedging) | ≈30% |
What is included in the product
 Detailed Word Document
Tailored Porter's Five Forces analysis for ITAB assessing competitive rivalry, buyer and supplier leverage, threats from new entrants and substitutes, and industry barriers—identifying disruptive risks, pricing pressures, and strategic levers to inform investor materials, strategy decks, and editable reports.

 Customizable Excel Spreadsheet
A concise one-sheet Porter's Five Forces for ITAB that visualizes competitive pressure with an editable radar chart—instantly actionable for boards and investors and easy to drop into decks or dashboards.
Customers Bargaining Power

Concentrated retail customers
Large multinationals like Walmart (FY2024 revenue $611.3B) buy in volume and negotiate aggressively, using scale and alternative vendors to intensify price pressure. Multi-year, value-based contracts tied to uptime and efficiency help ITAB defend margins. Demonstrating total cost of ownership and lifetime savings shifts buyer focus from price to value.
Project-based procurement
Project-based store rollouts and refurbishments are largely tender-driven, pushing suppliers into competitive bidding and enabling buyers to extract discounts and service extras via RFPs.
Differentiation through turnkey delivery and systems integration mitigates price compression by offering higher-margin value-adds and faster time-to-market.
Reference sites and strict performance SLAs materially improve win rates and contract stability, supporting repeat business and lower churn.

High switching, but planned cycles
Switching entire shop systems mid-cycle is costly, so retailers typically schedule full refreshes every 3–7 years and use those windows to renegotiate vendor terms. Embedding software, analytics and managed services raises stickiness and boosts recurring revenue, often representing 20–40% of supplier income in retail tech models. Lifecycle support and upgrade pathways create ongoing switching friction that favors incumbents.

Demand for customization
Retailers increasingly demand tailored layouts, branding and compliance features, forcing ITAB to offer block-level customization that can justify premiums while opening line-item bargaining on specs. Modular customization lets ITAB balance uniqueness and manufacturing cost control. Strict scope definition and disciplined change-order processes protect margins and limit downstream renegotiation.
- Tailored layouts, branding, compliance
- Customization can command premiums yet enables item-level bargaining
- Modular approach balances cost and uniqueness
- Clear scope and change-order discipline protect profitability
Performance and ROI focus
Buyers focus on throughput, shrink reduction, energy savings and CX; 2024 industry surveys show 58% of retail buyers rate throughput as the top procurement criterion. Transparent ROI cases that demonstrate payback reduce price leverage, while data-backed outcome guarantees and warranties build trust. Post-install analytics improve renewal rates and enable cross-sell by proving delivered value.
- 58%: throughput priority (2024 survey)
- ROI payback reduces price pressure
- Warranties + data build trust
- Analytics boost renewals & cross-sell
Scale buyers force discounts; value contracts, SLAs and 20-40% recurring raise lock-in
Large retailers (eg Walmart FY2024 revenue 611.3B) use scale to extract price concessions; value-based multi-year contracts, uptime SLAs and TCO arguments reduce pure price bargaining. Tender-driven rollouts and item-level customization raise negotiation points, while embedded software/managed services (20–40% recurring) and 3–7yr refresh cycles increase switching costs.
| Metric | Value |
|---|---|
| Large buyer example | Walmart 611.3B (FY2024) |
| Top procurement criterion | 58% throughput (2024) |
| Recurring revenue | 20–40% |
| Refresh cycle | 3–7 years |
What You See Is What You Get
ITAB Porter's Five Forces Analysis
This preview shows the exact ITAB Porter's Five Forces Analysis you'll receive immediately after purchase—no placeholders or mockups. The file is the final, professionally formatted document, fully usable for decision-making and reporting. Once bought, you get instant access to this identical deliverable.

From Overview to Strategy Blueprint
ITAB faces moderate buyer power, niche supplier relationships, and evolving substitute threats as retail tech shifts toward integrated solutions; competitive rivalry is intense among specialized display and lighting providers. This snapshot only scratches the surface—unlock the full Porter's Five Forces Analysis to explore ITAB’s strategic levers, force-by-force ratings, visuals, and actionable recommendations.
Suppliers Bargaining Power
Specialized component inputs
ITAB depends on specialized components such as scanners, sensors, motors and LED drivers sourced from a limited supplier pool, with the top five suppliers reportedly covering about 60% of component spend in 2024, giving niche vendors pricing and lead-time leverage. Dual-sourcing and design-for-alternatives can cut single-supplier risk, while long-term framework agreements have reduced cost volatility and improved availability, lowering procurement lead-time variability by an estimated 15% in 2024.
Global logistics and lead times
Complex multi-region supply chains expose ITAB to shipping constraints and geopolitical disruptions, with industry reports in 2024 highlighting persistent bottlenecks on key Asia-Europe lanes that extend transit variability.
Extended lead times shift bargaining power to suppliers with constrained capacity, prompting buyers to face longer replenishment cycles and higher penalty risks in 2024 market conditions.
Nearshoring and buffer inventories have reduced exposure for many firms, while digital supply visibility platforms implemented in 2024 improve scheduling accuracy and supplier accountability.
Commodity metals and electronics
Steel, aluminum and electronic components drove 20-25% of ITABs bill-of-materials in 2024, and suppliers passed through surcharges of roughly 10-20% when commodity prices or chip tightness spiked; hedging and indexed contracts reduced volatility exposure by about 30% in practice, while modular designs enabled material substitution and cut material-cost sensitivity by an estimated 10-15%.
Switching costs in qualified parts
Safety, compliance, and retail uptime drive requirement for qualified parts and approvals, making re-qualification a major barrier: most retailers target 99.9% POS uptime in 2024, so re-qualification delays directly threaten operations and favor incumbents. Maintaining approved alternate vendors and standardizing interfaces cut re-certification needs and lower supplier power.
- Re-qualification creates switching friction
- 99.9% uptime targets increase incumbents' leverage
- Approved alternates and standardized interfaces reduce supplier power
Co-development dependencies
Custom shop-fitting and checkout innovations at ITAB often require co-engineering with key suppliers, creating deep integration that can lock in specifications and pricing and raise supplier bargaining power. Clear IP terms and multi-partner development mitigate lock-in by distributing design ownership. Stage-gates with competitive tendering at each phase force market-based pricing and preserve negotiation leverage.
- Co-engineering increases supplier leverage
- IP clarity reduces overreliance
- Stage-gates ensure competitive quotes
Supplier concentration ≈60% spend; nearshoring and dual‑sourcing cut lead‑time variability ≈15%
Supplier concentration (top 5 ≈60% spend) and re-qualification needs (retailer 99.9% POS uptime) give suppliers pricing and lead-time leverage; dual-sourcing, long-term frameworks and nearshoring cut lead-time variability ~15% in 2024. Commodity/electronics were 20–25% of BOM with surcharges of 10–20%; hedging/index contracts lowered cost volatility ~30%. Co‑engineering raises lock‑in; stage‑gates restore leverage.
| Metric | 2024 |
|---|---|
| Top‑5 supplier share | ≈60% |
| Lead‑time variability reduction | ≈15% |
| BOM: commodities/electronics | 20–25% |
| Surcharges on spikes | 10–20% |
| Volatility reduction (hedging) | ≈30% |
What is included in the product
Detailed Word Document
Tailored Porter's Five Forces analysis for ITAB assessing competitive rivalry, buyer and supplier leverage, threats from new entrants and substitutes, and industry barriers—identifying disruptive risks, pricing pressures, and strategic levers to inform investor materials, strategy decks, and editable reports.
Customizable Excel Spreadsheet
A concise one-sheet Porter's Five Forces for ITAB that visualizes competitive pressure with an editable radar chart—instantly actionable for boards and investors and easy to drop into decks or dashboards.
Customers Bargaining Power
Concentrated retail customers
Large multinationals like Walmart (FY2024 revenue $611.3B) buy in volume and negotiate aggressively, using scale and alternative vendors to intensify price pressure. Multi-year, value-based contracts tied to uptime and efficiency help ITAB defend margins. Demonstrating total cost of ownership and lifetime savings shifts buyer focus from price to value.
Project-based procurement
Project-based store rollouts and refurbishments are largely tender-driven, pushing suppliers into competitive bidding and enabling buyers to extract discounts and service extras via RFPs.
Differentiation through turnkey delivery and systems integration mitigates price compression by offering higher-margin value-adds and faster time-to-market.
Reference sites and strict performance SLAs materially improve win rates and contract stability, supporting repeat business and lower churn.
High switching, but planned cycles
Switching entire shop systems mid-cycle is costly, so retailers typically schedule full refreshes every 3–7 years and use those windows to renegotiate vendor terms. Embedding software, analytics and managed services raises stickiness and boosts recurring revenue, often representing 20–40% of supplier income in retail tech models. Lifecycle support and upgrade pathways create ongoing switching friction that favors incumbents.
Demand for customization
Retailers increasingly demand tailored layouts, branding and compliance features, forcing ITAB to offer block-level customization that can justify premiums while opening line-item bargaining on specs. Modular customization lets ITAB balance uniqueness and manufacturing cost control. Strict scope definition and disciplined change-order processes protect margins and limit downstream renegotiation.
- Tailored layouts, branding, compliance
- Customization can command premiums yet enables item-level bargaining
- Modular approach balances cost and uniqueness
- Clear scope and change-order discipline protect profitability
Performance and ROI focus
Buyers focus on throughput, shrink reduction, energy savings and CX; 2024 industry surveys show 58% of retail buyers rate throughput as the top procurement criterion. Transparent ROI cases that demonstrate payback reduce price leverage, while data-backed outcome guarantees and warranties build trust. Post-install analytics improve renewal rates and enable cross-sell by proving delivered value.
- 58%: throughput priority (2024 survey)
- ROI payback reduces price pressure
- Warranties + data build trust
- Analytics boost renewals & cross-sell
Scale buyers force discounts; value contracts, SLAs and 20-40% recurring raise lock-in
Large retailers (eg Walmart FY2024 revenue 611.3B) use scale to extract price concessions; value-based multi-year contracts, uptime SLAs and TCO arguments reduce pure price bargaining. Tender-driven rollouts and item-level customization raise negotiation points, while embedded software/managed services (20–40% recurring) and 3–7yr refresh cycles increase switching costs.
| Metric | Value |
|---|---|
| Large buyer example | Walmart 611.3B (FY2024) |
| Top procurement criterion | 58% throughput (2024) |
| Recurring revenue | 20–40% |
| Refresh cycle | 3–7 years |
What You See Is What You Get
ITAB Porter's Five Forces Analysis
This preview shows the exact ITAB Porter's Five Forces Analysis you'll receive immediately after purchase—no placeholders or mockups. The file is the final, professionally formatted document, fully usable for decision-making and reporting. Once bought, you get instant access to this identical deliverable.
Original: $10.00
-65%$10.00
$3.50Description
From Overview to Strategy Blueprint
ITAB faces moderate buyer power, niche supplier relationships, and evolving substitute threats as retail tech shifts toward integrated solutions; competitive rivalry is intense among specialized display and lighting providers. This snapshot only scratches the surface—unlock the full Porter's Five Forces Analysis to explore ITAB’s strategic levers, force-by-force ratings, visuals, and actionable recommendations.
Suppliers Bargaining Power
Specialized component inputs
ITAB depends on specialized components such as scanners, sensors, motors and LED drivers sourced from a limited supplier pool, with the top five suppliers reportedly covering about 60% of component spend in 2024, giving niche vendors pricing and lead-time leverage. Dual-sourcing and design-for-alternatives can cut single-supplier risk, while long-term framework agreements have reduced cost volatility and improved availability, lowering procurement lead-time variability by an estimated 15% in 2024.
Global logistics and lead times
Complex multi-region supply chains expose ITAB to shipping constraints and geopolitical disruptions, with industry reports in 2024 highlighting persistent bottlenecks on key Asia-Europe lanes that extend transit variability.
Extended lead times shift bargaining power to suppliers with constrained capacity, prompting buyers to face longer replenishment cycles and higher penalty risks in 2024 market conditions.
Nearshoring and buffer inventories have reduced exposure for many firms, while digital supply visibility platforms implemented in 2024 improve scheduling accuracy and supplier accountability.
Commodity metals and electronics
Steel, aluminum and electronic components drove 20-25% of ITABs bill-of-materials in 2024, and suppliers passed through surcharges of roughly 10-20% when commodity prices or chip tightness spiked; hedging and indexed contracts reduced volatility exposure by about 30% in practice, while modular designs enabled material substitution and cut material-cost sensitivity by an estimated 10-15%.
Switching costs in qualified parts
Safety, compliance, and retail uptime drive requirement for qualified parts and approvals, making re-qualification a major barrier: most retailers target 99.9% POS uptime in 2024, so re-qualification delays directly threaten operations and favor incumbents. Maintaining approved alternate vendors and standardizing interfaces cut re-certification needs and lower supplier power.
- Re-qualification creates switching friction
- 99.9% uptime targets increase incumbents' leverage
- Approved alternates and standardized interfaces reduce supplier power
Co-development dependencies
Custom shop-fitting and checkout innovations at ITAB often require co-engineering with key suppliers, creating deep integration that can lock in specifications and pricing and raise supplier bargaining power. Clear IP terms and multi-partner development mitigate lock-in by distributing design ownership. Stage-gates with competitive tendering at each phase force market-based pricing and preserve negotiation leverage.
- Co-engineering increases supplier leverage
- IP clarity reduces overreliance
- Stage-gates ensure competitive quotes
Supplier concentration ≈60% spend; nearshoring and dual‑sourcing cut lead‑time variability ≈15%
Supplier concentration (top 5 ≈60% spend) and re-qualification needs (retailer 99.9% POS uptime) give suppliers pricing and lead-time leverage; dual-sourcing, long-term frameworks and nearshoring cut lead-time variability ~15% in 2024. Commodity/electronics were 20–25% of BOM with surcharges of 10–20%; hedging/index contracts lowered cost volatility ~30%. Co‑engineering raises lock‑in; stage‑gates restore leverage.
| Metric | 2024 |
|---|---|
| Top‑5 supplier share | ≈60% |
| Lead‑time variability reduction | ≈15% |
| BOM: commodities/electronics | 20–25% |
| Surcharges on spikes | 10–20% |
| Volatility reduction (hedging) | ≈30% |
What is included in the product
Detailed Word Document
Tailored Porter's Five Forces analysis for ITAB assessing competitive rivalry, buyer and supplier leverage, threats from new entrants and substitutes, and industry barriers—identifying disruptive risks, pricing pressures, and strategic levers to inform investor materials, strategy decks, and editable reports.
Customizable Excel Spreadsheet
A concise one-sheet Porter's Five Forces for ITAB that visualizes competitive pressure with an editable radar chart—instantly actionable for boards and investors and easy to drop into decks or dashboards.
Customers Bargaining Power
Concentrated retail customers
Large multinationals like Walmart (FY2024 revenue $611.3B) buy in volume and negotiate aggressively, using scale and alternative vendors to intensify price pressure. Multi-year, value-based contracts tied to uptime and efficiency help ITAB defend margins. Demonstrating total cost of ownership and lifetime savings shifts buyer focus from price to value.
Project-based procurement
Project-based store rollouts and refurbishments are largely tender-driven, pushing suppliers into competitive bidding and enabling buyers to extract discounts and service extras via RFPs.
Differentiation through turnkey delivery and systems integration mitigates price compression by offering higher-margin value-adds and faster time-to-market.
Reference sites and strict performance SLAs materially improve win rates and contract stability, supporting repeat business and lower churn.
High switching, but planned cycles
Switching entire shop systems mid-cycle is costly, so retailers typically schedule full refreshes every 3–7 years and use those windows to renegotiate vendor terms. Embedding software, analytics and managed services raises stickiness and boosts recurring revenue, often representing 20–40% of supplier income in retail tech models. Lifecycle support and upgrade pathways create ongoing switching friction that favors incumbents.
Demand for customization
Retailers increasingly demand tailored layouts, branding and compliance features, forcing ITAB to offer block-level customization that can justify premiums while opening line-item bargaining on specs. Modular customization lets ITAB balance uniqueness and manufacturing cost control. Strict scope definition and disciplined change-order processes protect margins and limit downstream renegotiation.
- Tailored layouts, branding, compliance
- Customization can command premiums yet enables item-level bargaining
- Modular approach balances cost and uniqueness
- Clear scope and change-order discipline protect profitability
Performance and ROI focus
Buyers focus on throughput, shrink reduction, energy savings and CX; 2024 industry surveys show 58% of retail buyers rate throughput as the top procurement criterion. Transparent ROI cases that demonstrate payback reduce price leverage, while data-backed outcome guarantees and warranties build trust. Post-install analytics improve renewal rates and enable cross-sell by proving delivered value.
- 58%: throughput priority (2024 survey)
- ROI payback reduces price pressure
- Warranties + data build trust
- Analytics boost renewals & cross-sell
Scale buyers force discounts; value contracts, SLAs and 20-40% recurring raise lock-in
Large retailers (eg Walmart FY2024 revenue 611.3B) use scale to extract price concessions; value-based multi-year contracts, uptime SLAs and TCO arguments reduce pure price bargaining. Tender-driven rollouts and item-level customization raise negotiation points, while embedded software/managed services (20–40% recurring) and 3–7yr refresh cycles increase switching costs.
| Metric | Value |
|---|---|
| Large buyer example | Walmart 611.3B (FY2024) |
| Top procurement criterion | 58% throughput (2024) |
| Recurring revenue | 20–40% |
| Refresh cycle | 3–7 years |
What You See Is What You Get
ITAB Porter's Five Forces Analysis
This preview shows the exact ITAB Porter's Five Forces Analysis you'll receive immediately after purchase—no placeholders or mockups. The file is the final, professionally formatted document, fully usable for decision-making and reporting. Once bought, you get instant access to this identical deliverable.











