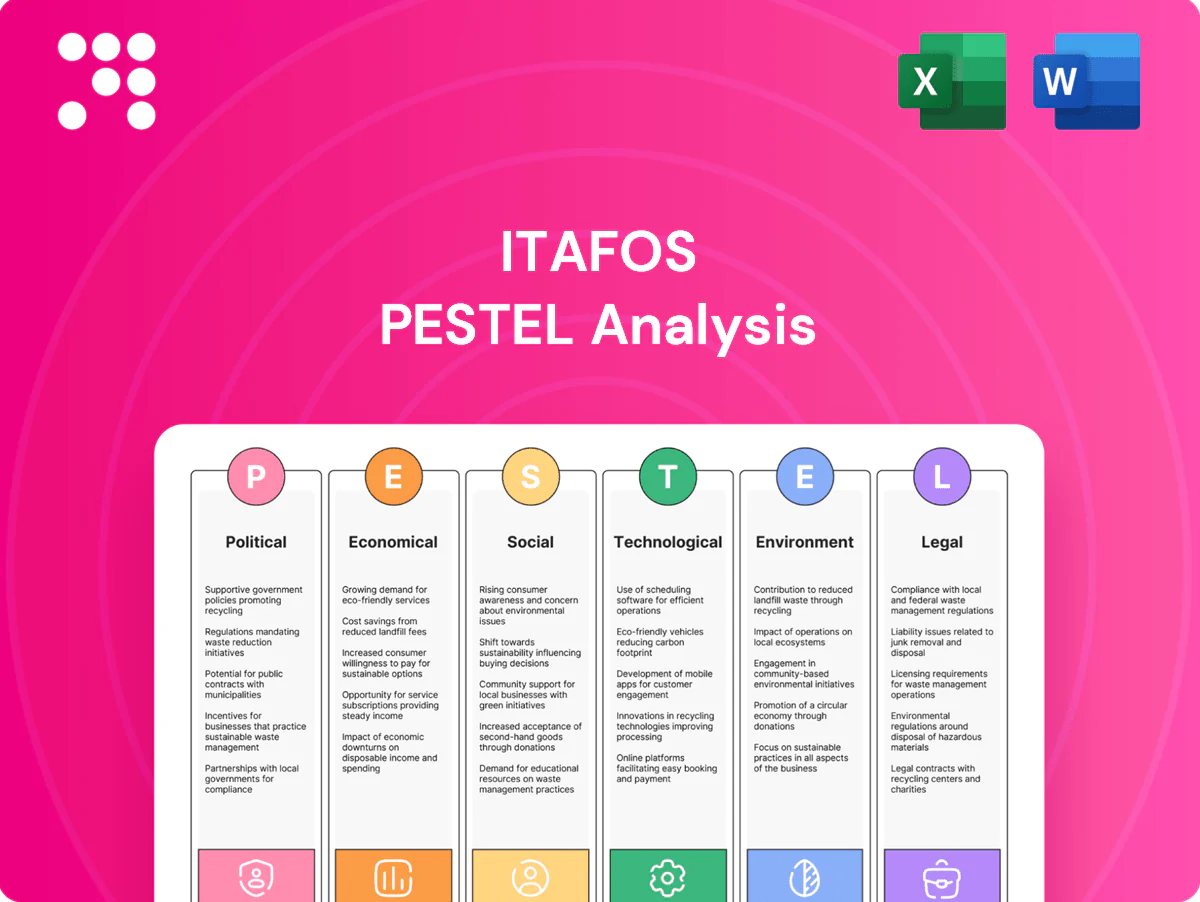
Itafos PESTLE Analysis

Plan Smarter. Present Sharper. Compete Stronger.
Discover how political, economic, social, technological, legal and environmental forces are shaping Itafos's strategic trajectory in our concise PESTLE snapshot—insights tailored for investors and strategists. Dive deeper with the full, actionable PESTLE analysis to identify risks, spot growth levers, and strengthen your decisions; purchase the complete report for instant download.
Political factors

Ag subsidies and farm policy
US and Brazil farm programs materially shape fertilizer demand and Itafos pricing power: US corn and soy together account for roughly 60% of planted acreage, driving high P application rates, while Brazil’s expanding planted area and biofuel policies have lifted phosphate demand by double digits since 2015. Policy shifts toward resilience or biofuels (eg. RenovaBio expansion) can boost P volumes, whereas cuts or austerity reduce offtake and margin visibility.
Trade tariffs and import controls
Tariffs, countervailing duties and quotas on phosphate products compress margins and shift competitiveness across regions; export controls can reroute supply and spike logistics costs. Brazil imports roughly 75–80% of its phosphate needs, so changes in US, Brazil or neighboring trade regimes materially affect flows and pricing. Russia maintained export duties on some mineral fertilizers through 2024, tightening export availability. Trade disputes raise price volatility and planning risk for Itafos.

Mining permits and local approvals
Phosphate mining for Itafos faces complex concession, permitting and community consultation processes—environmental licensing in Brazil commonly takes 2–7 years and can require staged approvals. Delays or revocations can disrupt feedstock availability and extend project timelines, increasing costs and deferring revenue. Political pressure has driven higher local content or royalty terms in several jurisdictions (often rising by 1–5 percentage points), so stable relations with regional authorities are a key risk mitigant.

Geopolitical inputs exposure
Critical inputs such as ammonia, sulfur and energy are vulnerable to geopolitical tensions and sanctions; Russia and Belarus accounted for about 19% of global fertilizer exports around 2020–22, amplifying supply shocks and price volatility.
Supply rerouting or scarcity elevates costs and lead times, with ammonia-intensive production highly sensitive to natural gas price swings that can drive input costs materially; policy changes in transit countries (e.g., export bans) further disrupt logistics. Diversification of suppliers, routes and storage reduces political supply risk.
- Exposure: Russia/Belarus ~19% of exports
- Impact: sanctions → higher lead times and input costs
- Logistics: transit policy changes increase disruption risk
- Mitigation: supplier/route/storage diversification
Public procurement and food security agendas
Governments prioritize fertilizer access to safeguard yields and food supplies; FAO Food Price Index averaged about 120 in 2024, keeping focus on input security. Public tenders and credit lines (e.g., large procurement windows in 2023–24) create time-bound demand spikes. Policy emphasis on domestic production favors local players, while sustainability shifts nudge buyers toward specialty blends.
- procurement-driven spikes
- domestic-production bias
- sustainability → specialty blends
Supply risk: US corn+soy 60%, Brazil P imports 75–80%
US corn and soy account for roughly 60% of planted acreage, and Brazil’s expanding area plus RenovaBio-driven biofuel demand have pushed phosphate volumes higher; policy shifts either boost or cut P offtake. Tariffs, export duties and sanctions (Russia/Belarus ~19% of fertilizer exports in 2020–22; duties persisted into 2024) raise volatility and costs. Permitting in Brazil commonly takes 2–7 years, Brazil imports ~75–80% of phosphate, and FAO Food Price Index averaged ~120 in 2024, keeping procurement and domestic-production bias high; supplier/route diversification mitigates risk.
| Metric | Value | Relevance |
|---|---|---|
| US corn+soy planted share | ~60% | Drives P demand |
| Brazil P imports | 75–80% | Exposure to trade shifts |
| Russia/Belarus export share | ~19% (2020–22) | Sanction risk |
| FAO Food Price Index (2024) | ~120 | Procurement focus |
What is included in the product
 Detailed Word Document
Explores how macro-environmental factors uniquely affect Itafos across Political, Economic, Social, Technological, Environmental and Legal dimensions, each backed by data and regional market/regulatory context to identify risks, opportunities and forward‑looking scenarios for executives, investors and strategists.

 Customizable Excel Spreadsheet
A concise, visually segmented Itafos PESTLE summary that distills regulatory, environmental, market and geopolitical risks into an easily shareable slide or meeting handout, enabling fast alignment across teams and streamlined decision-making during strategic planning.
Economic factors

Commodity and input price cycles
Itafos margins are driven by phosphate rock (roughly $120–140/mt in 2024), sulfur ($70–100/mt), ammonia ($450–600/mt) and phosphoric acid ($800–1,100/mt) cycles; spikes lift spreads but input surges compress margins. Hedging and contract mix materially stabilize earnings, while vertical integration into acid and ammonia production cushions raw-material volatility and supports EBITDA resilience.
Farm income and crop price outlook
Farmer profitability drives fertilizer application rates and product mix; US corn futures averaged about $4.50/bu and soybeans near $11.00/bu in 2024, supporting demand for premium and specialty fertilizers. When prices fall, farmers trade down to lower-cost formulations or defer applications, as seen in 2023–24 margin compression. Credit availability—farm lending rates and liquidity—continues to shape timing of purchases.

FX exposure (USD/BRL and others)
Revenue and costs split across North and South America create currency mismatches for Itafos, with payables often local BRL/PEN and many sales priced in USD; USD/BRL traded near 5.0 in mid‑2025, amplifying translation exposure. A stronger USD can erode export competitiveness and reduce local affordability in Brazil and Peru. Hedging (forwards/options) smooths P&L volatility but incurs explicit premia and opportunity costs. Pricing clauses indexed to USD and increased local sourcing are used to mitigate FX risk.

Logistics and freight costs
Ocean freight and trucking materially drive landed fertilizer costs: Brazil moves roughly 60% of freight by road, while port throughput concentration (Santos ~120 million tonnes/year) and periodic port congestion raise transshipment lead times and spot premiums. Seasonal planting windows (soybean/corn planting Sep–Jan) compress capacity, often pushing spot freight premiums higher and straining trucking fleets. Contracted capacity and multi-port optionality (e.g., Santos, Paranaguá, Rio Grande) materially improve delivery resilience and lower variability in landed costs.
- Road share: ~60% of Brazil freight
- Port throughput: Santos ~120M t/yr
- Planting window: Sep–Jan (soy/corn)
- Mitigation: contracted capacity + multi-port optionality
Interest rates and capex intensity
Itafos' fertilizer assets are capex intensive, requiring sizable sustaining and growth investments; higher interest rates raise financing costs and project hurdle rates — the US federal funds rate stood at 5.25–5.50% in mid‑2025. Tight credit (per the Fed SLOOS, banks reported net tightening in 2024) can slow expansions and debottlenecking, while strong operating cash conversion can enable self‑funded capex.
- Capex intensity: high for fertilizer assets
- Rates: Fed 5.25–5.50% (mid‑2025) increases financing costs
- Credit: 2024 SLOOS shows net tightening, slowing projects
- Cash conversion: enables internal funding of capex
Supply risk: US corn+soy 60%, Brazil P imports 75–80%
Itafos margins hinge on input cycles: phosphate $120–140/mt, sulfur $70–100/mt, ammonia $450–600/mt, phosphoric acid $800–1,100/mt (2024–25); hedging and vertical integration reduce volatility. Farm demand supported by 2024 prices (US corn ~$4.50/bu, soy ~$11.00/bu) and credit conditions; Fed funds 5.25–5.50% (mid‑2025) raises capex costs. FX and logistics matter: USD/BRL ~5.0, road freight ~60% Brazil, Santos ~120M t/yr; seasonal Sep–Jan planting drives spot premiums.
| Metric | Value |
|---|---|
| Phosphate | $120–140/mt |
| Ammonia | $450–600/mt |
| Corn / Soy (2024) | $4.50 / $11.00 /bu |
| USD/BRL | ~5.0 (mid‑2025) |
| Fed funds | 5.25–5.50% (mid‑2025) |
| Brazil road freight | ~60% |
What You See Is What You Get
Itafos PESTLE Analysis
The Itafos PESTLE Analysis delivers a concise, sector-focused assessment of political, economic, social, technological, legal, and environmental factors affecting Itafos and phosphate markets. The preview shown here is the exact document you’ll receive after purchase—fully formatted and ready to use. It includes data-driven insights, risk implications, and strategic considerations to support investment or corporate decisions.

Plan Smarter. Present Sharper. Compete Stronger.
Discover how political, economic, social, technological, legal and environmental forces are shaping Itafos's strategic trajectory in our concise PESTLE snapshot—insights tailored for investors and strategists. Dive deeper with the full, actionable PESTLE analysis to identify risks, spot growth levers, and strengthen your decisions; purchase the complete report for instant download.
Political factors
Ag subsidies and farm policy
US and Brazil farm programs materially shape fertilizer demand and Itafos pricing power: US corn and soy together account for roughly 60% of planted acreage, driving high P application rates, while Brazil’s expanding planted area and biofuel policies have lifted phosphate demand by double digits since 2015. Policy shifts toward resilience or biofuels (eg. RenovaBio expansion) can boost P volumes, whereas cuts or austerity reduce offtake and margin visibility.
Trade tariffs and import controls
Tariffs, countervailing duties and quotas on phosphate products compress margins and shift competitiveness across regions; export controls can reroute supply and spike logistics costs. Brazil imports roughly 75–80% of its phosphate needs, so changes in US, Brazil or neighboring trade regimes materially affect flows and pricing. Russia maintained export duties on some mineral fertilizers through 2024, tightening export availability. Trade disputes raise price volatility and planning risk for Itafos.
Mining permits and local approvals
Phosphate mining for Itafos faces complex concession, permitting and community consultation processes—environmental licensing in Brazil commonly takes 2–7 years and can require staged approvals. Delays or revocations can disrupt feedstock availability and extend project timelines, increasing costs and deferring revenue. Political pressure has driven higher local content or royalty terms in several jurisdictions (often rising by 1–5 percentage points), so stable relations with regional authorities are a key risk mitigant.
Geopolitical inputs exposure
Critical inputs such as ammonia, sulfur and energy are vulnerable to geopolitical tensions and sanctions; Russia and Belarus accounted for about 19% of global fertilizer exports around 2020–22, amplifying supply shocks and price volatility.
Supply rerouting or scarcity elevates costs and lead times, with ammonia-intensive production highly sensitive to natural gas price swings that can drive input costs materially; policy changes in transit countries (e.g., export bans) further disrupt logistics. Diversification of suppliers, routes and storage reduces political supply risk.
- Exposure: Russia/Belarus ~19% of exports
- Impact: sanctions → higher lead times and input costs
- Logistics: transit policy changes increase disruption risk
- Mitigation: supplier/route/storage diversification
Public procurement and food security agendas
Governments prioritize fertilizer access to safeguard yields and food supplies; FAO Food Price Index averaged about 120 in 2024, keeping focus on input security. Public tenders and credit lines (e.g., large procurement windows in 2023–24) create time-bound demand spikes. Policy emphasis on domestic production favors local players, while sustainability shifts nudge buyers toward specialty blends.
- procurement-driven spikes
- domestic-production bias
- sustainability → specialty blends
Supply risk: US corn+soy 60%, Brazil P imports 75–80%
US corn and soy account for roughly 60% of planted acreage, and Brazil’s expanding area plus RenovaBio-driven biofuel demand have pushed phosphate volumes higher; policy shifts either boost or cut P offtake. Tariffs, export duties and sanctions (Russia/Belarus ~19% of fertilizer exports in 2020–22; duties persisted into 2024) raise volatility and costs. Permitting in Brazil commonly takes 2–7 years, Brazil imports ~75–80% of phosphate, and FAO Food Price Index averaged ~120 in 2024, keeping procurement and domestic-production bias high; supplier/route diversification mitigates risk.
| Metric | Value | Relevance |
|---|---|---|
| US corn+soy planted share | ~60% | Drives P demand |
| Brazil P imports | 75–80% | Exposure to trade shifts |
| Russia/Belarus export share | ~19% (2020–22) | Sanction risk |
| FAO Food Price Index (2024) | ~120 | Procurement focus |
What is included in the product
Detailed Word Document
Explores how macro-environmental factors uniquely affect Itafos across Political, Economic, Social, Technological, Environmental and Legal dimensions, each backed by data and regional market/regulatory context to identify risks, opportunities and forward‑looking scenarios for executives, investors and strategists.
Customizable Excel Spreadsheet
A concise, visually segmented Itafos PESTLE summary that distills regulatory, environmental, market and geopolitical risks into an easily shareable slide or meeting handout, enabling fast alignment across teams and streamlined decision-making during strategic planning.
Economic factors
Commodity and input price cycles
Itafos margins are driven by phosphate rock (roughly $120–140/mt in 2024), sulfur ($70–100/mt), ammonia ($450–600/mt) and phosphoric acid ($800–1,100/mt) cycles; spikes lift spreads but input surges compress margins. Hedging and contract mix materially stabilize earnings, while vertical integration into acid and ammonia production cushions raw-material volatility and supports EBITDA resilience.
Farm income and crop price outlook
Farmer profitability drives fertilizer application rates and product mix; US corn futures averaged about $4.50/bu and soybeans near $11.00/bu in 2024, supporting demand for premium and specialty fertilizers. When prices fall, farmers trade down to lower-cost formulations or defer applications, as seen in 2023–24 margin compression. Credit availability—farm lending rates and liquidity—continues to shape timing of purchases.
FX exposure (USD/BRL and others)
Revenue and costs split across North and South America create currency mismatches for Itafos, with payables often local BRL/PEN and many sales priced in USD; USD/BRL traded near 5.0 in mid‑2025, amplifying translation exposure. A stronger USD can erode export competitiveness and reduce local affordability in Brazil and Peru. Hedging (forwards/options) smooths P&L volatility but incurs explicit premia and opportunity costs. Pricing clauses indexed to USD and increased local sourcing are used to mitigate FX risk.
Logistics and freight costs
Ocean freight and trucking materially drive landed fertilizer costs: Brazil moves roughly 60% of freight by road, while port throughput concentration (Santos ~120 million tonnes/year) and periodic port congestion raise transshipment lead times and spot premiums. Seasonal planting windows (soybean/corn planting Sep–Jan) compress capacity, often pushing spot freight premiums higher and straining trucking fleets. Contracted capacity and multi-port optionality (e.g., Santos, Paranaguá, Rio Grande) materially improve delivery resilience and lower variability in landed costs.
- Road share: ~60% of Brazil freight
- Port throughput: Santos ~120M t/yr
- Planting window: Sep–Jan (soy/corn)
- Mitigation: contracted capacity + multi-port optionality
Interest rates and capex intensity
Itafos' fertilizer assets are capex intensive, requiring sizable sustaining and growth investments; higher interest rates raise financing costs and project hurdle rates — the US federal funds rate stood at 5.25–5.50% in mid‑2025. Tight credit (per the Fed SLOOS, banks reported net tightening in 2024) can slow expansions and debottlenecking, while strong operating cash conversion can enable self‑funded capex.
- Capex intensity: high for fertilizer assets
- Rates: Fed 5.25–5.50% (mid‑2025) increases financing costs
- Credit: 2024 SLOOS shows net tightening, slowing projects
- Cash conversion: enables internal funding of capex
Supply risk: US corn+soy 60%, Brazil P imports 75–80%
Itafos margins hinge on input cycles: phosphate $120–140/mt, sulfur $70–100/mt, ammonia $450–600/mt, phosphoric acid $800–1,100/mt (2024–25); hedging and vertical integration reduce volatility. Farm demand supported by 2024 prices (US corn ~$4.50/bu, soy ~$11.00/bu) and credit conditions; Fed funds 5.25–5.50% (mid‑2025) raises capex costs. FX and logistics matter: USD/BRL ~5.0, road freight ~60% Brazil, Santos ~120M t/yr; seasonal Sep–Jan planting drives spot premiums.
| Metric | Value |
|---|---|
| Phosphate | $120–140/mt |
| Ammonia | $450–600/mt |
| Corn / Soy (2024) | $4.50 / $11.00 /bu |
| USD/BRL | ~5.0 (mid‑2025) |
| Fed funds | 5.25–5.50% (mid‑2025) |
| Brazil road freight | ~60% |
What You See Is What You Get
Itafos PESTLE Analysis
The Itafos PESTLE Analysis delivers a concise, sector-focused assessment of political, economic, social, technological, legal, and environmental factors affecting Itafos and phosphate markets. The preview shown here is the exact document you’ll receive after purchase—fully formatted and ready to use. It includes data-driven insights, risk implications, and strategic considerations to support investment or corporate decisions.
Original: $10.00
-65%$10.00
$3.50Description
Plan Smarter. Present Sharper. Compete Stronger.
Discover how political, economic, social, technological, legal and environmental forces are shaping Itafos's strategic trajectory in our concise PESTLE snapshot—insights tailored for investors and strategists. Dive deeper with the full, actionable PESTLE analysis to identify risks, spot growth levers, and strengthen your decisions; purchase the complete report for instant download.
Political factors
Ag subsidies and farm policy
US and Brazil farm programs materially shape fertilizer demand and Itafos pricing power: US corn and soy together account for roughly 60% of planted acreage, driving high P application rates, while Brazil’s expanding planted area and biofuel policies have lifted phosphate demand by double digits since 2015. Policy shifts toward resilience or biofuels (eg. RenovaBio expansion) can boost P volumes, whereas cuts or austerity reduce offtake and margin visibility.
Trade tariffs and import controls
Tariffs, countervailing duties and quotas on phosphate products compress margins and shift competitiveness across regions; export controls can reroute supply and spike logistics costs. Brazil imports roughly 75–80% of its phosphate needs, so changes in US, Brazil or neighboring trade regimes materially affect flows and pricing. Russia maintained export duties on some mineral fertilizers through 2024, tightening export availability. Trade disputes raise price volatility and planning risk for Itafos.
Mining permits and local approvals
Phosphate mining for Itafos faces complex concession, permitting and community consultation processes—environmental licensing in Brazil commonly takes 2–7 years and can require staged approvals. Delays or revocations can disrupt feedstock availability and extend project timelines, increasing costs and deferring revenue. Political pressure has driven higher local content or royalty terms in several jurisdictions (often rising by 1–5 percentage points), so stable relations with regional authorities are a key risk mitigant.
Geopolitical inputs exposure
Critical inputs such as ammonia, sulfur and energy are vulnerable to geopolitical tensions and sanctions; Russia and Belarus accounted for about 19% of global fertilizer exports around 2020–22, amplifying supply shocks and price volatility.
Supply rerouting or scarcity elevates costs and lead times, with ammonia-intensive production highly sensitive to natural gas price swings that can drive input costs materially; policy changes in transit countries (e.g., export bans) further disrupt logistics. Diversification of suppliers, routes and storage reduces political supply risk.
- Exposure: Russia/Belarus ~19% of exports
- Impact: sanctions → higher lead times and input costs
- Logistics: transit policy changes increase disruption risk
- Mitigation: supplier/route/storage diversification
Public procurement and food security agendas
Governments prioritize fertilizer access to safeguard yields and food supplies; FAO Food Price Index averaged about 120 in 2024, keeping focus on input security. Public tenders and credit lines (e.g., large procurement windows in 2023–24) create time-bound demand spikes. Policy emphasis on domestic production favors local players, while sustainability shifts nudge buyers toward specialty blends.
- procurement-driven spikes
- domestic-production bias
- sustainability → specialty blends
Supply risk: US corn+soy 60%, Brazil P imports 75–80%
US corn and soy account for roughly 60% of planted acreage, and Brazil’s expanding area plus RenovaBio-driven biofuel demand have pushed phosphate volumes higher; policy shifts either boost or cut P offtake. Tariffs, export duties and sanctions (Russia/Belarus ~19% of fertilizer exports in 2020–22; duties persisted into 2024) raise volatility and costs. Permitting in Brazil commonly takes 2–7 years, Brazil imports ~75–80% of phosphate, and FAO Food Price Index averaged ~120 in 2024, keeping procurement and domestic-production bias high; supplier/route diversification mitigates risk.
| Metric | Value | Relevance |
|---|---|---|
| US corn+soy planted share | ~60% | Drives P demand |
| Brazil P imports | 75–80% | Exposure to trade shifts |
| Russia/Belarus export share | ~19% (2020–22) | Sanction risk |
| FAO Food Price Index (2024) | ~120 | Procurement focus |
What is included in the product
Detailed Word Document
Explores how macro-environmental factors uniquely affect Itafos across Political, Economic, Social, Technological, Environmental and Legal dimensions, each backed by data and regional market/regulatory context to identify risks, opportunities and forward‑looking scenarios for executives, investors and strategists.
Customizable Excel Spreadsheet
A concise, visually segmented Itafos PESTLE summary that distills regulatory, environmental, market and geopolitical risks into an easily shareable slide or meeting handout, enabling fast alignment across teams and streamlined decision-making during strategic planning.
Economic factors
Commodity and input price cycles
Itafos margins are driven by phosphate rock (roughly $120–140/mt in 2024), sulfur ($70–100/mt), ammonia ($450–600/mt) and phosphoric acid ($800–1,100/mt) cycles; spikes lift spreads but input surges compress margins. Hedging and contract mix materially stabilize earnings, while vertical integration into acid and ammonia production cushions raw-material volatility and supports EBITDA resilience.
Farm income and crop price outlook
Farmer profitability drives fertilizer application rates and product mix; US corn futures averaged about $4.50/bu and soybeans near $11.00/bu in 2024, supporting demand for premium and specialty fertilizers. When prices fall, farmers trade down to lower-cost formulations or defer applications, as seen in 2023–24 margin compression. Credit availability—farm lending rates and liquidity—continues to shape timing of purchases.
FX exposure (USD/BRL and others)
Revenue and costs split across North and South America create currency mismatches for Itafos, with payables often local BRL/PEN and many sales priced in USD; USD/BRL traded near 5.0 in mid‑2025, amplifying translation exposure. A stronger USD can erode export competitiveness and reduce local affordability in Brazil and Peru. Hedging (forwards/options) smooths P&L volatility but incurs explicit premia and opportunity costs. Pricing clauses indexed to USD and increased local sourcing are used to mitigate FX risk.
Logistics and freight costs
Ocean freight and trucking materially drive landed fertilizer costs: Brazil moves roughly 60% of freight by road, while port throughput concentration (Santos ~120 million tonnes/year) and periodic port congestion raise transshipment lead times and spot premiums. Seasonal planting windows (soybean/corn planting Sep–Jan) compress capacity, often pushing spot freight premiums higher and straining trucking fleets. Contracted capacity and multi-port optionality (e.g., Santos, Paranaguá, Rio Grande) materially improve delivery resilience and lower variability in landed costs.
- Road share: ~60% of Brazil freight
- Port throughput: Santos ~120M t/yr
- Planting window: Sep–Jan (soy/corn)
- Mitigation: contracted capacity + multi-port optionality
Interest rates and capex intensity
Itafos' fertilizer assets are capex intensive, requiring sizable sustaining and growth investments; higher interest rates raise financing costs and project hurdle rates — the US federal funds rate stood at 5.25–5.50% in mid‑2025. Tight credit (per the Fed SLOOS, banks reported net tightening in 2024) can slow expansions and debottlenecking, while strong operating cash conversion can enable self‑funded capex.
- Capex intensity: high for fertilizer assets
- Rates: Fed 5.25–5.50% (mid‑2025) increases financing costs
- Credit: 2024 SLOOS shows net tightening, slowing projects
- Cash conversion: enables internal funding of capex
Supply risk: US corn+soy 60%, Brazil P imports 75–80%
Itafos margins hinge on input cycles: phosphate $120–140/mt, sulfur $70–100/mt, ammonia $450–600/mt, phosphoric acid $800–1,100/mt (2024–25); hedging and vertical integration reduce volatility. Farm demand supported by 2024 prices (US corn ~$4.50/bu, soy ~$11.00/bu) and credit conditions; Fed funds 5.25–5.50% (mid‑2025) raises capex costs. FX and logistics matter: USD/BRL ~5.0, road freight ~60% Brazil, Santos ~120M t/yr; seasonal Sep–Jan planting drives spot premiums.
| Metric | Value |
|---|---|
| Phosphate | $120–140/mt |
| Ammonia | $450–600/mt |
| Corn / Soy (2024) | $4.50 / $11.00 /bu |
| USD/BRL | ~5.0 (mid‑2025) |
| Fed funds | 5.25–5.50% (mid‑2025) |
| Brazil road freight | ~60% |
What You See Is What You Get
Itafos PESTLE Analysis
The Itafos PESTLE Analysis delivers a concise, sector-focused assessment of political, economic, social, technological, legal, and environmental factors affecting Itafos and phosphate markets. The preview shown here is the exact document you’ll receive after purchase—fully formatted and ready to use. It includes data-driven insights, risk implications, and strategic considerations to support investment or corporate decisions.











