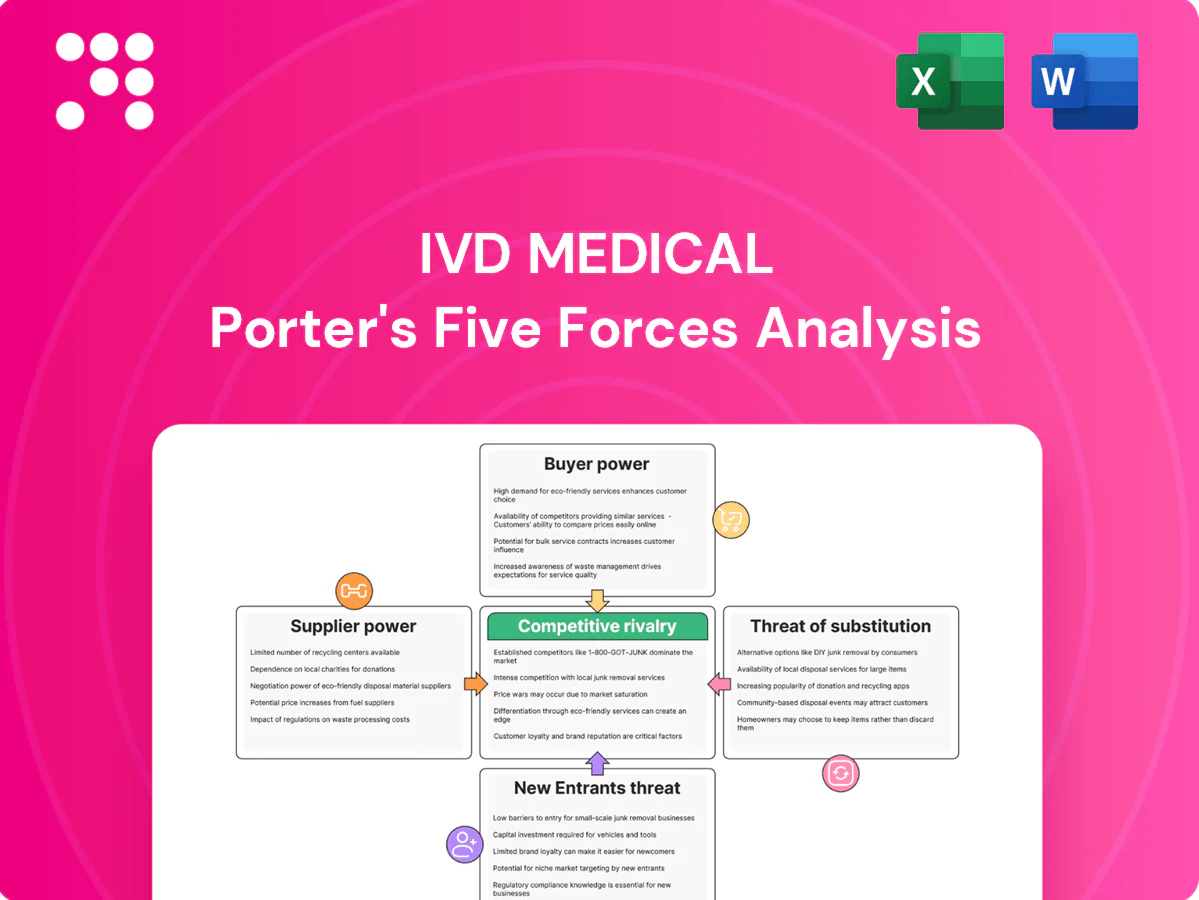
IVD Medical Porter's Five Forces Analysis

A Must-Have Tool for Decision-Makers
IVD Medical faces moderate supplier power and rising buyer expectations amid rapid diagnostic innovation, while regulatory barriers and consolidation temper the threat of new entrants. Competitive rivalry is intense with margin pressure from established players and low-cost alternatives. Substitute technologies and reimbursement shifts add external risk. This brief snapshot only scratches the surface—unlock the full Porter's Five Forces Analysis to explore IVD Medical’s competitive dynamics in depth.
Suppliers Bargaining Power

Global OEM concentration
Leading IVD OEMs—Roche, Abbott, Siemens Healthineers, Beckman Coulter and major domestic players—control over 60% of high-performance assay menus and analyzer ecosystems, creating scarce alternatives for key reagents and instruments. This concentration boosts supplier leverage on pricing, allocation and territory control, forcing distributors to meet strict compliance and service SLAs to retain exclusivity and volumes. Supplier consolidation or portfolio rationalization can rapidly reweight bargaining power.
Platform lock-in (analyzer–reagent coupling)
Closed-system analyzers bind hospitals to proprietary reagents, making distributor portfolios dependent on OEM relationships and concentrating reagent spend with top vendors; contract renewal cycles (typically 3–5 years in 2024) become strategic pinch points. This lock-in boosts supplier power over margins, discounts and service terms. Distributors mitigate with multi-brand portfolios and cross-platform coverage, but platform substitution is slow and capital-intensive.

Regulatory and quality dependencies
Suppliers control NMPA product registrations, clinical evidence and QMS dossiers, with median technical review times near 180 days in 2024, concentrating regulatory leverage upstream. Delays or labeling, shelf‑life or cold‑chain spec changes directly disrupt distributor turnover and working capital, often extending lead times and inventory hold periods. High reliance on supplier technical files and recalls materially raises operational risk, while strong QMS alignment reduces friction but does not eliminate dependency.

Territorial exclusivity and channel policies
OEMs assign exclusive or semi-exclusive territories with strict MAP and channel rules; breaches can trigger line termination and transfer account value to rival distributors. In 2024 the top 10 IVD suppliers control roughly 70% of the market, enabling re-routing of high-volume accounts to direct sales or tier-1 partners. Negotiating stable territory and key-account protection is critical to margin visibility and revenue forecasting.
- Territory exclusivity: protects margins
- MAP/channel rules: compliance required
- Risk: line loss → value shift to rivals
- 2024 fact: top 10 = ~70% market share
Domestic substitution and price guidance
China’s 2024 IVD push elevated domestic OEMs—homegrown firms captured roughly 60% of test kit unit volume and drove pricing floors via procurement rules, giving suppliers leverage on favored access and distributor terms. As tenders increasingly require domestically produced assays, compliant suppliers shape channel margins, though rising local competition fragments supplier power in segments like reagents and POCT.
- Domestic share ~60% (2024)
- Procurement-led pricing floors
- Compliance = distributor leverage
- Fragmentation in reagents/POCT
- Distributors hedge with multinationals
IVD market: Top 10 hold ~70% and NMPA median review ~180 days; distributors use tenders
Leading IVD OEMs (top 10 ~70% market share in 2024) and closed systems create strong supplier leverage on pricing, service SLAs and territory rules. Regulatory control (median NMPA technical review ~180 days in 2024) and exclusive reagent lock‑in increase switching costs and working capital risk. Distributors counter with multi‑brand portfolios, tender focus and selective direct sourcing.
| Metric | 2024 Value |
|---|---|
| Top 10 market share | ~70% |
| Domestic unit share | ~60% |
| NMPA median review | ~180 days |
| Contract cycle | 3–5 yrs |
What is included in the product
 Detailed Word Document
Uncovers key drivers of competition, customer influence, and market entry risks specific to IVD Medical, assessing supplier and buyer power, threat of substitutes, and intensity of rivalry. Highlights disruptive technologies, regulatory barriers, and strategic defenses that shape pricing, margins, and growth prospects.

 Customizable Excel Spreadsheet
A one-sheet Porter's Five Forces for IVD Medical that maps competitive pressure with an editable spider chart and customizable scores—perfect for quick strategic decisions, slide-ready decks, and scenario tabs (pre/post regulation or new entrants); no macros, simple data swaps, and seamless Excel/report integration to remove analysis bottlenecks.
Customers Bargaining Power

Public hospital tendering and volume-based procurement
Centralized provincial and alliance tenders aggregate demand—public procurement often represents over 50% of hospital IVD volume—and compress prices, with reported tender discounts commonly in the 20–40% range in recent Chinese and EU procurement cycles (2023–24). Winning bids hinge on bundled instrument–reagent deals and lifetime service commitments; buyers leverage volume promises and switching threats during tender cycles. Distributors must excel at bid preparation and post-award fulfillment to retain share.
Group purchasing organizations (GPOs) and hospital alliances
Large GPOs and hospital alliances exert strong buyer power, negotiating steep discounts (commonly eroding 15–30% of list price) and extended payment terms; top GPOs in 2024 manage procurement for roughly 70–80% of US hospitals, aggregating demand that squeezes per-unit margins and shifts inventory and uptime risk upstream to distributors. Value-added services and uptime guarantees become key differentiation levers, with contract performance metrics heavily dictating renewals.

Technical evaluation committees
Technical evaluation committees in hospitals assess multi-criteria beyond price—ROC AUCs (≥0.90 considered excellent), throughput and service responsiveness—making buyers highly informed and raising distributor thresholds; with the global IVD market topping roughly $100B in 2024, price alone rarely wins. Demonstrations, validation support and training blunt pure price pressure, while strong KOL engagement creates sticky, adoption-resistant relationships.

Payment terms and receivables pressure
Buyers push extended credit, stretching distributor cash cycles; public hospital reimbursements in 2024 commonly lag 60–120 days, worsening working capital strain. Distributors often concede 1–5 percentage points of margin for faster payment or prepayment of reagents via managed-inventory programs. Credit insurance (covering up to ~90% of invoices) and AR financing (costs ~1.5–4% in 2024) partially offset buyer power.
- Extended credit: 60–120 day reimbursement delays
- Margin trade-off: 1–5 pp for faster cash
- Mitigants: credit insurance up to ~90%, AR financing 1.5–4%
Switching costs vary by segment
Switching costs vary by segment: high-throughput core lab platforms carry steep post-installation lock-in (capital outlays often $0.5–2M and multi-year integration), moderating buyer power; POCT and commodity reagents are largely interchangeable, increasing buyer leverage as the POCT segment grew ~7% CAGR into 2024. Buyers multi-source low-differentiation assays while signing long-term contracts for specialty/immunoassay menus; service SLAs can shift power in installed bases.
- Core lab: high switching costs, reduced buyer power
- POCT/commodity reagents: high interchangeability, elevated buyer leverage
- Multi-sourcing common for low-diff assays
- Long-term locks for specialty/immunoassays; SLAs influence installed-base power
Buyers dominate IVD: >50% public, 20-40% tenders cash lag
Buyers wield strong power: public procurement >50% of hospital IVD volume with tender discounts 20–40% (2023–24), GPOs covering ~70–80% of US hospitals drive 15–30% price erosion, and global IVD market ≈$100B in 2024. POCT grew ~7% CAGR into 2024, increasing buyer leverage for commodity assays. Reimbursement delays 60–120 days strain distributor cash.
| Metric | Value | Impact |
|---|---|---|
| Public procurement share | >50% | High price pressure |
| Tender discounts | 20–40% | Margin erosion |
| GPO coverage (US) | 70–80% | Aggregated leverage |
| Global IVD market | ≈$100B (2024) | Large scale |
| POCT CAGR | ~7% to 2024 | Higher interchangeability |
| Reimbursement lag | 60–120 days | Working capital strain |
Preview Before You Purchase
IVD Medical Porter's Five Forces Analysis
This preview shows the exact IVD Medical Porter's Five Forces analysis you'll receive immediately after purchase—no placeholders. The document displayed is the final, professionally formatted file, ready for download and use the moment you buy. No mockups or samples; what you see is exactly what you'll get.

A Must-Have Tool for Decision-Makers
IVD Medical faces moderate supplier power and rising buyer expectations amid rapid diagnostic innovation, while regulatory barriers and consolidation temper the threat of new entrants. Competitive rivalry is intense with margin pressure from established players and low-cost alternatives. Substitute technologies and reimbursement shifts add external risk. This brief snapshot only scratches the surface—unlock the full Porter's Five Forces Analysis to explore IVD Medical’s competitive dynamics in depth.
Suppliers Bargaining Power
Global OEM concentration
Leading IVD OEMs—Roche, Abbott, Siemens Healthineers, Beckman Coulter and major domestic players—control over 60% of high-performance assay menus and analyzer ecosystems, creating scarce alternatives for key reagents and instruments. This concentration boosts supplier leverage on pricing, allocation and territory control, forcing distributors to meet strict compliance and service SLAs to retain exclusivity and volumes. Supplier consolidation or portfolio rationalization can rapidly reweight bargaining power.
Platform lock-in (analyzer–reagent coupling)
Closed-system analyzers bind hospitals to proprietary reagents, making distributor portfolios dependent on OEM relationships and concentrating reagent spend with top vendors; contract renewal cycles (typically 3–5 years in 2024) become strategic pinch points. This lock-in boosts supplier power over margins, discounts and service terms. Distributors mitigate with multi-brand portfolios and cross-platform coverage, but platform substitution is slow and capital-intensive.
Regulatory and quality dependencies
Suppliers control NMPA product registrations, clinical evidence and QMS dossiers, with median technical review times near 180 days in 2024, concentrating regulatory leverage upstream. Delays or labeling, shelf‑life or cold‑chain spec changes directly disrupt distributor turnover and working capital, often extending lead times and inventory hold periods. High reliance on supplier technical files and recalls materially raises operational risk, while strong QMS alignment reduces friction but does not eliminate dependency.
Territorial exclusivity and channel policies
OEMs assign exclusive or semi-exclusive territories with strict MAP and channel rules; breaches can trigger line termination and transfer account value to rival distributors. In 2024 the top 10 IVD suppliers control roughly 70% of the market, enabling re-routing of high-volume accounts to direct sales or tier-1 partners. Negotiating stable territory and key-account protection is critical to margin visibility and revenue forecasting.
- Territory exclusivity: protects margins
- MAP/channel rules: compliance required
- Risk: line loss → value shift to rivals
- 2024 fact: top 10 = ~70% market share
Domestic substitution and price guidance
China’s 2024 IVD push elevated domestic OEMs—homegrown firms captured roughly 60% of test kit unit volume and drove pricing floors via procurement rules, giving suppliers leverage on favored access and distributor terms. As tenders increasingly require domestically produced assays, compliant suppliers shape channel margins, though rising local competition fragments supplier power in segments like reagents and POCT.
- Domestic share ~60% (2024)
- Procurement-led pricing floors
- Compliance = distributor leverage
- Fragmentation in reagents/POCT
- Distributors hedge with multinationals
IVD market: Top 10 hold ~70% and NMPA median review ~180 days; distributors use tenders
Leading IVD OEMs (top 10 ~70% market share in 2024) and closed systems create strong supplier leverage on pricing, service SLAs and territory rules. Regulatory control (median NMPA technical review ~180 days in 2024) and exclusive reagent lock‑in increase switching costs and working capital risk. Distributors counter with multi‑brand portfolios, tender focus and selective direct sourcing.
| Metric | 2024 Value |
|---|---|
| Top 10 market share | ~70% |
| Domestic unit share | ~60% |
| NMPA median review | ~180 days |
| Contract cycle | 3–5 yrs |
What is included in the product
Detailed Word Document
Uncovers key drivers of competition, customer influence, and market entry risks specific to IVD Medical, assessing supplier and buyer power, threat of substitutes, and intensity of rivalry. Highlights disruptive technologies, regulatory barriers, and strategic defenses that shape pricing, margins, and growth prospects.
Customizable Excel Spreadsheet
A one-sheet Porter's Five Forces for IVD Medical that maps competitive pressure with an editable spider chart and customizable scores—perfect for quick strategic decisions, slide-ready decks, and scenario tabs (pre/post regulation or new entrants); no macros, simple data swaps, and seamless Excel/report integration to remove analysis bottlenecks.
Customers Bargaining Power
Public hospital tendering and volume-based procurement
Centralized provincial and alliance tenders aggregate demand—public procurement often represents over 50% of hospital IVD volume—and compress prices, with reported tender discounts commonly in the 20–40% range in recent Chinese and EU procurement cycles (2023–24). Winning bids hinge on bundled instrument–reagent deals and lifetime service commitments; buyers leverage volume promises and switching threats during tender cycles. Distributors must excel at bid preparation and post-award fulfillment to retain share.
Group purchasing organizations (GPOs) and hospital alliances
Large GPOs and hospital alliances exert strong buyer power, negotiating steep discounts (commonly eroding 15–30% of list price) and extended payment terms; top GPOs in 2024 manage procurement for roughly 70–80% of US hospitals, aggregating demand that squeezes per-unit margins and shifts inventory and uptime risk upstream to distributors. Value-added services and uptime guarantees become key differentiation levers, with contract performance metrics heavily dictating renewals.
Technical evaluation committees
Technical evaluation committees in hospitals assess multi-criteria beyond price—ROC AUCs (≥0.90 considered excellent), throughput and service responsiveness—making buyers highly informed and raising distributor thresholds; with the global IVD market topping roughly $100B in 2024, price alone rarely wins. Demonstrations, validation support and training blunt pure price pressure, while strong KOL engagement creates sticky, adoption-resistant relationships.
Payment terms and receivables pressure
Buyers push extended credit, stretching distributor cash cycles; public hospital reimbursements in 2024 commonly lag 60–120 days, worsening working capital strain. Distributors often concede 1–5 percentage points of margin for faster payment or prepayment of reagents via managed-inventory programs. Credit insurance (covering up to ~90% of invoices) and AR financing (costs ~1.5–4% in 2024) partially offset buyer power.
- Extended credit: 60–120 day reimbursement delays
- Margin trade-off: 1–5 pp for faster cash
- Mitigants: credit insurance up to ~90%, AR financing 1.5–4%
Switching costs vary by segment
Switching costs vary by segment: high-throughput core lab platforms carry steep post-installation lock-in (capital outlays often $0.5–2M and multi-year integration), moderating buyer power; POCT and commodity reagents are largely interchangeable, increasing buyer leverage as the POCT segment grew ~7% CAGR into 2024. Buyers multi-source low-differentiation assays while signing long-term contracts for specialty/immunoassay menus; service SLAs can shift power in installed bases.
- Core lab: high switching costs, reduced buyer power
- POCT/commodity reagents: high interchangeability, elevated buyer leverage
- Multi-sourcing common for low-diff assays
- Long-term locks for specialty/immunoassays; SLAs influence installed-base power
Buyers dominate IVD: >50% public, 20-40% tenders cash lag
Buyers wield strong power: public procurement >50% of hospital IVD volume with tender discounts 20–40% (2023–24), GPOs covering ~70–80% of US hospitals drive 15–30% price erosion, and global IVD market ≈$100B in 2024. POCT grew ~7% CAGR into 2024, increasing buyer leverage for commodity assays. Reimbursement delays 60–120 days strain distributor cash.
| Metric | Value | Impact |
|---|---|---|
| Public procurement share | >50% | High price pressure |
| Tender discounts | 20–40% | Margin erosion |
| GPO coverage (US) | 70–80% | Aggregated leverage |
| Global IVD market | ≈$100B (2024) | Large scale |
| POCT CAGR | ~7% to 2024 | Higher interchangeability |
| Reimbursement lag | 60–120 days | Working capital strain |
Preview Before You Purchase
IVD Medical Porter's Five Forces Analysis
This preview shows the exact IVD Medical Porter's Five Forces analysis you'll receive immediately after purchase—no placeholders. The document displayed is the final, professionally formatted file, ready for download and use the moment you buy. No mockups or samples; what you see is exactly what you'll get.
Original: $10.00
-65%$10.00
$3.50Description
A Must-Have Tool for Decision-Makers
IVD Medical faces moderate supplier power and rising buyer expectations amid rapid diagnostic innovation, while regulatory barriers and consolidation temper the threat of new entrants. Competitive rivalry is intense with margin pressure from established players and low-cost alternatives. Substitute technologies and reimbursement shifts add external risk. This brief snapshot only scratches the surface—unlock the full Porter's Five Forces Analysis to explore IVD Medical’s competitive dynamics in depth.
Suppliers Bargaining Power
Global OEM concentration
Leading IVD OEMs—Roche, Abbott, Siemens Healthineers, Beckman Coulter and major domestic players—control over 60% of high-performance assay menus and analyzer ecosystems, creating scarce alternatives for key reagents and instruments. This concentration boosts supplier leverage on pricing, allocation and territory control, forcing distributors to meet strict compliance and service SLAs to retain exclusivity and volumes. Supplier consolidation or portfolio rationalization can rapidly reweight bargaining power.
Platform lock-in (analyzer–reagent coupling)
Closed-system analyzers bind hospitals to proprietary reagents, making distributor portfolios dependent on OEM relationships and concentrating reagent spend with top vendors; contract renewal cycles (typically 3–5 years in 2024) become strategic pinch points. This lock-in boosts supplier power over margins, discounts and service terms. Distributors mitigate with multi-brand portfolios and cross-platform coverage, but platform substitution is slow and capital-intensive.
Regulatory and quality dependencies
Suppliers control NMPA product registrations, clinical evidence and QMS dossiers, with median technical review times near 180 days in 2024, concentrating regulatory leverage upstream. Delays or labeling, shelf‑life or cold‑chain spec changes directly disrupt distributor turnover and working capital, often extending lead times and inventory hold periods. High reliance on supplier technical files and recalls materially raises operational risk, while strong QMS alignment reduces friction but does not eliminate dependency.
Territorial exclusivity and channel policies
OEMs assign exclusive or semi-exclusive territories with strict MAP and channel rules; breaches can trigger line termination and transfer account value to rival distributors. In 2024 the top 10 IVD suppliers control roughly 70% of the market, enabling re-routing of high-volume accounts to direct sales or tier-1 partners. Negotiating stable territory and key-account protection is critical to margin visibility and revenue forecasting.
- Territory exclusivity: protects margins
- MAP/channel rules: compliance required
- Risk: line loss → value shift to rivals
- 2024 fact: top 10 = ~70% market share
Domestic substitution and price guidance
China’s 2024 IVD push elevated domestic OEMs—homegrown firms captured roughly 60% of test kit unit volume and drove pricing floors via procurement rules, giving suppliers leverage on favored access and distributor terms. As tenders increasingly require domestically produced assays, compliant suppliers shape channel margins, though rising local competition fragments supplier power in segments like reagents and POCT.
- Domestic share ~60% (2024)
- Procurement-led pricing floors
- Compliance = distributor leverage
- Fragmentation in reagents/POCT
- Distributors hedge with multinationals
IVD market: Top 10 hold ~70% and NMPA median review ~180 days; distributors use tenders
Leading IVD OEMs (top 10 ~70% market share in 2024) and closed systems create strong supplier leverage on pricing, service SLAs and territory rules. Regulatory control (median NMPA technical review ~180 days in 2024) and exclusive reagent lock‑in increase switching costs and working capital risk. Distributors counter with multi‑brand portfolios, tender focus and selective direct sourcing.
| Metric | 2024 Value |
|---|---|
| Top 10 market share | ~70% |
| Domestic unit share | ~60% |
| NMPA median review | ~180 days |
| Contract cycle | 3–5 yrs |
What is included in the product
Detailed Word Document
Uncovers key drivers of competition, customer influence, and market entry risks specific to IVD Medical, assessing supplier and buyer power, threat of substitutes, and intensity of rivalry. Highlights disruptive technologies, regulatory barriers, and strategic defenses that shape pricing, margins, and growth prospects.
Customizable Excel Spreadsheet
A one-sheet Porter's Five Forces for IVD Medical that maps competitive pressure with an editable spider chart and customizable scores—perfect for quick strategic decisions, slide-ready decks, and scenario tabs (pre/post regulation or new entrants); no macros, simple data swaps, and seamless Excel/report integration to remove analysis bottlenecks.
Customers Bargaining Power
Public hospital tendering and volume-based procurement
Centralized provincial and alliance tenders aggregate demand—public procurement often represents over 50% of hospital IVD volume—and compress prices, with reported tender discounts commonly in the 20–40% range in recent Chinese and EU procurement cycles (2023–24). Winning bids hinge on bundled instrument–reagent deals and lifetime service commitments; buyers leverage volume promises and switching threats during tender cycles. Distributors must excel at bid preparation and post-award fulfillment to retain share.
Group purchasing organizations (GPOs) and hospital alliances
Large GPOs and hospital alliances exert strong buyer power, negotiating steep discounts (commonly eroding 15–30% of list price) and extended payment terms; top GPOs in 2024 manage procurement for roughly 70–80% of US hospitals, aggregating demand that squeezes per-unit margins and shifts inventory and uptime risk upstream to distributors. Value-added services and uptime guarantees become key differentiation levers, with contract performance metrics heavily dictating renewals.
Technical evaluation committees
Technical evaluation committees in hospitals assess multi-criteria beyond price—ROC AUCs (≥0.90 considered excellent), throughput and service responsiveness—making buyers highly informed and raising distributor thresholds; with the global IVD market topping roughly $100B in 2024, price alone rarely wins. Demonstrations, validation support and training blunt pure price pressure, while strong KOL engagement creates sticky, adoption-resistant relationships.
Payment terms and receivables pressure
Buyers push extended credit, stretching distributor cash cycles; public hospital reimbursements in 2024 commonly lag 60–120 days, worsening working capital strain. Distributors often concede 1–5 percentage points of margin for faster payment or prepayment of reagents via managed-inventory programs. Credit insurance (covering up to ~90% of invoices) and AR financing (costs ~1.5–4% in 2024) partially offset buyer power.
- Extended credit: 60–120 day reimbursement delays
- Margin trade-off: 1–5 pp for faster cash
- Mitigants: credit insurance up to ~90%, AR financing 1.5–4%
Switching costs vary by segment
Switching costs vary by segment: high-throughput core lab platforms carry steep post-installation lock-in (capital outlays often $0.5–2M and multi-year integration), moderating buyer power; POCT and commodity reagents are largely interchangeable, increasing buyer leverage as the POCT segment grew ~7% CAGR into 2024. Buyers multi-source low-differentiation assays while signing long-term contracts for specialty/immunoassay menus; service SLAs can shift power in installed bases.
- Core lab: high switching costs, reduced buyer power
- POCT/commodity reagents: high interchangeability, elevated buyer leverage
- Multi-sourcing common for low-diff assays
- Long-term locks for specialty/immunoassays; SLAs influence installed-base power
Buyers dominate IVD: >50% public, 20-40% tenders cash lag
Buyers wield strong power: public procurement >50% of hospital IVD volume with tender discounts 20–40% (2023–24), GPOs covering ~70–80% of US hospitals drive 15–30% price erosion, and global IVD market ≈$100B in 2024. POCT grew ~7% CAGR into 2024, increasing buyer leverage for commodity assays. Reimbursement delays 60–120 days strain distributor cash.
| Metric | Value | Impact |
|---|---|---|
| Public procurement share | >50% | High price pressure |
| Tender discounts | 20–40% | Margin erosion |
| GPO coverage (US) | 70–80% | Aggregated leverage |
| Global IVD market | ≈$100B (2024) | Large scale |
| POCT CAGR | ~7% to 2024 | Higher interchangeability |
| Reimbursement lag | 60–120 days | Working capital strain |
Preview Before You Purchase
IVD Medical Porter's Five Forces Analysis
This preview shows the exact IVD Medical Porter's Five Forces analysis you'll receive immediately after purchase—no placeholders. The document displayed is the final, professionally formatted file, ready for download and use the moment you buy. No mockups or samples; what you see is exactly what you'll get.











