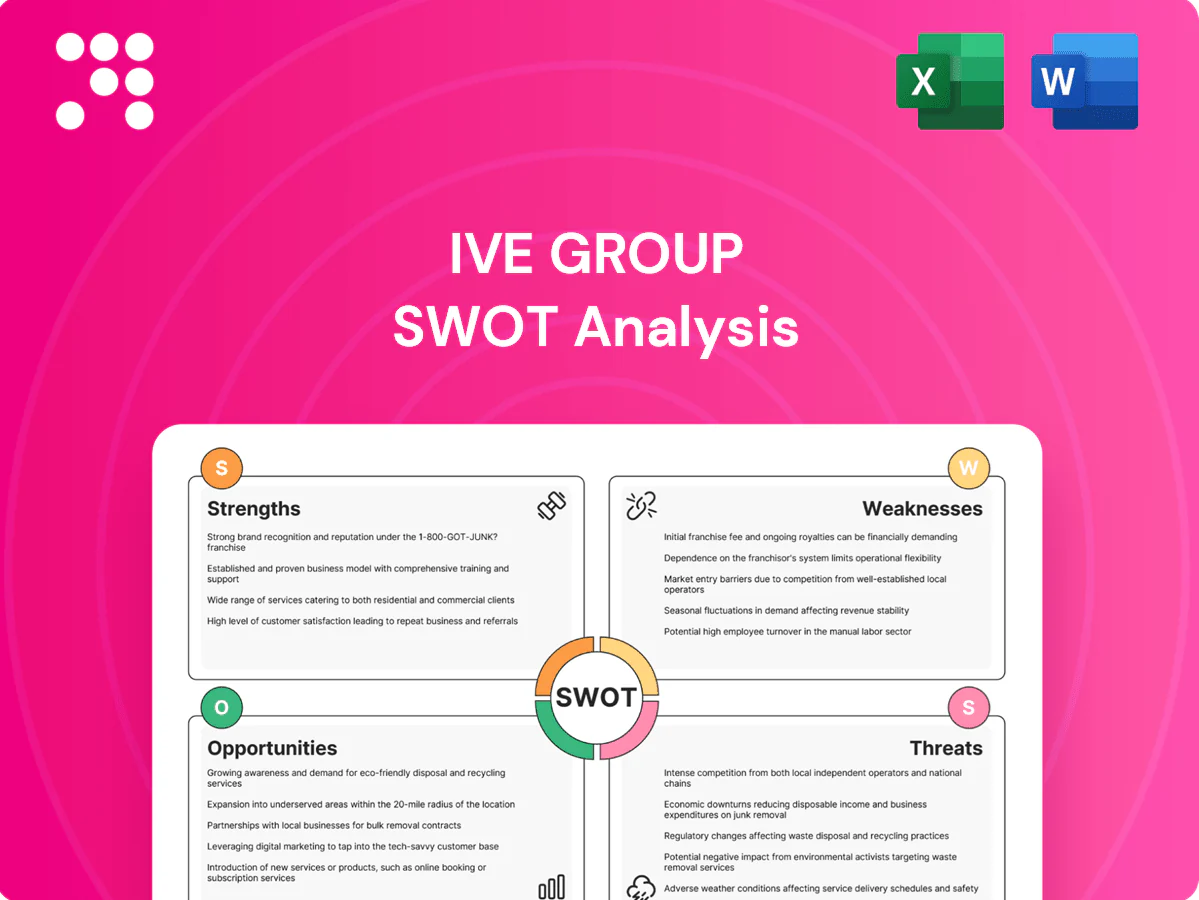
IVE Group SWOT Analysis

Your Strategic Toolkit Starts Here
IVE Group's diversified print and digital services, strong client relationships, and operational scale position it well in a transitioning media market, but margin pressure, tech disruption, and concentration risk warrant close scrutiny. Our full SWOT unpacks these dynamics with financial context, strategic recommendations, and editable Word/Excel deliverables to support investment or planning decisions—purchase the complete report to get the full picture.
Strengths

Market leadership and scale in Australia
As Australia’s largest diversified marketing and print communications provider, IVE Group leverages brand recognition and bargaining power, supported by over A$800m in annual revenue and around 3,000 employees. Scale drives cost efficiencies, broader service breadth and resilience through high volumes, enabling capture of large, multi‑year enterprise contracts. This leadership creates meaningful barriers to entry for smaller rivals.
End-to-end integrated service offering
IVE Group (ASX: IGL) provides end-to-end services across strategy, creative, data, digital, print and fulfilment, creating a one-stop solution that reduces client friction and accelerates speed-to-market. This integration strengthens client retention and raises switching costs, enabling premium pricing for bundled solutions. Cross-functional execution improves campaign consistency and measurable ROI, supporting enterprise client relationships into 2024–25.

Data-driven and personalization capabilities
IVE Group (ASX: IGL) leverages strong data and analytics to underpin targeted omnichannel communications, driving personalization that elevates campaign effectiveness and measurable outcomes. McKinsey estimates personalization can deliver five to eight times the ROI on marketing spend, which IVE amplifies through variable-data print and coordinated digital triggers. This capability aligns with clients’ demand for accountable marketing spend.

Diversified client base across industries
- ASX: IGL
- Multi-sector coverage reduces single-industry exposure
- Enables cross-sell and solution reuse
- Long-term clients improve revenue visibility
National production footprint and fulfillment strength
IVE Group's national production footprint—over 70 sites across Australia and New Zealand—and A$1.04bn FY24 revenue support complex, time‑critical rollouts with in‑house logistics and kitting improving reliability and cost control; scale also strengthens quality assurance and regulatory compliance, creating end‑to‑end control difficult for niche players to replicate.
- Wide footprint: over 70 sites
- FY24 revenue: A$1.04bn
- End‑to‑end logistics & kitting
A$1.04bn FY24 revenue and 70+ sites drive scale and data-led marketing edge
IVE Group (ASX: IGL) is Australia's largest marketing and print communications provider with FY24 revenue A$1.04bn, ~3,000 employees and 70+ sites, delivering scale-driven cost advantages and enterprise contract access. Integrated end-to-end services across creative, data, digital, print and fulfilment boost retention and premium pricing. Strong data/analytics enable high-ROI personalization and cross-sector diversification reduces cyclicality.
| Metric | Value |
|---|---|
| FY24 revenue | A$1.04bn |
| Employees | ~3,000 |
| Sites | 70+ |
| ASX ticker | IGL |
What is included in the product
 Detailed Word Document
Delivers a strategic overview of IVE Group’s internal and external business factors, outlining strengths, weaknesses, opportunities and threats to assess its competitive position and future growth prospects.

 Customizable Excel Spreadsheet
Provides a concise, editable SWOT matrix tailored to IVE Group for fast strategic alignment and stakeholder-ready presentation. Enables quick updates to reflect shifting priorities and simplifies cross-unit comparisons for decision-makers.
Weaknesses

Structural exposure to print demand
Despite diversification, IVE still derives a substantial portion of revenue from print-related services—around 40% of FY24 group revenue (~AUD 1.13bn)—so secular digital shifts can reduce utilisation and pricing power. Maintaining legacy print capacity increases fixed-cost burden, compressing margins observed in recent quarters. Transitioning the portfolio requires ongoing capex and change management to retool operations and sales channels.
Capital-intensive operations
Printing and fulfilment depend on heavy equipment and facilities—large web-offset and digital presses typically cost 2–10 million AUD apiece, driving high maintenance and fixed overheads. IVE Group is a >1 billion AUD revenue business, so capex cycles of tens of millions can constrain free cash flow and amplify operating leverage in downturns. Asset intensity raises obsolescence risk as printing technology refreshes every 5–10 years.

Margin pressure from commoditization
Standard print runs and basic production are highly price-competitive, with procurement-driven RFPs routinely compressing gross margins. Differentiation depends on continually refreshed value-added services such as design, fulfilment and digital solutions. Persistent discounting by smaller rivals drags pricing and forces margin erosion unless higher-value offerings are scaled and protected.

Technology integration and talent complexity
- Hybrid talent scarcity
- Legacy integration delays
- Ongoing upskilling/retention costs
Geographic concentration
IVE Group remains heavily Australia-focused with most operations and revenue generated domestically, exposing the company to Australian macro shocks and currency concentration; overseas presence is limited and scaling internationally requires capital and local credibility while client expansion may outpace the current footprint.
- Dominant Australia revenue base
- High exposure to domestic macro shocks
- International revenue limited—expansion costly
- Client growth may exceed footprint
~40% print exposure, heavy capex and margin squeeze
IVE Group remains print-reliant—print-related services ~40% of FY24 group revenue (~AUD 1.13bn)—exposing pricing and utilisation to secular digital decline. High fixed costs and asset intensity compress margins as capex cycles run into tens of millions and presses refresh every 5–10 years. Limited international revenue concentrates domestic macro and FX risk.
| Metric | Value |
|---|---|
| FY24 revenue | AUD 1.13bn |
| Print-related share | ~40% |
| Capex/refresh | Tens of millions; 5–10y refresh |
Preview Before You Purchase
IVE Group SWOT Analysis
This is the actual SWOT analysis document for IVE Group you’ll receive upon purchase—professional, structured, and ready to use. The preview below is taken directly from the full report and reflects the real content; purchase unlocks the complete, editable version. It highlights key strengths, weaknesses, opportunities, and threats to support strategic decisions.

Your Strategic Toolkit Starts Here
IVE Group's diversified print and digital services, strong client relationships, and operational scale position it well in a transitioning media market, but margin pressure, tech disruption, and concentration risk warrant close scrutiny. Our full SWOT unpacks these dynamics with financial context, strategic recommendations, and editable Word/Excel deliverables to support investment or planning decisions—purchase the complete report to get the full picture.
Strengths
Market leadership and scale in Australia
As Australia’s largest diversified marketing and print communications provider, IVE Group leverages brand recognition and bargaining power, supported by over A$800m in annual revenue and around 3,000 employees. Scale drives cost efficiencies, broader service breadth and resilience through high volumes, enabling capture of large, multi‑year enterprise contracts. This leadership creates meaningful barriers to entry for smaller rivals.
End-to-end integrated service offering
IVE Group (ASX: IGL) provides end-to-end services across strategy, creative, data, digital, print and fulfilment, creating a one-stop solution that reduces client friction and accelerates speed-to-market. This integration strengthens client retention and raises switching costs, enabling premium pricing for bundled solutions. Cross-functional execution improves campaign consistency and measurable ROI, supporting enterprise client relationships into 2024–25.
Data-driven and personalization capabilities
IVE Group (ASX: IGL) leverages strong data and analytics to underpin targeted omnichannel communications, driving personalization that elevates campaign effectiveness and measurable outcomes. McKinsey estimates personalization can deliver five to eight times the ROI on marketing spend, which IVE amplifies through variable-data print and coordinated digital triggers. This capability aligns with clients’ demand for accountable marketing spend.
Diversified client base across industries
- ASX: IGL
- Multi-sector coverage reduces single-industry exposure
- Enables cross-sell and solution reuse
- Long-term clients improve revenue visibility
National production footprint and fulfillment strength
IVE Group's national production footprint—over 70 sites across Australia and New Zealand—and A$1.04bn FY24 revenue support complex, time‑critical rollouts with in‑house logistics and kitting improving reliability and cost control; scale also strengthens quality assurance and regulatory compliance, creating end‑to‑end control difficult for niche players to replicate.
- Wide footprint: over 70 sites
- FY24 revenue: A$1.04bn
- End‑to‑end logistics & kitting
A$1.04bn FY24 revenue and 70+ sites drive scale and data-led marketing edge
IVE Group (ASX: IGL) is Australia's largest marketing and print communications provider with FY24 revenue A$1.04bn, ~3,000 employees and 70+ sites, delivering scale-driven cost advantages and enterprise contract access. Integrated end-to-end services across creative, data, digital, print and fulfilment boost retention and premium pricing. Strong data/analytics enable high-ROI personalization and cross-sector diversification reduces cyclicality.
| Metric | Value |
|---|---|
| FY24 revenue | A$1.04bn |
| Employees | ~3,000 |
| Sites | 70+ |
| ASX ticker | IGL |
What is included in the product
Detailed Word Document
Delivers a strategic overview of IVE Group’s internal and external business factors, outlining strengths, weaknesses, opportunities and threats to assess its competitive position and future growth prospects.
Customizable Excel Spreadsheet
Provides a concise, editable SWOT matrix tailored to IVE Group for fast strategic alignment and stakeholder-ready presentation. Enables quick updates to reflect shifting priorities and simplifies cross-unit comparisons for decision-makers.
Weaknesses
Structural exposure to print demand
Despite diversification, IVE still derives a substantial portion of revenue from print-related services—around 40% of FY24 group revenue (~AUD 1.13bn)—so secular digital shifts can reduce utilisation and pricing power. Maintaining legacy print capacity increases fixed-cost burden, compressing margins observed in recent quarters. Transitioning the portfolio requires ongoing capex and change management to retool operations and sales channels.
Capital-intensive operations
Printing and fulfilment depend on heavy equipment and facilities—large web-offset and digital presses typically cost 2–10 million AUD apiece, driving high maintenance and fixed overheads. IVE Group is a >1 billion AUD revenue business, so capex cycles of tens of millions can constrain free cash flow and amplify operating leverage in downturns. Asset intensity raises obsolescence risk as printing technology refreshes every 5–10 years.
Margin pressure from commoditization
Standard print runs and basic production are highly price-competitive, with procurement-driven RFPs routinely compressing gross margins. Differentiation depends on continually refreshed value-added services such as design, fulfilment and digital solutions. Persistent discounting by smaller rivals drags pricing and forces margin erosion unless higher-value offerings are scaled and protected.
Technology integration and talent complexity
- Hybrid talent scarcity
- Legacy integration delays
- Ongoing upskilling/retention costs
Geographic concentration
IVE Group remains heavily Australia-focused with most operations and revenue generated domestically, exposing the company to Australian macro shocks and currency concentration; overseas presence is limited and scaling internationally requires capital and local credibility while client expansion may outpace the current footprint.
- Dominant Australia revenue base
- High exposure to domestic macro shocks
- International revenue limited—expansion costly
- Client growth may exceed footprint
~40% print exposure, heavy capex and margin squeeze
IVE Group remains print-reliant—print-related services ~40% of FY24 group revenue (~AUD 1.13bn)—exposing pricing and utilisation to secular digital decline. High fixed costs and asset intensity compress margins as capex cycles run into tens of millions and presses refresh every 5–10 years. Limited international revenue concentrates domestic macro and FX risk.
| Metric | Value |
|---|---|
| FY24 revenue | AUD 1.13bn |
| Print-related share | ~40% |
| Capex/refresh | Tens of millions; 5–10y refresh |
Preview Before You Purchase
IVE Group SWOT Analysis
This is the actual SWOT analysis document for IVE Group you’ll receive upon purchase—professional, structured, and ready to use. The preview below is taken directly from the full report and reflects the real content; purchase unlocks the complete, editable version. It highlights key strengths, weaknesses, opportunities, and threats to support strategic decisions.
Original: $10.00
-65%$10.00
$3.50Description
Your Strategic Toolkit Starts Here
IVE Group's diversified print and digital services, strong client relationships, and operational scale position it well in a transitioning media market, but margin pressure, tech disruption, and concentration risk warrant close scrutiny. Our full SWOT unpacks these dynamics with financial context, strategic recommendations, and editable Word/Excel deliverables to support investment or planning decisions—purchase the complete report to get the full picture.
Strengths
Market leadership and scale in Australia
As Australia’s largest diversified marketing and print communications provider, IVE Group leverages brand recognition and bargaining power, supported by over A$800m in annual revenue and around 3,000 employees. Scale drives cost efficiencies, broader service breadth and resilience through high volumes, enabling capture of large, multi‑year enterprise contracts. This leadership creates meaningful barriers to entry for smaller rivals.
End-to-end integrated service offering
IVE Group (ASX: IGL) provides end-to-end services across strategy, creative, data, digital, print and fulfilment, creating a one-stop solution that reduces client friction and accelerates speed-to-market. This integration strengthens client retention and raises switching costs, enabling premium pricing for bundled solutions. Cross-functional execution improves campaign consistency and measurable ROI, supporting enterprise client relationships into 2024–25.
Data-driven and personalization capabilities
IVE Group (ASX: IGL) leverages strong data and analytics to underpin targeted omnichannel communications, driving personalization that elevates campaign effectiveness and measurable outcomes. McKinsey estimates personalization can deliver five to eight times the ROI on marketing spend, which IVE amplifies through variable-data print and coordinated digital triggers. This capability aligns with clients’ demand for accountable marketing spend.
Diversified client base across industries
- ASX: IGL
- Multi-sector coverage reduces single-industry exposure
- Enables cross-sell and solution reuse
- Long-term clients improve revenue visibility
National production footprint and fulfillment strength
IVE Group's national production footprint—over 70 sites across Australia and New Zealand—and A$1.04bn FY24 revenue support complex, time‑critical rollouts with in‑house logistics and kitting improving reliability and cost control; scale also strengthens quality assurance and regulatory compliance, creating end‑to‑end control difficult for niche players to replicate.
- Wide footprint: over 70 sites
- FY24 revenue: A$1.04bn
- End‑to‑end logistics & kitting
A$1.04bn FY24 revenue and 70+ sites drive scale and data-led marketing edge
IVE Group (ASX: IGL) is Australia's largest marketing and print communications provider with FY24 revenue A$1.04bn, ~3,000 employees and 70+ sites, delivering scale-driven cost advantages and enterprise contract access. Integrated end-to-end services across creative, data, digital, print and fulfilment boost retention and premium pricing. Strong data/analytics enable high-ROI personalization and cross-sector diversification reduces cyclicality.
| Metric | Value |
|---|---|
| FY24 revenue | A$1.04bn |
| Employees | ~3,000 |
| Sites | 70+ |
| ASX ticker | IGL |
What is included in the product
Detailed Word Document
Delivers a strategic overview of IVE Group’s internal and external business factors, outlining strengths, weaknesses, opportunities and threats to assess its competitive position and future growth prospects.
Customizable Excel Spreadsheet
Provides a concise, editable SWOT matrix tailored to IVE Group for fast strategic alignment and stakeholder-ready presentation. Enables quick updates to reflect shifting priorities and simplifies cross-unit comparisons for decision-makers.
Weaknesses
Structural exposure to print demand
Despite diversification, IVE still derives a substantial portion of revenue from print-related services—around 40% of FY24 group revenue (~AUD 1.13bn)—so secular digital shifts can reduce utilisation and pricing power. Maintaining legacy print capacity increases fixed-cost burden, compressing margins observed in recent quarters. Transitioning the portfolio requires ongoing capex and change management to retool operations and sales channels.
Capital-intensive operations
Printing and fulfilment depend on heavy equipment and facilities—large web-offset and digital presses typically cost 2–10 million AUD apiece, driving high maintenance and fixed overheads. IVE Group is a >1 billion AUD revenue business, so capex cycles of tens of millions can constrain free cash flow and amplify operating leverage in downturns. Asset intensity raises obsolescence risk as printing technology refreshes every 5–10 years.
Margin pressure from commoditization
Standard print runs and basic production are highly price-competitive, with procurement-driven RFPs routinely compressing gross margins. Differentiation depends on continually refreshed value-added services such as design, fulfilment and digital solutions. Persistent discounting by smaller rivals drags pricing and forces margin erosion unless higher-value offerings are scaled and protected.
Technology integration and talent complexity
- Hybrid talent scarcity
- Legacy integration delays
- Ongoing upskilling/retention costs
Geographic concentration
IVE Group remains heavily Australia-focused with most operations and revenue generated domestically, exposing the company to Australian macro shocks and currency concentration; overseas presence is limited and scaling internationally requires capital and local credibility while client expansion may outpace the current footprint.
- Dominant Australia revenue base
- High exposure to domestic macro shocks
- International revenue limited—expansion costly
- Client growth may exceed footprint
~40% print exposure, heavy capex and margin squeeze
IVE Group remains print-reliant—print-related services ~40% of FY24 group revenue (~AUD 1.13bn)—exposing pricing and utilisation to secular digital decline. High fixed costs and asset intensity compress margins as capex cycles run into tens of millions and presses refresh every 5–10 years. Limited international revenue concentrates domestic macro and FX risk.
| Metric | Value |
|---|---|
| FY24 revenue | AUD 1.13bn |
| Print-related share | ~40% |
| Capex/refresh | Tens of millions; 5–10y refresh |
Preview Before You Purchase
IVE Group SWOT Analysis
This is the actual SWOT analysis document for IVE Group you’ll receive upon purchase—professional, structured, and ready to use. The preview below is taken directly from the full report and reflects the real content; purchase unlocks the complete, editable version. It highlights key strengths, weaknesses, opportunities, and threats to support strategic decisions.











