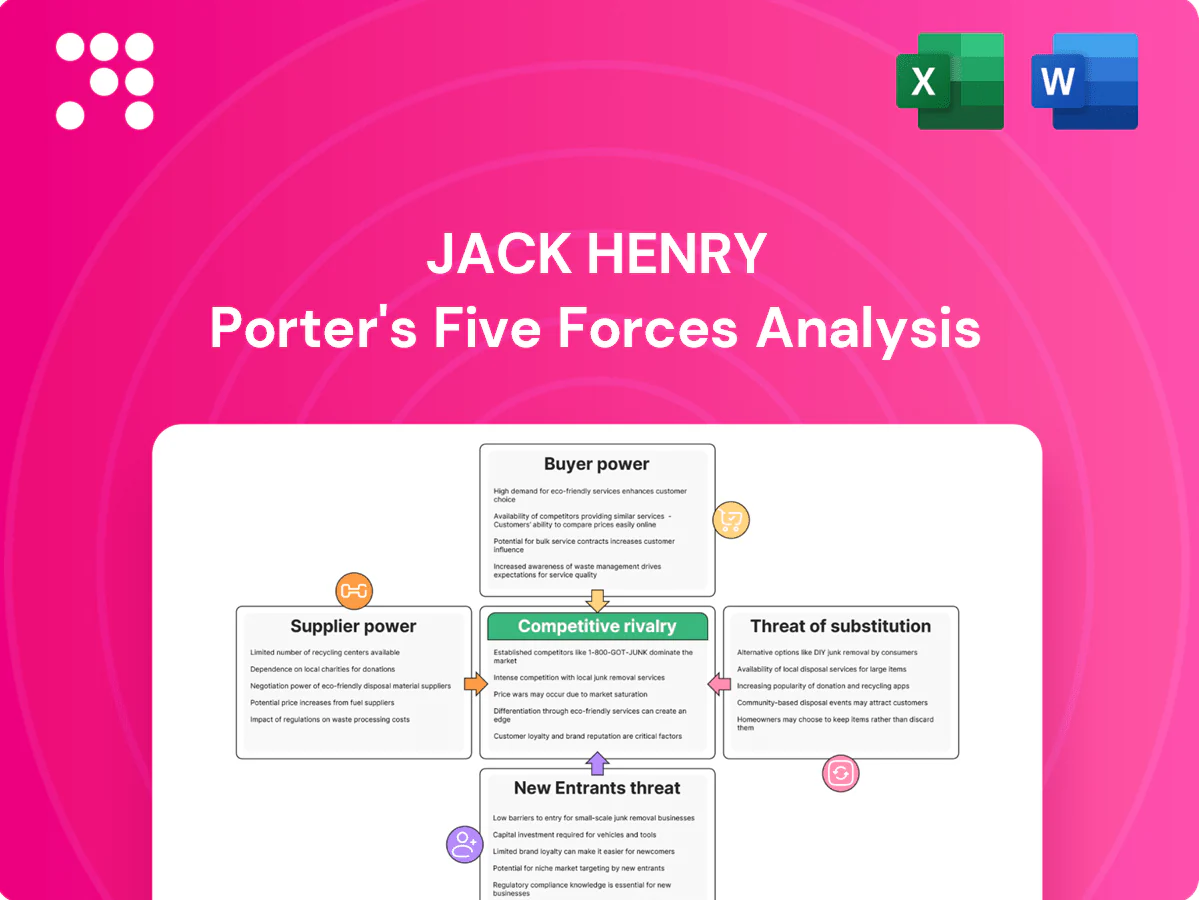
Jack Henry Porter's Five Forces Analysis

From Overview to Strategy Blueprint
Jack Henry’s Porter's Five Forces snapshot assesses competitive rivalry, supplier and buyer power, substitute threats, and barriers to entry to reveal pressure points shaping margins and growth. It highlights fintech disruption and consolidation risks while noting client stickiness as a defensive asset. This brief only scratches the surface—unlock the full Porter's Five Forces Analysis for force-by-force ratings, visuals, and actionable strategy guidance.
Suppliers Bargaining Power

Core software dependencies
Jack Henry depends on major database, middleware and OS vendors (Oracle, Microsoft, Red Hat), whose licensing and support terms can sway costs and upgrade timelines; enterprise DBMS spending exceeded $80B globally in 2024, concentrating vendor leverage.
Multi-vendor strategies and long-term contracts mitigate concentration risk—over 65% of U.S. financial processors reported multi-sourcing core stacks in 2024—reducing single-vendor exposure.
Open standards and APIs further lower lock-in, enabling integrations and cloud portability that constrain supplier bargaining power.
Cloud and infrastructure providers
Migration to cloud increases Jack Henry’s exposure to hyperscalers that held ~67% of global cloud IaaS/PaaS market in 2024 (AWS ~33%, Azure ~23%, Google ~11%), concentrating supplier power for compute, storage and AI services. Pricing shifts, egress fees often ranging roughly $0.05–0.12/GB and reserved-instance or savings-plan commitments (discounts up to ~72%) can compress margins. Diversifying across providers and hybrid on-prem deployments mitigate dependence but add integration costs. Regulatory, compliance and 99.99%‑class uptime SLAs create customer stickiness while raising compliance and audit expenses.

Payments networks and rails
Interchange rules and network fees—typically 1.5–3.5% on card transactions in the US—plus ACH and real‑time rail charges materially shape Jack Henry unit economics, and major networks retain standard‑setting and pricing power. Jack Henry mitigates impact through scale, bank partnerships and routing optimization. New rails (RTP, FedNow launched 2023) broaden routing options but require integration and capital investment.

Data and risk content suppliers
Credit bureaus (Experian, Equifax, TransUnion) and KYC/AML and fraud-intel vendors are essential inputs for Jack Henry; the Big Three together dominate consumer credit data supply, creating significant supplier leverage. High data quality and national coverage boost top providers’ bargaining power, while Jack Henry reduces dependency via multi-sourcing and proprietary analytics and enforces quality with contractual SLAs and audit rights.
- Big Three dominance: ~90% of US consumer credit records
- Multi-sourcing: lowers single-vendor risk
- SLA + audit rights: contractual quality enforcement
- Proprietary analytics: reduces raw-data reliance
Specialized talent and contractors
Skilled fintech engineers, security experts, and compliance professionals remain scarce, with the 2024 ISC2 report estimating a global cybersecurity workforce gap around 3.4 million, strengthening supplier power. Wage inflation and retention incentives pushed tech compensation up—Glassdoor's 2024 median US software engineer base near 115,000—while remote work widened the pool and competition. Training pipelines and automation (DevSecOps, LLM-assisted coding) are slowly reducing pressure.
- 2024 ISC2 gap ~3.4M
- Glassdoor 2024 median SE base ≈115,000
- Remote work increases candidate pool and competition
- Training + automation = longer-term relief
Banking tech margins squeezed by hyperscaler egress, card fees, data monopolies and talent gap
Jack Henry faces concentrated supplier power from DB/OS vendors (enterprise DBMS spend >$80B in 2024) and hyperscalers holding ~67% IaaS/PaaS (AWS 33%, Azure 23%, Google 11%), impacting costs, egress fees ($0.05–0.12/GB) and margins. Card/rail fees (1.5–3.5%) and Big Three credit data (~90% US records) also exert pricing leverage. Talent shortages (ISC2 gap ~3.4M; median US SE base ~$115k in 2024) raise compensation pressure.
| Metric | 2024 Value |
|---|---|
| Enterprise DBMS spend | >$80B |
| Hyperscaler IaaS/PaaS share | ~67% (AWS 33%, Azure 23%, GCP 11%) |
| Typical egress fee | $0.05–0.12/GB |
| Card/network fees | 1.5–3.5% |
| Big Three credit data share | ~90% |
| Cyber workforce gap (ISC2) | ~3.4M |
| Median US software engineer base | ≈$115k |
What is included in the product
 Detailed Word Document
Comprehensive Five Forces analysis of Jack Henry uncovering competitive intensity, buyer and supplier power, entry barriers, substitution risks, and strategic levers to protect market share.

 Customizable Excel Spreadsheet
Clear, one-sheet Jack Henry Porter Five Forces summary that instantly pinpoints competitive pain points with an interactive spider chart and customizable pressure levels for scenario testing.
Customers Bargaining Power

Fragmented community FI base
Jack Henry’s client base is drawn from a fragmented pool of over 5,000 community banks and credit unions in the US as of 2024, meaning buyers are numerous but individually small, limiting single-buyer leverage. Coordinated user groups and cooperatives still exert organized pressure to prioritize feature requests and integrations. The vendor offsets fragmentation with volume-based pricing tiers and modular SaaS bundles calibrated to institution size. This structure keeps customer bargaining power moderate rather than dominant.
High switching costs
Core conversions are risky, costly and time-consuming for financial institutions, often taking 12–36 months and costing multiple millions for mid-sized banks due to data migration, retraining and regulatory revalidation. These hurdles materially deter switching and reduce buyer price sensitivity once a provider is embedded. Competitive bids still occur at renewal cycles, especially where cost pressures or functionality gaps emerge.

Demand for integration and openness
Buyers increasingly require open APIs and best-of-breed integration, empowering negotiations for interoperability and lower vendor lock-in. Jack Henry’s open-banking posture and API-first platform align with 2024 regulatory and market expectations across the EU, UK and expanding APAC/LATAM implementations. Failure to integrate typically forces concessions or raises measurable churn risk for core vendors.

Price sensitivity in tight NIM cycles
Bargaining power rises as tight NIMs push banks to demand bundled discounts and cost efficiencies; outcome-based pricing and modular packaging are now core negotiation levers, with buyers using RFPs to extract margin relief and service guarantees. Multi-year commitments, typically 3–5 years, commonly trade deeper discounts for revenue certainty.
- Price pressure: bundled discounts
- Negotiation levers: outcome-based pricing
- Buyer tactics: RFP-driven value extraction
- Deal dynamics: 3–5 year commitments for bigger discounts
Compliance and uptime expectations
Zero-tolerance for outages and regulatory missteps pushes buyers to demand 99.99%–99.999% uptime (52.6 to 5.26 minutes downtime/year), shifting power via stringent SLAs and penalties; referenceability and exam readiness are decisive buying criteria, allowing trusted vendors to justify premium pricing for risk reduction and faster regulatory sign-off.
- Uptime targets: 99.99%–99.999%
- SLA penalties increase buyer leverage
- Referenceability drives vendor selection
- Risk-reduction supports premium pricing
Community banks limit vendor leverage; >5,000 clients, 12–36 mo swaps
Jack Henry faces moderate customer bargaining: >5,000 US community banks/credit unions (2024) limit single-buyer power, but coordinated groups extract features. Core switches take 12–36 months and often cost multi-million dollars, reducing churn. Buyers demand open APIs, 3–5 year contracts for discounts and 99.99%–99.999% uptime SLAs.
| Metric | 2024 |
|---|---|
| Client pool | >5,000 institutions |
| Switch time | 12–36 months |
| Switch cost | Multi-million USD |
| Contract length | 3–5 years |
| Uptime target | 99.99%–99.999% |
Preview Before You Purchase
Jack Henry Porter's Five Forces Analysis
This preview shows the exact Jack Henry Porter Five Forces Analysis you'll receive immediately after purchase—no surprises, no placeholders. The document displayed is the final, professionally formatted file, ready for download and immediate use. Once you buy, you'll get instant access to this identical, complete deliverable.

From Overview to Strategy Blueprint
Jack Henry’s Porter's Five Forces snapshot assesses competitive rivalry, supplier and buyer power, substitute threats, and barriers to entry to reveal pressure points shaping margins and growth. It highlights fintech disruption and consolidation risks while noting client stickiness as a defensive asset. This brief only scratches the surface—unlock the full Porter's Five Forces Analysis for force-by-force ratings, visuals, and actionable strategy guidance.
Suppliers Bargaining Power
Core software dependencies
Jack Henry depends on major database, middleware and OS vendors (Oracle, Microsoft, Red Hat), whose licensing and support terms can sway costs and upgrade timelines; enterprise DBMS spending exceeded $80B globally in 2024, concentrating vendor leverage.
Multi-vendor strategies and long-term contracts mitigate concentration risk—over 65% of U.S. financial processors reported multi-sourcing core stacks in 2024—reducing single-vendor exposure.
Open standards and APIs further lower lock-in, enabling integrations and cloud portability that constrain supplier bargaining power.
Cloud and infrastructure providers
Migration to cloud increases Jack Henry’s exposure to hyperscalers that held ~67% of global cloud IaaS/PaaS market in 2024 (AWS ~33%, Azure ~23%, Google ~11%), concentrating supplier power for compute, storage and AI services. Pricing shifts, egress fees often ranging roughly $0.05–0.12/GB and reserved-instance or savings-plan commitments (discounts up to ~72%) can compress margins. Diversifying across providers and hybrid on-prem deployments mitigate dependence but add integration costs. Regulatory, compliance and 99.99%‑class uptime SLAs create customer stickiness while raising compliance and audit expenses.
Payments networks and rails
Interchange rules and network fees—typically 1.5–3.5% on card transactions in the US—plus ACH and real‑time rail charges materially shape Jack Henry unit economics, and major networks retain standard‑setting and pricing power. Jack Henry mitigates impact through scale, bank partnerships and routing optimization. New rails (RTP, FedNow launched 2023) broaden routing options but require integration and capital investment.
Data and risk content suppliers
Credit bureaus (Experian, Equifax, TransUnion) and KYC/AML and fraud-intel vendors are essential inputs for Jack Henry; the Big Three together dominate consumer credit data supply, creating significant supplier leverage. High data quality and national coverage boost top providers’ bargaining power, while Jack Henry reduces dependency via multi-sourcing and proprietary analytics and enforces quality with contractual SLAs and audit rights.
- Big Three dominance: ~90% of US consumer credit records
- Multi-sourcing: lowers single-vendor risk
- SLA + audit rights: contractual quality enforcement
- Proprietary analytics: reduces raw-data reliance
Specialized talent and contractors
Skilled fintech engineers, security experts, and compliance professionals remain scarce, with the 2024 ISC2 report estimating a global cybersecurity workforce gap around 3.4 million, strengthening supplier power. Wage inflation and retention incentives pushed tech compensation up—Glassdoor's 2024 median US software engineer base near 115,000—while remote work widened the pool and competition. Training pipelines and automation (DevSecOps, LLM-assisted coding) are slowly reducing pressure.
- 2024 ISC2 gap ~3.4M
- Glassdoor 2024 median SE base ≈115,000
- Remote work increases candidate pool and competition
- Training + automation = longer-term relief
Banking tech margins squeezed by hyperscaler egress, card fees, data monopolies and talent gap
Jack Henry faces concentrated supplier power from DB/OS vendors (enterprise DBMS spend >$80B in 2024) and hyperscalers holding ~67% IaaS/PaaS (AWS 33%, Azure 23%, Google 11%), impacting costs, egress fees ($0.05–0.12/GB) and margins. Card/rail fees (1.5–3.5%) and Big Three credit data (~90% US records) also exert pricing leverage. Talent shortages (ISC2 gap ~3.4M; median US SE base ~$115k in 2024) raise compensation pressure.
| Metric | 2024 Value |
|---|---|
| Enterprise DBMS spend | >$80B |
| Hyperscaler IaaS/PaaS share | ~67% (AWS 33%, Azure 23%, GCP 11%) |
| Typical egress fee | $0.05–0.12/GB |
| Card/network fees | 1.5–3.5% |
| Big Three credit data share | ~90% |
| Cyber workforce gap (ISC2) | ~3.4M |
| Median US software engineer base | ≈$115k |
What is included in the product
Detailed Word Document
Comprehensive Five Forces analysis of Jack Henry uncovering competitive intensity, buyer and supplier power, entry barriers, substitution risks, and strategic levers to protect market share.
Customizable Excel Spreadsheet
Clear, one-sheet Jack Henry Porter Five Forces summary that instantly pinpoints competitive pain points with an interactive spider chart and customizable pressure levels for scenario testing.
Customers Bargaining Power
Fragmented community FI base
Jack Henry’s client base is drawn from a fragmented pool of over 5,000 community banks and credit unions in the US as of 2024, meaning buyers are numerous but individually small, limiting single-buyer leverage. Coordinated user groups and cooperatives still exert organized pressure to prioritize feature requests and integrations. The vendor offsets fragmentation with volume-based pricing tiers and modular SaaS bundles calibrated to institution size. This structure keeps customer bargaining power moderate rather than dominant.
High switching costs
Core conversions are risky, costly and time-consuming for financial institutions, often taking 12–36 months and costing multiple millions for mid-sized banks due to data migration, retraining and regulatory revalidation. These hurdles materially deter switching and reduce buyer price sensitivity once a provider is embedded. Competitive bids still occur at renewal cycles, especially where cost pressures or functionality gaps emerge.
Demand for integration and openness
Buyers increasingly require open APIs and best-of-breed integration, empowering negotiations for interoperability and lower vendor lock-in. Jack Henry’s open-banking posture and API-first platform align with 2024 regulatory and market expectations across the EU, UK and expanding APAC/LATAM implementations. Failure to integrate typically forces concessions or raises measurable churn risk for core vendors.
Price sensitivity in tight NIM cycles
Bargaining power rises as tight NIMs push banks to demand bundled discounts and cost efficiencies; outcome-based pricing and modular packaging are now core negotiation levers, with buyers using RFPs to extract margin relief and service guarantees. Multi-year commitments, typically 3–5 years, commonly trade deeper discounts for revenue certainty.
- Price pressure: bundled discounts
- Negotiation levers: outcome-based pricing
- Buyer tactics: RFP-driven value extraction
- Deal dynamics: 3–5 year commitments for bigger discounts
Compliance and uptime expectations
Zero-tolerance for outages and regulatory missteps pushes buyers to demand 99.99%–99.999% uptime (52.6 to 5.26 minutes downtime/year), shifting power via stringent SLAs and penalties; referenceability and exam readiness are decisive buying criteria, allowing trusted vendors to justify premium pricing for risk reduction and faster regulatory sign-off.
- Uptime targets: 99.99%–99.999%
- SLA penalties increase buyer leverage
- Referenceability drives vendor selection
- Risk-reduction supports premium pricing
Community banks limit vendor leverage; >5,000 clients, 12–36 mo swaps
Jack Henry faces moderate customer bargaining: >5,000 US community banks/credit unions (2024) limit single-buyer power, but coordinated groups extract features. Core switches take 12–36 months and often cost multi-million dollars, reducing churn. Buyers demand open APIs, 3–5 year contracts for discounts and 99.99%–99.999% uptime SLAs.
| Metric | 2024 |
|---|---|
| Client pool | >5,000 institutions |
| Switch time | 12–36 months |
| Switch cost | Multi-million USD |
| Contract length | 3–5 years |
| Uptime target | 99.99%–99.999% |
Preview Before You Purchase
Jack Henry Porter's Five Forces Analysis
This preview shows the exact Jack Henry Porter Five Forces Analysis you'll receive immediately after purchase—no surprises, no placeholders. The document displayed is the final, professionally formatted file, ready for download and immediate use. Once you buy, you'll get instant access to this identical, complete deliverable.
Original: $10.00
-65%$10.00
$3.50Description
From Overview to Strategy Blueprint
Jack Henry’s Porter's Five Forces snapshot assesses competitive rivalry, supplier and buyer power, substitute threats, and barriers to entry to reveal pressure points shaping margins and growth. It highlights fintech disruption and consolidation risks while noting client stickiness as a defensive asset. This brief only scratches the surface—unlock the full Porter's Five Forces Analysis for force-by-force ratings, visuals, and actionable strategy guidance.
Suppliers Bargaining Power
Core software dependencies
Jack Henry depends on major database, middleware and OS vendors (Oracle, Microsoft, Red Hat), whose licensing and support terms can sway costs and upgrade timelines; enterprise DBMS spending exceeded $80B globally in 2024, concentrating vendor leverage.
Multi-vendor strategies and long-term contracts mitigate concentration risk—over 65% of U.S. financial processors reported multi-sourcing core stacks in 2024—reducing single-vendor exposure.
Open standards and APIs further lower lock-in, enabling integrations and cloud portability that constrain supplier bargaining power.
Cloud and infrastructure providers
Migration to cloud increases Jack Henry’s exposure to hyperscalers that held ~67% of global cloud IaaS/PaaS market in 2024 (AWS ~33%, Azure ~23%, Google ~11%), concentrating supplier power for compute, storage and AI services. Pricing shifts, egress fees often ranging roughly $0.05–0.12/GB and reserved-instance or savings-plan commitments (discounts up to ~72%) can compress margins. Diversifying across providers and hybrid on-prem deployments mitigate dependence but add integration costs. Regulatory, compliance and 99.99%‑class uptime SLAs create customer stickiness while raising compliance and audit expenses.
Payments networks and rails
Interchange rules and network fees—typically 1.5–3.5% on card transactions in the US—plus ACH and real‑time rail charges materially shape Jack Henry unit economics, and major networks retain standard‑setting and pricing power. Jack Henry mitigates impact through scale, bank partnerships and routing optimization. New rails (RTP, FedNow launched 2023) broaden routing options but require integration and capital investment.
Data and risk content suppliers
Credit bureaus (Experian, Equifax, TransUnion) and KYC/AML and fraud-intel vendors are essential inputs for Jack Henry; the Big Three together dominate consumer credit data supply, creating significant supplier leverage. High data quality and national coverage boost top providers’ bargaining power, while Jack Henry reduces dependency via multi-sourcing and proprietary analytics and enforces quality with contractual SLAs and audit rights.
- Big Three dominance: ~90% of US consumer credit records
- Multi-sourcing: lowers single-vendor risk
- SLA + audit rights: contractual quality enforcement
- Proprietary analytics: reduces raw-data reliance
Specialized talent and contractors
Skilled fintech engineers, security experts, and compliance professionals remain scarce, with the 2024 ISC2 report estimating a global cybersecurity workforce gap around 3.4 million, strengthening supplier power. Wage inflation and retention incentives pushed tech compensation up—Glassdoor's 2024 median US software engineer base near 115,000—while remote work widened the pool and competition. Training pipelines and automation (DevSecOps, LLM-assisted coding) are slowly reducing pressure.
- 2024 ISC2 gap ~3.4M
- Glassdoor 2024 median SE base ≈115,000
- Remote work increases candidate pool and competition
- Training + automation = longer-term relief
Banking tech margins squeezed by hyperscaler egress, card fees, data monopolies and talent gap
Jack Henry faces concentrated supplier power from DB/OS vendors (enterprise DBMS spend >$80B in 2024) and hyperscalers holding ~67% IaaS/PaaS (AWS 33%, Azure 23%, Google 11%), impacting costs, egress fees ($0.05–0.12/GB) and margins. Card/rail fees (1.5–3.5%) and Big Three credit data (~90% US records) also exert pricing leverage. Talent shortages (ISC2 gap ~3.4M; median US SE base ~$115k in 2024) raise compensation pressure.
| Metric | 2024 Value |
|---|---|
| Enterprise DBMS spend | >$80B |
| Hyperscaler IaaS/PaaS share | ~67% (AWS 33%, Azure 23%, GCP 11%) |
| Typical egress fee | $0.05–0.12/GB |
| Card/network fees | 1.5–3.5% |
| Big Three credit data share | ~90% |
| Cyber workforce gap (ISC2) | ~3.4M |
| Median US software engineer base | ≈$115k |
What is included in the product
Detailed Word Document
Comprehensive Five Forces analysis of Jack Henry uncovering competitive intensity, buyer and supplier power, entry barriers, substitution risks, and strategic levers to protect market share.
Customizable Excel Spreadsheet
Clear, one-sheet Jack Henry Porter Five Forces summary that instantly pinpoints competitive pain points with an interactive spider chart and customizable pressure levels for scenario testing.
Customers Bargaining Power
Fragmented community FI base
Jack Henry’s client base is drawn from a fragmented pool of over 5,000 community banks and credit unions in the US as of 2024, meaning buyers are numerous but individually small, limiting single-buyer leverage. Coordinated user groups and cooperatives still exert organized pressure to prioritize feature requests and integrations. The vendor offsets fragmentation with volume-based pricing tiers and modular SaaS bundles calibrated to institution size. This structure keeps customer bargaining power moderate rather than dominant.
High switching costs
Core conversions are risky, costly and time-consuming for financial institutions, often taking 12–36 months and costing multiple millions for mid-sized banks due to data migration, retraining and regulatory revalidation. These hurdles materially deter switching and reduce buyer price sensitivity once a provider is embedded. Competitive bids still occur at renewal cycles, especially where cost pressures or functionality gaps emerge.
Demand for integration and openness
Buyers increasingly require open APIs and best-of-breed integration, empowering negotiations for interoperability and lower vendor lock-in. Jack Henry’s open-banking posture and API-first platform align with 2024 regulatory and market expectations across the EU, UK and expanding APAC/LATAM implementations. Failure to integrate typically forces concessions or raises measurable churn risk for core vendors.
Price sensitivity in tight NIM cycles
Bargaining power rises as tight NIMs push banks to demand bundled discounts and cost efficiencies; outcome-based pricing and modular packaging are now core negotiation levers, with buyers using RFPs to extract margin relief and service guarantees. Multi-year commitments, typically 3–5 years, commonly trade deeper discounts for revenue certainty.
- Price pressure: bundled discounts
- Negotiation levers: outcome-based pricing
- Buyer tactics: RFP-driven value extraction
- Deal dynamics: 3–5 year commitments for bigger discounts
Compliance and uptime expectations
Zero-tolerance for outages and regulatory missteps pushes buyers to demand 99.99%–99.999% uptime (52.6 to 5.26 minutes downtime/year), shifting power via stringent SLAs and penalties; referenceability and exam readiness are decisive buying criteria, allowing trusted vendors to justify premium pricing for risk reduction and faster regulatory sign-off.
- Uptime targets: 99.99%–99.999%
- SLA penalties increase buyer leverage
- Referenceability drives vendor selection
- Risk-reduction supports premium pricing
Community banks limit vendor leverage; >5,000 clients, 12–36 mo swaps
Jack Henry faces moderate customer bargaining: >5,000 US community banks/credit unions (2024) limit single-buyer power, but coordinated groups extract features. Core switches take 12–36 months and often cost multi-million dollars, reducing churn. Buyers demand open APIs, 3–5 year contracts for discounts and 99.99%–99.999% uptime SLAs.
| Metric | 2024 |
|---|---|
| Client pool | >5,000 institutions |
| Switch time | 12–36 months |
| Switch cost | Multi-million USD |
| Contract length | 3–5 years |
| Uptime target | 99.99%–99.999% |
Preview Before You Purchase
Jack Henry Porter's Five Forces Analysis
This preview shows the exact Jack Henry Porter Five Forces Analysis you'll receive immediately after purchase—no surprises, no placeholders. The document displayed is the final, professionally formatted file, ready for download and immediate use. Once you buy, you'll get instant access to this identical, complete deliverable.











