Jack Business Model Canvas

Unlock the strategic blueprint behind a winning Business Model Canvas for growth and revenue
Unlock the full strategic blueprint behind Jack’s business model and see exactly how it creates value, scales, and wins customers. This in-depth Business Model Canvas breaks down customer segments, value propositions, channels, revenue streams, and cost structure. Ideal for entrepreneurs, investors, and consultants seeking actionable insight. Purchase the full Canvas to download editable Word and Excel files for immediate use.
Partnerships

Franchisee Operators
Franchisee operators expand Jack's geographic reach by providing local execution and capital, enabling faster unit growth while bearing development costs. They run day-to-day restaurants under brand standards and remit royalties and fees, commonly in the 4–6% of sales range. Ongoing collaboration includes training, QA audits and performance programs; co-investment in remodels and new units (often $100k–$500k per unit) aligns incentives.
Food, Beverage, and Packaging Suppliers
Suppliers deliver proteins, produce, bakery, beverages, sauces and disposables at scale to support Jack’s SKU breadth. Strategic sourcing via long-term contracts and financial hedging secures quality, safety and price stability; restaurant food cost typically runs 28–35% of revenue. Co-development of new SKUs with suppliers accelerates menu innovation and margin uplift. Logistics partners preserve cold-chain integrity and ensure on-time delivery to minimize spoilage.

Delivery Aggregators
Partnerships with major delivery apps extend Jack beyond the drive-thru, tapping platforms where DoorDash held about 58% US market share in 2024; integrations enable menu sync, dynamic pricing and order throttling to protect throughput; joint promotions lift peak and late-night trial, often boosting delivery sales 20–30%; shared data sharpens demand forecasts and targeted promo ROI.

Technology and Payments Vendors
Technology and payments vendors—POS, loyalty, mobile ordering and drive-thru tech—drive speed and accuracy across Jack locations, while payment gateways and fraud tools enable secure, low-friction checkout; 2024 industry SLAs commonly target 99.9% uptime to cut downtime and revenue loss. Data platforms power analytics, personalization and A/B testing to lift average check and retention.
- POS accuracy
- Mobile ordering
- Drive-thru tech
- Payment gateways
- Fraud tools
- Data & A/B testing
- 99.9% SLA
Real Estate Owners and Developers
Landlords and developers secure high-traffic, drive-thru-friendly sites critical to Jack’s expansion; build-to-suit and 10–15 year lease agreements optimize capital and accelerate openings. Municipal permitting partners (60–120 day typical approval windows in 2024) ease zoning and signage hurdles, while remodel and retrofit contractors enforce brand standards and reduce rework.
- Drive-thru sites: priority
- Lease terms: 10–15 years
- Permit timelines: 60–120 days (2024)
- Contractors: retrofit & brand compliance
Franchisees fund growth; 4–6% royalties; delivery leader 58%
Franchisees drive unit growth and bear development costs, paying 4–6% royalties and co‑investing $100k–$500k per unit. Suppliers and logistics control 28–35% food cost and enable SKU innovation. Delivery apps (DoorDash ~58% US share in 2024) lift delivery sales 20–30%. Tech vendors target 99.9% uptime to protect throughput and AOV.
| Partner | Key metric |
|---|---|
| Franchise | 4–6% royalty; $100k–$500k |
| Suppliers | 28–35% food cost |
| Delivery | DoorDash 58%; +20–30% sales |
| Tech | 99.9% SLA |
What is included in the product
 Detailed Word Document
A comprehensive, pre-written Jack Business Model Canvas organized into the 9 classic BMC blocks with full narrative, insights, and competitive-advantage analysis. Ideal for presentations, funding discussions, and validation of business ideas, it links SWOT elements to each block and reflects real-world operations to help entrepreneurs and analysts make informed decisions.

 Customizable Excel Spreadsheet
Streamlines capture of core business elements into an editable one‑page canvas, saving hours of formatting while enabling quick comparisons, team collaboration and fast deliverables for decision-making.
Activities

Restaurant Operations Excellence
Execute speed-of-service, food safety, and order accuracy daily, targeting industry drive-thru benchmarks under 3.5 minutes and order accuracy above 99%. Manage labor to hit 25–30% labor cost of sales across dayparts and demand peaks. Maintain equipment and cleanliness to meet FDA/FSMA standards and keep downtime below 2%. Monitor KPIs like drive-thru times, average check (~$9 in 2024), and unit sales.
Menu Innovation and LTOs
Develop new burgers, chicken, tacos and breakfast items to drive traffic, targeting menu mixes that lifted comparable QSR traffic 4–8% during LTOs in 2024 (Technomic). Test and iterate Limited-Time Offers to create news and pricing power while monitoring AUV and margin impact. Balance craveability with operational simplicity and margin targets, using guest insights and purchase data to refine flavor profiles and bundle offers for higher attach rates.

Franchise Support and Compliance
Provide training, playbooks and field ops coaching to franchisees, with standardized onboarding and ongoing modules tied to quarterly audits; franchising contributed about 3% of US GDP and supported roughly 7.6 million jobs in 2024. Audit for brand standards, safety and food quality and share best practices on labor, waste and throughput to protect margins. Align incentives via scorecards and targeted remodel programs linked to KPI improvements.

Digital and Loyalty Growth
Enhance mobile app, web ordering and personalization to push digital penetration above 50% of sales in 2024; run CRM campaigns, targeted offers and gamified rewards to raise visit frequency 10–15%; optimize delivery menus and channel pricing to protect margins; integrate POS, app and aggregator data for unified customer insights and A/B pricing.
- Mobile app & web upgrades
- CRM campaigns & gamified rewards
- Channel pricing & delivery menu optimization
- POS–app–aggregator data integration
Supply Chain and Procurement
Source ingredients and packaging balancing cost and quality—food cost typically runs 30–35% of sales—while securing continuity through multi-sourcing and contract terms. Manage vendors, contracts, insurance and contingency plans to mitigate supplier risk and lead-time variability. Use demand forecasting (inventory turnover for FMCG often 8–12x/year) to cut stockouts and waste and coordinate distribution for timely new product launches.
- Cost focus: food cost 30–35% of sales
- Continuity: multi-sourcing and contracts
- Efficiency: inventory turnover 8–12x/year
- Launch support: synchronized distribution
Drive‑thru ≤ 3.5 min, order accuracy > 99%, digital > 50%, avg check $9
Operate to 3.5min drive‑thru, >99% order accuracy and 25–30% labor cost; average check ~$9 (2024). Push digital >50% sales, CRM/gamified offers to lift frequency 10–15% and protect AUV. Manage food cost 30–35%, multi-source supply and inventory turnover 8–12x to support LTOs and margin targets.
| Metric | Target / 2024 |
|---|---|
| Drive‑thru time | <3.5 min |
| Order accuracy | >99% |
| Labor | 25–30% sales |
| Avg check | $9 |
| Digital sales | >50% |
| Food cost | 30–35% |
| Inventory TO | 8–12x/yr |
Full Document Unlocks After Purchase
Business Model Canvas
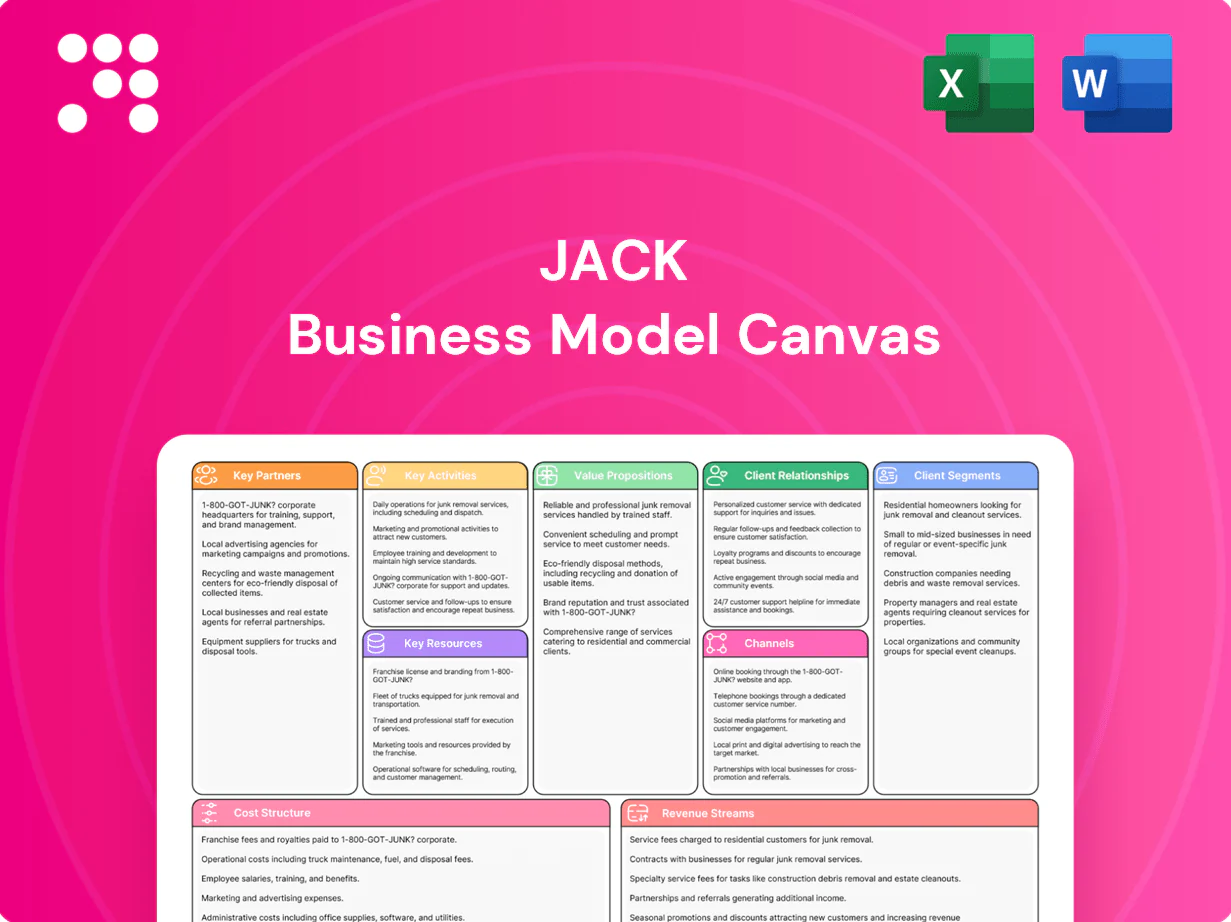
The Jack Business Model Canvas preview you see is the actual document you’ll receive—this is not a mockup or sample. Upon purchase you’ll get the complete, fully editable file formatted exactly as shown, ready for presentation or customization. No surprises—what you preview is what you’ll own.

Unlock the strategic blueprint behind a winning Business Model Canvas for growth and revenue
Unlock the full strategic blueprint behind Jack’s business model and see exactly how it creates value, scales, and wins customers. This in-depth Business Model Canvas breaks down customer segments, value propositions, channels, revenue streams, and cost structure. Ideal for entrepreneurs, investors, and consultants seeking actionable insight. Purchase the full Canvas to download editable Word and Excel files for immediate use.
Partnerships
Franchisee Operators
Franchisee operators expand Jack's geographic reach by providing local execution and capital, enabling faster unit growth while bearing development costs. They run day-to-day restaurants under brand standards and remit royalties and fees, commonly in the 4–6% of sales range. Ongoing collaboration includes training, QA audits and performance programs; co-investment in remodels and new units (often $100k–$500k per unit) aligns incentives.
Food, Beverage, and Packaging Suppliers
Suppliers deliver proteins, produce, bakery, beverages, sauces and disposables at scale to support Jack’s SKU breadth. Strategic sourcing via long-term contracts and financial hedging secures quality, safety and price stability; restaurant food cost typically runs 28–35% of revenue. Co-development of new SKUs with suppliers accelerates menu innovation and margin uplift. Logistics partners preserve cold-chain integrity and ensure on-time delivery to minimize spoilage.
Delivery Aggregators
Partnerships with major delivery apps extend Jack beyond the drive-thru, tapping platforms where DoorDash held about 58% US market share in 2024; integrations enable menu sync, dynamic pricing and order throttling to protect throughput; joint promotions lift peak and late-night trial, often boosting delivery sales 20–30%; shared data sharpens demand forecasts and targeted promo ROI.
Technology and Payments Vendors
Technology and payments vendors—POS, loyalty, mobile ordering and drive-thru tech—drive speed and accuracy across Jack locations, while payment gateways and fraud tools enable secure, low-friction checkout; 2024 industry SLAs commonly target 99.9% uptime to cut downtime and revenue loss. Data platforms power analytics, personalization and A/B testing to lift average check and retention.
- POS accuracy
- Mobile ordering
- Drive-thru tech
- Payment gateways
- Fraud tools
- Data & A/B testing
- 99.9% SLA
Real Estate Owners and Developers
Landlords and developers secure high-traffic, drive-thru-friendly sites critical to Jack’s expansion; build-to-suit and 10–15 year lease agreements optimize capital and accelerate openings. Municipal permitting partners (60–120 day typical approval windows in 2024) ease zoning and signage hurdles, while remodel and retrofit contractors enforce brand standards and reduce rework.
- Drive-thru sites: priority
- Lease terms: 10–15 years
- Permit timelines: 60–120 days (2024)
- Contractors: retrofit & brand compliance
Franchisees fund growth; 4–6% royalties; delivery leader 58%
Franchisees drive unit growth and bear development costs, paying 4–6% royalties and co‑investing $100k–$500k per unit. Suppliers and logistics control 28–35% food cost and enable SKU innovation. Delivery apps (DoorDash ~58% US share in 2024) lift delivery sales 20–30%. Tech vendors target 99.9% uptime to protect throughput and AOV.
| Partner | Key metric |
|---|---|
| Franchise | 4–6% royalty; $100k–$500k |
| Suppliers | 28–35% food cost |
| Delivery | DoorDash 58%; +20–30% sales |
| Tech | 99.9% SLA |
What is included in the product
Detailed Word Document
A comprehensive, pre-written Jack Business Model Canvas organized into the 9 classic BMC blocks with full narrative, insights, and competitive-advantage analysis. Ideal for presentations, funding discussions, and validation of business ideas, it links SWOT elements to each block and reflects real-world operations to help entrepreneurs and analysts make informed decisions.
Customizable Excel Spreadsheet
Streamlines capture of core business elements into an editable one‑page canvas, saving hours of formatting while enabling quick comparisons, team collaboration and fast deliverables for decision-making.
Activities
Restaurant Operations Excellence
Execute speed-of-service, food safety, and order accuracy daily, targeting industry drive-thru benchmarks under 3.5 minutes and order accuracy above 99%. Manage labor to hit 25–30% labor cost of sales across dayparts and demand peaks. Maintain equipment and cleanliness to meet FDA/FSMA standards and keep downtime below 2%. Monitor KPIs like drive-thru times, average check (~$9 in 2024), and unit sales.
Menu Innovation and LTOs
Develop new burgers, chicken, tacos and breakfast items to drive traffic, targeting menu mixes that lifted comparable QSR traffic 4–8% during LTOs in 2024 (Technomic). Test and iterate Limited-Time Offers to create news and pricing power while monitoring AUV and margin impact. Balance craveability with operational simplicity and margin targets, using guest insights and purchase data to refine flavor profiles and bundle offers for higher attach rates.
Franchise Support and Compliance
Provide training, playbooks and field ops coaching to franchisees, with standardized onboarding and ongoing modules tied to quarterly audits; franchising contributed about 3% of US GDP and supported roughly 7.6 million jobs in 2024. Audit for brand standards, safety and food quality and share best practices on labor, waste and throughput to protect margins. Align incentives via scorecards and targeted remodel programs linked to KPI improvements.
Digital and Loyalty Growth
Enhance mobile app, web ordering and personalization to push digital penetration above 50% of sales in 2024; run CRM campaigns, targeted offers and gamified rewards to raise visit frequency 10–15%; optimize delivery menus and channel pricing to protect margins; integrate POS, app and aggregator data for unified customer insights and A/B pricing.
- Mobile app & web upgrades
- CRM campaigns & gamified rewards
- Channel pricing & delivery menu optimization
- POS–app–aggregator data integration
Supply Chain and Procurement
Source ingredients and packaging balancing cost and quality—food cost typically runs 30–35% of sales—while securing continuity through multi-sourcing and contract terms. Manage vendors, contracts, insurance and contingency plans to mitigate supplier risk and lead-time variability. Use demand forecasting (inventory turnover for FMCG often 8–12x/year) to cut stockouts and waste and coordinate distribution for timely new product launches.
- Cost focus: food cost 30–35% of sales
- Continuity: multi-sourcing and contracts
- Efficiency: inventory turnover 8–12x/year
- Launch support: synchronized distribution
Drive‑thru ≤ 3.5 min, order accuracy > 99%, digital > 50%, avg check $9
Operate to 3.5min drive‑thru, >99% order accuracy and 25–30% labor cost; average check ~$9 (2024). Push digital >50% sales, CRM/gamified offers to lift frequency 10–15% and protect AUV. Manage food cost 30–35%, multi-source supply and inventory turnover 8–12x to support LTOs and margin targets.
| Metric | Target / 2024 |
|---|---|
| Drive‑thru time | <3.5 min |
| Order accuracy | >99% |
| Labor | 25–30% sales |
| Avg check | $9 |
| Digital sales | >50% |
| Food cost | 30–35% |
| Inventory TO | 8–12x/yr |
Full Document Unlocks After Purchase
Business Model Canvas
The Jack Business Model Canvas preview you see is the actual document you’ll receive—this is not a mockup or sample. Upon purchase you’ll get the complete, fully editable file formatted exactly as shown, ready for presentation or customization. No surprises—what you preview is what you’ll own.
Original: $10.00
-65%$10.00
$3.50Description
Unlock the strategic blueprint behind a winning Business Model Canvas for growth and revenue
Unlock the full strategic blueprint behind Jack’s business model and see exactly how it creates value, scales, and wins customers. This in-depth Business Model Canvas breaks down customer segments, value propositions, channels, revenue streams, and cost structure. Ideal for entrepreneurs, investors, and consultants seeking actionable insight. Purchase the full Canvas to download editable Word and Excel files for immediate use.
Partnerships
Franchisee Operators
Franchisee operators expand Jack's geographic reach by providing local execution and capital, enabling faster unit growth while bearing development costs. They run day-to-day restaurants under brand standards and remit royalties and fees, commonly in the 4–6% of sales range. Ongoing collaboration includes training, QA audits and performance programs; co-investment in remodels and new units (often $100k–$500k per unit) aligns incentives.
Food, Beverage, and Packaging Suppliers
Suppliers deliver proteins, produce, bakery, beverages, sauces and disposables at scale to support Jack’s SKU breadth. Strategic sourcing via long-term contracts and financial hedging secures quality, safety and price stability; restaurant food cost typically runs 28–35% of revenue. Co-development of new SKUs with suppliers accelerates menu innovation and margin uplift. Logistics partners preserve cold-chain integrity and ensure on-time delivery to minimize spoilage.
Delivery Aggregators
Partnerships with major delivery apps extend Jack beyond the drive-thru, tapping platforms where DoorDash held about 58% US market share in 2024; integrations enable menu sync, dynamic pricing and order throttling to protect throughput; joint promotions lift peak and late-night trial, often boosting delivery sales 20–30%; shared data sharpens demand forecasts and targeted promo ROI.
Technology and Payments Vendors
Technology and payments vendors—POS, loyalty, mobile ordering and drive-thru tech—drive speed and accuracy across Jack locations, while payment gateways and fraud tools enable secure, low-friction checkout; 2024 industry SLAs commonly target 99.9% uptime to cut downtime and revenue loss. Data platforms power analytics, personalization and A/B testing to lift average check and retention.
- POS accuracy
- Mobile ordering
- Drive-thru tech
- Payment gateways
- Fraud tools
- Data & A/B testing
- 99.9% SLA
Real Estate Owners and Developers
Landlords and developers secure high-traffic, drive-thru-friendly sites critical to Jack’s expansion; build-to-suit and 10–15 year lease agreements optimize capital and accelerate openings. Municipal permitting partners (60–120 day typical approval windows in 2024) ease zoning and signage hurdles, while remodel and retrofit contractors enforce brand standards and reduce rework.
- Drive-thru sites: priority
- Lease terms: 10–15 years
- Permit timelines: 60–120 days (2024)
- Contractors: retrofit & brand compliance
Franchisees fund growth; 4–6% royalties; delivery leader 58%
Franchisees drive unit growth and bear development costs, paying 4–6% royalties and co‑investing $100k–$500k per unit. Suppliers and logistics control 28–35% food cost and enable SKU innovation. Delivery apps (DoorDash ~58% US share in 2024) lift delivery sales 20–30%. Tech vendors target 99.9% uptime to protect throughput and AOV.
| Partner | Key metric |
|---|---|
| Franchise | 4–6% royalty; $100k–$500k |
| Suppliers | 28–35% food cost |
| Delivery | DoorDash 58%; +20–30% sales |
| Tech | 99.9% SLA |
What is included in the product
Detailed Word Document
A comprehensive, pre-written Jack Business Model Canvas organized into the 9 classic BMC blocks with full narrative, insights, and competitive-advantage analysis. Ideal for presentations, funding discussions, and validation of business ideas, it links SWOT elements to each block and reflects real-world operations to help entrepreneurs and analysts make informed decisions.
Customizable Excel Spreadsheet
Streamlines capture of core business elements into an editable one‑page canvas, saving hours of formatting while enabling quick comparisons, team collaboration and fast deliverables for decision-making.
Activities
Restaurant Operations Excellence
Execute speed-of-service, food safety, and order accuracy daily, targeting industry drive-thru benchmarks under 3.5 minutes and order accuracy above 99%. Manage labor to hit 25–30% labor cost of sales across dayparts and demand peaks. Maintain equipment and cleanliness to meet FDA/FSMA standards and keep downtime below 2%. Monitor KPIs like drive-thru times, average check (~$9 in 2024), and unit sales.
Menu Innovation and LTOs
Develop new burgers, chicken, tacos and breakfast items to drive traffic, targeting menu mixes that lifted comparable QSR traffic 4–8% during LTOs in 2024 (Technomic). Test and iterate Limited-Time Offers to create news and pricing power while monitoring AUV and margin impact. Balance craveability with operational simplicity and margin targets, using guest insights and purchase data to refine flavor profiles and bundle offers for higher attach rates.
Franchise Support and Compliance
Provide training, playbooks and field ops coaching to franchisees, with standardized onboarding and ongoing modules tied to quarterly audits; franchising contributed about 3% of US GDP and supported roughly 7.6 million jobs in 2024. Audit for brand standards, safety and food quality and share best practices on labor, waste and throughput to protect margins. Align incentives via scorecards and targeted remodel programs linked to KPI improvements.
Digital and Loyalty Growth
Enhance mobile app, web ordering and personalization to push digital penetration above 50% of sales in 2024; run CRM campaigns, targeted offers and gamified rewards to raise visit frequency 10–15%; optimize delivery menus and channel pricing to protect margins; integrate POS, app and aggregator data for unified customer insights and A/B pricing.
- Mobile app & web upgrades
- CRM campaigns & gamified rewards
- Channel pricing & delivery menu optimization
- POS–app–aggregator data integration
Supply Chain and Procurement
Source ingredients and packaging balancing cost and quality—food cost typically runs 30–35% of sales—while securing continuity through multi-sourcing and contract terms. Manage vendors, contracts, insurance and contingency plans to mitigate supplier risk and lead-time variability. Use demand forecasting (inventory turnover for FMCG often 8–12x/year) to cut stockouts and waste and coordinate distribution for timely new product launches.
- Cost focus: food cost 30–35% of sales
- Continuity: multi-sourcing and contracts
- Efficiency: inventory turnover 8–12x/year
- Launch support: synchronized distribution
Drive‑thru ≤ 3.5 min, order accuracy > 99%, digital > 50%, avg check $9
Operate to 3.5min drive‑thru, >99% order accuracy and 25–30% labor cost; average check ~$9 (2024). Push digital >50% sales, CRM/gamified offers to lift frequency 10–15% and protect AUV. Manage food cost 30–35%, multi-source supply and inventory turnover 8–12x to support LTOs and margin targets.
| Metric | Target / 2024 |
|---|---|
| Drive‑thru time | <3.5 min |
| Order accuracy | >99% |
| Labor | 25–30% sales |
| Avg check | $9 |
| Digital sales | >50% |
| Food cost | 30–35% |
| Inventory TO | 8–12x/yr |
Full Document Unlocks After Purchase
Business Model Canvas
The Jack Business Model Canvas preview you see is the actual document you’ll receive—this is not a mockup or sample. Upon purchase you’ll get the complete, fully editable file formatted exactly as shown, ready for presentation or customization. No surprises—what you preview is what you’ll own.











