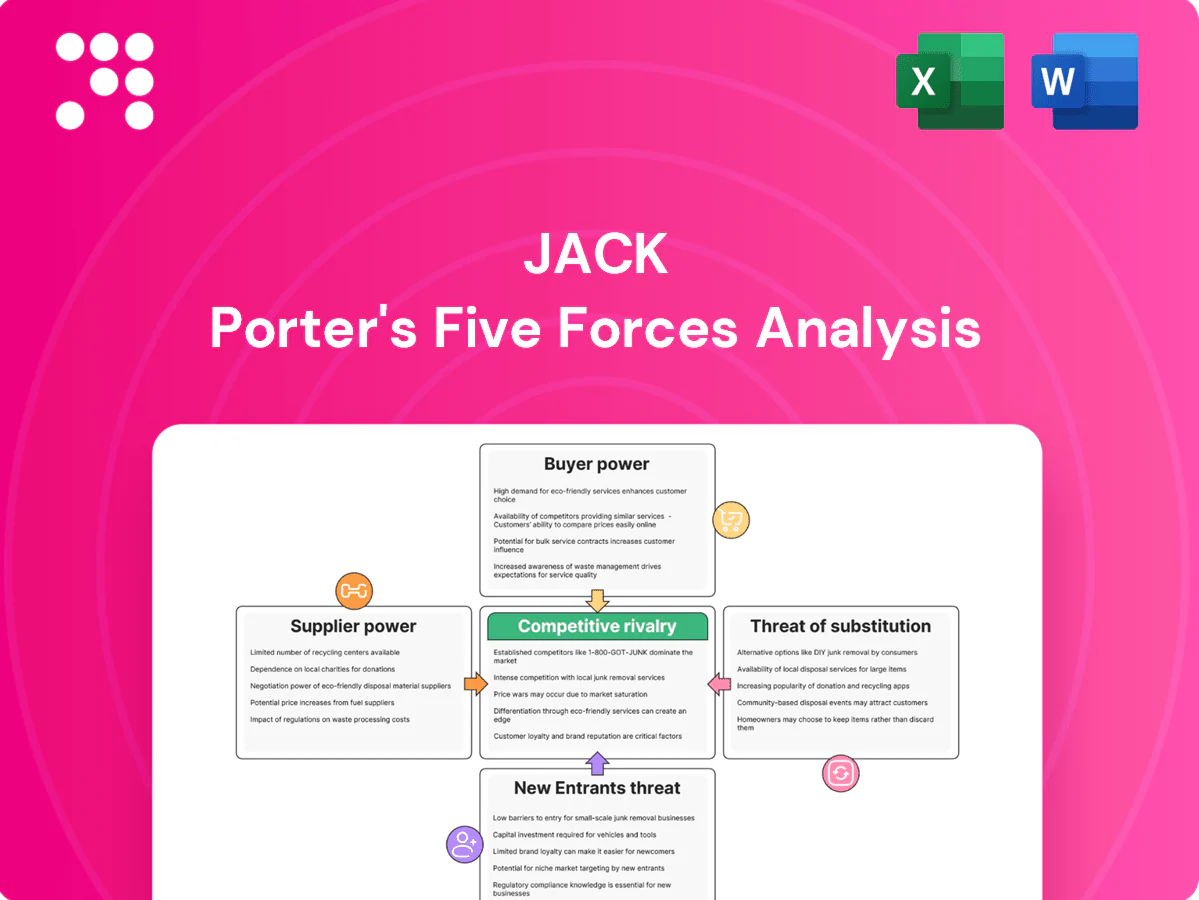
Jack Porter's Five Forces Analysis

Don't Miss the Bigger Picture
Jack Porter's Five Forces Analysis distills competitive rivalry, supplier and buyer power, and the threats of new entrants and substitutes into a clear strategic snapshot. This brief snapshot only scratches the surface—unlock the full Porter's Five Forces Analysis to explore Jack’s competitive dynamics, market pressures, and strategic advantages in detail. Get a consultant-grade report with force-by-force ratings, visuals, and actionable implications for investment or strategy.
Suppliers Bargaining Power

Commodity volatility
Jack in the Box relies on beef, chicken, dairy and produce prone to commodity swings; with about 2,200 restaurants, sudden protein or oil price spikes can quickly compress margins if menu prices lag. Supply contracts and limited hedging reduce but do not eliminate volatility. Weather, disease and geopolitical shocks tightened supply and boosted supplier leverage during 2024 procurement disruptions.
Supplier concentration
Large distributors and protein processors exhibit strong scale advantages: the top four US beef packers held roughly 85% of steer slaughter capacity in 2023–24, while Sysco and US Foods together account for about 60% of foodservice distribution. Concentrated approved-vendor lists can extend switching and qualification lead times often to 3–12 months, raising supplier power. Geographic clustering in the West and South concentrates dependence on key hubs. Diversifying or dual-sourcing lowers concentration risk but typically increases coordination and logistics complexity and cost.

Quality and specs
Menu consistency forces tight specs for patties, buns, sauces and packaging, shrinking the pool of compliant suppliers and raising reliance on certified partners; in 2024 many QSRs reported food cost pressures near 30% of sales, amplifying supplier leverage. Proprietary SKUs and specialized packaging often create contractual lock‑ins that increase supplier influence, while standardized inputs still allow periodic rebids. Robust QA programs impose high changeover costs, disciplining suppliers but making switching costly and slow.

Logistics and delivery
Cold-chain reliability and on-time distribution are critical for drive-thru speed and food safety; in 2024 regional distribution partners with high route density commanded contract premiums of roughly 5–12%, strengthening supplier leverage. Rising logistics costs—diesel averaged about $3.80/gal in 2024—plus labor can be passed through to restaurants. Disruptions ripple quickly across franchisees, harming throughput and NPS.
- tag: cold-chain critical
- tag: route-density leverage
- tag: fuel/labor passthrough
- tag: disruption ripple
Beverage and equipment
Fountain beverage agreements and kitchen equipment vendors exert notable supplier power: exclusivity and service contracts (commonly 1–3 years) lock operators into Coca-Cola/Pepsi systems, while capital items like fryers ($2k–$10k), grills and POS terminals ($3k–$8k) create switching friction; volume rebates (typically 1–4%) offset costs but tether supply relationships, and service-level failures can reduce throughput, raising suppliers' implicit leverage.
- Exclusivity: 1–3 year contracts
- Capex: fryers $2k–$10k, POS $3k–$8k
- Rebates: ~1–4%
- Risk: service failures → reduced throughput
Supplier concentration: top 4 beef ~85%, distros ~60%, diesel $3.80/gal
Suppliers hold moderate‑to‑high power: protein and produce volatility (2024 beef packer top‑4 ~85% capacity) and concentrated distributors (Sysco+US Foods ~60%) can compress margins; fuel averaged $3.80/gal in 2024 raising logistics pass‑throughs. Exclusive beverage/equipment contracts (1–3 yr) and specialized SKUs increase switching costs despite 1–4% volume rebates.
| Metric | 2024 |
|---|---|
| Top‑4 beef packer share | ~85% |
| Sysco+US Foods | ~60% |
| Diesel avg | $3.80/gal |
| Volume rebates | 1–4% |
What is included in the product
 Detailed Word Document
Uncovers key drivers of competition, buyer and supplier power, and entry or substitute threats facing Jack Porter, with strategic commentary on implications for pricing, margins, and market positioning.

 Customizable Excel Spreadsheet
A one-sheet Five Forces summary that turns complex competitive dynamics into actionable priorities—editable pressure levels, radar visualization and slide-ready layout for rapid decision-making and seamless integration into reports.
Customers Bargaining Power

Low switching costs
Customers can choose among many quick-service alternatives within minutes, and with low monetary or time costs to switch, price and convenience dominate purchase decisions. Promotions by rivals and delivery/platform offers in 2024 continue to rapidly redirect footfall and orders. Loyalty programs improve retention but industry data show limited long-term lock-in, keeping customer bargaining power high.
Price sensitivity
Value menus and combo pricing anchor demand in budget-conscious segments, with 2024 BLS data showing food-away-from-home prices up about 4.9% year-over-year, pushing more shoppers toward discounts or at-home meals. Small price moves can quickly shift purchase mix and visit frequency, as customers trade down for perceived value. Clear, quantified value communication is critical to defend traffic and margins.

Convenience expectations
Drive-thru speed, late-night availability and seamless digital ordering now define perceived value; delays or inaccuracies trigger immediate churn to nearby options. Delivery platforms expand reach but levy 15–30% commissions (2024) and amplify price comparisons. Consistent execution and uptime are the primary hedge against rising buyer power.

Variety and taste
Customers now expect diverse options—burgers, chicken, tacos and breakfast—with fast service; 2024 surveys show about 72% of diners prioritize variety, and LTOs deliver roughly a 6% average sales lift but increase operational complexity and costs. Novel items drive trial, yet studies indicate only about 35% of trials convert to repeat visits if taste falls short, and rival innovations push continuous benchmarking.
- Variety demand: 72% (2024)
- LTO sales lift: ~6% (2024)
- Trial-to-repeat risk: ~35% retention
- Competitive pressure: rising menu innovation
Digital transparency
Apps and delivery marketplaces reveal cross-brand pricing and reviews in real time, and BrightLocal 2024 found 87% of consumers read online reviews; negative ratings can cut conversion and amplify buyer power. Dynamic promos recover traffic but compress margins, while data-driven personalization raises AOV and counters pure price shopping.
- Real-time pricing/reviews
- 87% read reviews (BrightLocal 2024)
- Promos boost traffic, lower margin
- Personalization increases AOV
Delivery fees 15–30%, reviews 87% drive margin squeeze
Customers wield high bargaining power: low switching costs, price-led choices and delivery/platform dynamics (commissions 15–30% in 2024) rapidly shift demand. Value menus and promos, against food-away-from-home inflation ~4.9% YoY (BLS 2024), drive trade-downs. Digital reviews (87% read reviews, BrightLocal 2024) and demand for variety (72%) force constant innovation and margin pressure.
| Metric | 2024 |
|---|---|
| Delivery commissions | 15–30% |
| Food-away-from-home CPI | +4.9% YoY |
| Read reviews | 87% |
| Variety demand | 72% |
| LTO sales lift | ~6% |
| Trial→repeat | ~35% |
Preview the Actual Deliverable
Jack Porter's Five Forces Analysis
This preview shows the exact Jack Porter's Five Forces Analysis you'll receive—no mockups or placeholders. It's the complete, professionally formatted document, ready for immediate download and use upon purchase. What you see is precisely the file you'll get, instantly accessible.

Don't Miss the Bigger Picture
Jack Porter's Five Forces Analysis distills competitive rivalry, supplier and buyer power, and the threats of new entrants and substitutes into a clear strategic snapshot. This brief snapshot only scratches the surface—unlock the full Porter's Five Forces Analysis to explore Jack’s competitive dynamics, market pressures, and strategic advantages in detail. Get a consultant-grade report with force-by-force ratings, visuals, and actionable implications for investment or strategy.
Suppliers Bargaining Power
Commodity volatility
Jack in the Box relies on beef, chicken, dairy and produce prone to commodity swings; with about 2,200 restaurants, sudden protein or oil price spikes can quickly compress margins if menu prices lag. Supply contracts and limited hedging reduce but do not eliminate volatility. Weather, disease and geopolitical shocks tightened supply and boosted supplier leverage during 2024 procurement disruptions.
Supplier concentration
Large distributors and protein processors exhibit strong scale advantages: the top four US beef packers held roughly 85% of steer slaughter capacity in 2023–24, while Sysco and US Foods together account for about 60% of foodservice distribution. Concentrated approved-vendor lists can extend switching and qualification lead times often to 3–12 months, raising supplier power. Geographic clustering in the West and South concentrates dependence on key hubs. Diversifying or dual-sourcing lowers concentration risk but typically increases coordination and logistics complexity and cost.
Quality and specs
Menu consistency forces tight specs for patties, buns, sauces and packaging, shrinking the pool of compliant suppliers and raising reliance on certified partners; in 2024 many QSRs reported food cost pressures near 30% of sales, amplifying supplier leverage. Proprietary SKUs and specialized packaging often create contractual lock‑ins that increase supplier influence, while standardized inputs still allow periodic rebids. Robust QA programs impose high changeover costs, disciplining suppliers but making switching costly and slow.
Logistics and delivery
Cold-chain reliability and on-time distribution are critical for drive-thru speed and food safety; in 2024 regional distribution partners with high route density commanded contract premiums of roughly 5–12%, strengthening supplier leverage. Rising logistics costs—diesel averaged about $3.80/gal in 2024—plus labor can be passed through to restaurants. Disruptions ripple quickly across franchisees, harming throughput and NPS.
- tag: cold-chain critical
- tag: route-density leverage
- tag: fuel/labor passthrough
- tag: disruption ripple
Beverage and equipment
Fountain beverage agreements and kitchen equipment vendors exert notable supplier power: exclusivity and service contracts (commonly 1–3 years) lock operators into Coca-Cola/Pepsi systems, while capital items like fryers ($2k–$10k), grills and POS terminals ($3k–$8k) create switching friction; volume rebates (typically 1–4%) offset costs but tether supply relationships, and service-level failures can reduce throughput, raising suppliers' implicit leverage.
- Exclusivity: 1–3 year contracts
- Capex: fryers $2k–$10k, POS $3k–$8k
- Rebates: ~1–4%
- Risk: service failures → reduced throughput
Supplier concentration: top 4 beef ~85%, distros ~60%, diesel $3.80/gal
Suppliers hold moderate‑to‑high power: protein and produce volatility (2024 beef packer top‑4 ~85% capacity) and concentrated distributors (Sysco+US Foods ~60%) can compress margins; fuel averaged $3.80/gal in 2024 raising logistics pass‑throughs. Exclusive beverage/equipment contracts (1–3 yr) and specialized SKUs increase switching costs despite 1–4% volume rebates.
| Metric | 2024 |
|---|---|
| Top‑4 beef packer share | ~85% |
| Sysco+US Foods | ~60% |
| Diesel avg | $3.80/gal |
| Volume rebates | 1–4% |
What is included in the product
Detailed Word Document
Uncovers key drivers of competition, buyer and supplier power, and entry or substitute threats facing Jack Porter, with strategic commentary on implications for pricing, margins, and market positioning.
Customizable Excel Spreadsheet
A one-sheet Five Forces summary that turns complex competitive dynamics into actionable priorities—editable pressure levels, radar visualization and slide-ready layout for rapid decision-making and seamless integration into reports.
Customers Bargaining Power
Low switching costs
Customers can choose among many quick-service alternatives within minutes, and with low monetary or time costs to switch, price and convenience dominate purchase decisions. Promotions by rivals and delivery/platform offers in 2024 continue to rapidly redirect footfall and orders. Loyalty programs improve retention but industry data show limited long-term lock-in, keeping customer bargaining power high.
Price sensitivity
Value menus and combo pricing anchor demand in budget-conscious segments, with 2024 BLS data showing food-away-from-home prices up about 4.9% year-over-year, pushing more shoppers toward discounts or at-home meals. Small price moves can quickly shift purchase mix and visit frequency, as customers trade down for perceived value. Clear, quantified value communication is critical to defend traffic and margins.
Convenience expectations
Drive-thru speed, late-night availability and seamless digital ordering now define perceived value; delays or inaccuracies trigger immediate churn to nearby options. Delivery platforms expand reach but levy 15–30% commissions (2024) and amplify price comparisons. Consistent execution and uptime are the primary hedge against rising buyer power.
Variety and taste
Customers now expect diverse options—burgers, chicken, tacos and breakfast—with fast service; 2024 surveys show about 72% of diners prioritize variety, and LTOs deliver roughly a 6% average sales lift but increase operational complexity and costs. Novel items drive trial, yet studies indicate only about 35% of trials convert to repeat visits if taste falls short, and rival innovations push continuous benchmarking.
- Variety demand: 72% (2024)
- LTO sales lift: ~6% (2024)
- Trial-to-repeat risk: ~35% retention
- Competitive pressure: rising menu innovation
Digital transparency
Apps and delivery marketplaces reveal cross-brand pricing and reviews in real time, and BrightLocal 2024 found 87% of consumers read online reviews; negative ratings can cut conversion and amplify buyer power. Dynamic promos recover traffic but compress margins, while data-driven personalization raises AOV and counters pure price shopping.
- Real-time pricing/reviews
- 87% read reviews (BrightLocal 2024)
- Promos boost traffic, lower margin
- Personalization increases AOV
Delivery fees 15–30%, reviews 87% drive margin squeeze
Customers wield high bargaining power: low switching costs, price-led choices and delivery/platform dynamics (commissions 15–30% in 2024) rapidly shift demand. Value menus and promos, against food-away-from-home inflation ~4.9% YoY (BLS 2024), drive trade-downs. Digital reviews (87% read reviews, BrightLocal 2024) and demand for variety (72%) force constant innovation and margin pressure.
| Metric | 2024 |
|---|---|
| Delivery commissions | 15–30% |
| Food-away-from-home CPI | +4.9% YoY |
| Read reviews | 87% |
| Variety demand | 72% |
| LTO sales lift | ~6% |
| Trial→repeat | ~35% |
Preview the Actual Deliverable
Jack Porter's Five Forces Analysis
This preview shows the exact Jack Porter's Five Forces Analysis you'll receive—no mockups or placeholders. It's the complete, professionally formatted document, ready for immediate download and use upon purchase. What you see is precisely the file you'll get, instantly accessible.
Original: $10.00
-65%$10.00
$3.50Description
Don't Miss the Bigger Picture
Jack Porter's Five Forces Analysis distills competitive rivalry, supplier and buyer power, and the threats of new entrants and substitutes into a clear strategic snapshot. This brief snapshot only scratches the surface—unlock the full Porter's Five Forces Analysis to explore Jack’s competitive dynamics, market pressures, and strategic advantages in detail. Get a consultant-grade report with force-by-force ratings, visuals, and actionable implications for investment or strategy.
Suppliers Bargaining Power
Commodity volatility
Jack in the Box relies on beef, chicken, dairy and produce prone to commodity swings; with about 2,200 restaurants, sudden protein or oil price spikes can quickly compress margins if menu prices lag. Supply contracts and limited hedging reduce but do not eliminate volatility. Weather, disease and geopolitical shocks tightened supply and boosted supplier leverage during 2024 procurement disruptions.
Supplier concentration
Large distributors and protein processors exhibit strong scale advantages: the top four US beef packers held roughly 85% of steer slaughter capacity in 2023–24, while Sysco and US Foods together account for about 60% of foodservice distribution. Concentrated approved-vendor lists can extend switching and qualification lead times often to 3–12 months, raising supplier power. Geographic clustering in the West and South concentrates dependence on key hubs. Diversifying or dual-sourcing lowers concentration risk but typically increases coordination and logistics complexity and cost.
Quality and specs
Menu consistency forces tight specs for patties, buns, sauces and packaging, shrinking the pool of compliant suppliers and raising reliance on certified partners; in 2024 many QSRs reported food cost pressures near 30% of sales, amplifying supplier leverage. Proprietary SKUs and specialized packaging often create contractual lock‑ins that increase supplier influence, while standardized inputs still allow periodic rebids. Robust QA programs impose high changeover costs, disciplining suppliers but making switching costly and slow.
Logistics and delivery
Cold-chain reliability and on-time distribution are critical for drive-thru speed and food safety; in 2024 regional distribution partners with high route density commanded contract premiums of roughly 5–12%, strengthening supplier leverage. Rising logistics costs—diesel averaged about $3.80/gal in 2024—plus labor can be passed through to restaurants. Disruptions ripple quickly across franchisees, harming throughput and NPS.
- tag: cold-chain critical
- tag: route-density leverage
- tag: fuel/labor passthrough
- tag: disruption ripple
Beverage and equipment
Fountain beverage agreements and kitchen equipment vendors exert notable supplier power: exclusivity and service contracts (commonly 1–3 years) lock operators into Coca-Cola/Pepsi systems, while capital items like fryers ($2k–$10k), grills and POS terminals ($3k–$8k) create switching friction; volume rebates (typically 1–4%) offset costs but tether supply relationships, and service-level failures can reduce throughput, raising suppliers' implicit leverage.
- Exclusivity: 1–3 year contracts
- Capex: fryers $2k–$10k, POS $3k–$8k
- Rebates: ~1–4%
- Risk: service failures → reduced throughput
Supplier concentration: top 4 beef ~85%, distros ~60%, diesel $3.80/gal
Suppliers hold moderate‑to‑high power: protein and produce volatility (2024 beef packer top‑4 ~85% capacity) and concentrated distributors (Sysco+US Foods ~60%) can compress margins; fuel averaged $3.80/gal in 2024 raising logistics pass‑throughs. Exclusive beverage/equipment contracts (1–3 yr) and specialized SKUs increase switching costs despite 1–4% volume rebates.
| Metric | 2024 |
|---|---|
| Top‑4 beef packer share | ~85% |
| Sysco+US Foods | ~60% |
| Diesel avg | $3.80/gal |
| Volume rebates | 1–4% |
What is included in the product
Detailed Word Document
Uncovers key drivers of competition, buyer and supplier power, and entry or substitute threats facing Jack Porter, with strategic commentary on implications for pricing, margins, and market positioning.
Customizable Excel Spreadsheet
A one-sheet Five Forces summary that turns complex competitive dynamics into actionable priorities—editable pressure levels, radar visualization and slide-ready layout for rapid decision-making and seamless integration into reports.
Customers Bargaining Power
Low switching costs
Customers can choose among many quick-service alternatives within minutes, and with low monetary or time costs to switch, price and convenience dominate purchase decisions. Promotions by rivals and delivery/platform offers in 2024 continue to rapidly redirect footfall and orders. Loyalty programs improve retention but industry data show limited long-term lock-in, keeping customer bargaining power high.
Price sensitivity
Value menus and combo pricing anchor demand in budget-conscious segments, with 2024 BLS data showing food-away-from-home prices up about 4.9% year-over-year, pushing more shoppers toward discounts or at-home meals. Small price moves can quickly shift purchase mix and visit frequency, as customers trade down for perceived value. Clear, quantified value communication is critical to defend traffic and margins.
Convenience expectations
Drive-thru speed, late-night availability and seamless digital ordering now define perceived value; delays or inaccuracies trigger immediate churn to nearby options. Delivery platforms expand reach but levy 15–30% commissions (2024) and amplify price comparisons. Consistent execution and uptime are the primary hedge against rising buyer power.
Variety and taste
Customers now expect diverse options—burgers, chicken, tacos and breakfast—with fast service; 2024 surveys show about 72% of diners prioritize variety, and LTOs deliver roughly a 6% average sales lift but increase operational complexity and costs. Novel items drive trial, yet studies indicate only about 35% of trials convert to repeat visits if taste falls short, and rival innovations push continuous benchmarking.
- Variety demand: 72% (2024)
- LTO sales lift: ~6% (2024)
- Trial-to-repeat risk: ~35% retention
- Competitive pressure: rising menu innovation
Digital transparency
Apps and delivery marketplaces reveal cross-brand pricing and reviews in real time, and BrightLocal 2024 found 87% of consumers read online reviews; negative ratings can cut conversion and amplify buyer power. Dynamic promos recover traffic but compress margins, while data-driven personalization raises AOV and counters pure price shopping.
- Real-time pricing/reviews
- 87% read reviews (BrightLocal 2024)
- Promos boost traffic, lower margin
- Personalization increases AOV
Delivery fees 15–30%, reviews 87% drive margin squeeze
Customers wield high bargaining power: low switching costs, price-led choices and delivery/platform dynamics (commissions 15–30% in 2024) rapidly shift demand. Value menus and promos, against food-away-from-home inflation ~4.9% YoY (BLS 2024), drive trade-downs. Digital reviews (87% read reviews, BrightLocal 2024) and demand for variety (72%) force constant innovation and margin pressure.
| Metric | 2024 |
|---|---|
| Delivery commissions | 15–30% |
| Food-away-from-home CPI | +4.9% YoY |
| Read reviews | 87% |
| Variety demand | 72% |
| LTO sales lift | ~6% |
| Trial→repeat | ~35% |
Preview the Actual Deliverable
Jack Porter's Five Forces Analysis
This preview shows the exact Jack Porter's Five Forces Analysis you'll receive—no mockups or placeholders. It's the complete, professionally formatted document, ready for immediate download and use upon purchase. What you see is precisely the file you'll get, instantly accessible.











