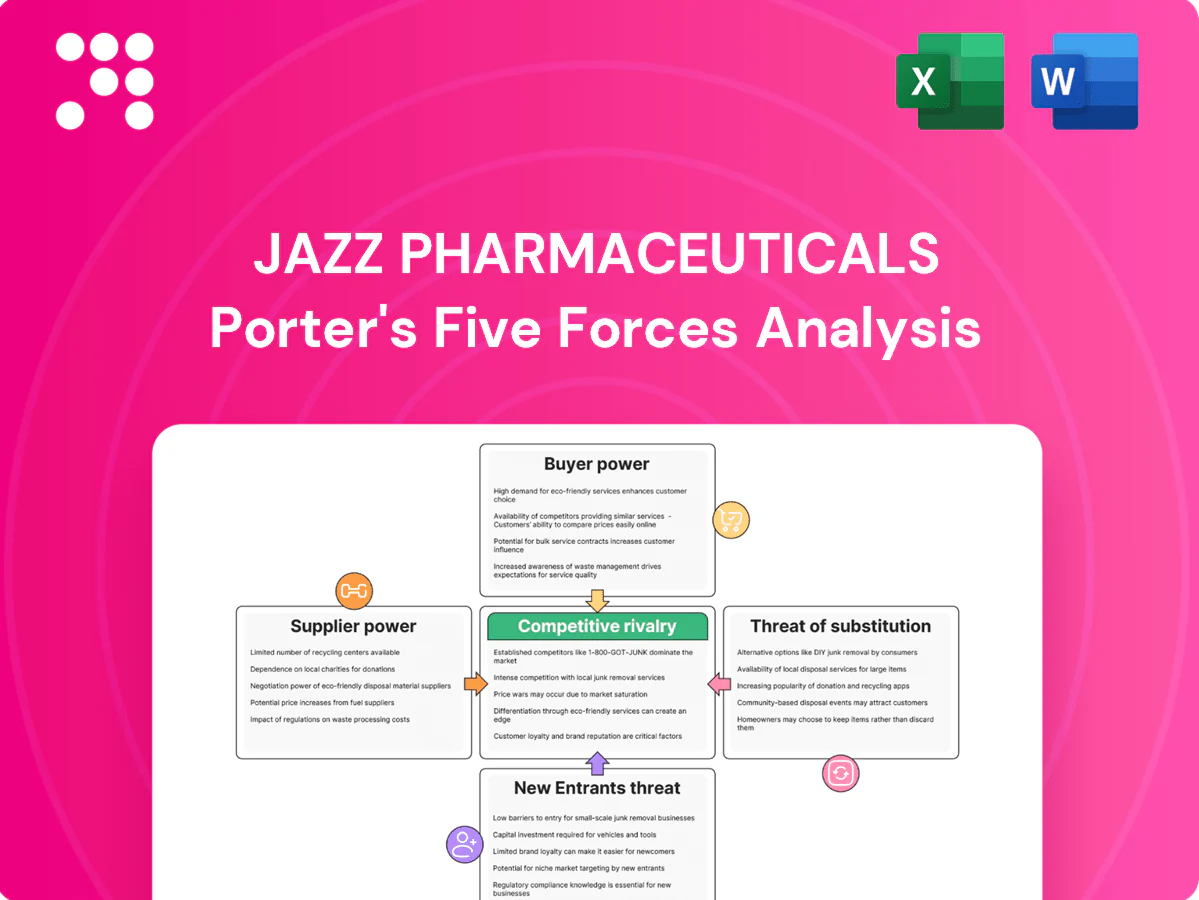
Jazz Pharmaceuticals Porter's Five Forces Analysis

Don't Miss the Bigger Picture
Jazz Pharmaceuticals faces moderate supplier power, high buyer scrutiny, and persistent threat from generics and biotech innovation, shaping a complex competitive landscape. This snapshot highlights key pressures and strategic levers but only scratches the surface. Unlock the full Porter's Five Forces Analysis to access force-by-force ratings, visuals, and actionable insights for investment or strategy.
Suppliers Bargaining Power

Specialty APIs and controlled substances
Jazz depends on niche APIs such as oxybate chemistries and DEA‑regulated controlled substances that have few qualified manufacturers, and annual DEA production quotas constrain availability. Supplier switching requires lengthy validation, GMP audits and quota transfers, slowing timelines. This supplier concentration increases leverage over pricing and contract terms. Dual‑sourcing is feasible but adds significant cost and time.
Biologics/complex injectables manufacturing
Oncology injectables like Rylaze and Vyxeos require CMOs with sterile biologics capabilities, and 2024 industry reports showed sterile fill‑finish capacity running above 90%, tightening supplier leverage. Scarce capacity and risk of batch failures that can halt supply increase supplier power and price negotiation strength. Long tech‑transfer timelines (often 12–24 months) lock Jazz into incumbent partners. Contracts commonly include minimum purchase commitments and inflation pass‑through clauses.

Licensing and co-development partners
Licensing of key assets like lurbinectedin/Zepzelca creates direct dependency on originators for IP, supply continuity and milestone payments, letting partners negotiate royalties (commonly 5–20%) and restrictive territory rights. Renegotiations or performance clauses tied to sales milestones can compress Jazz’s margins and cash flow. Diversifying licensors reduces single-source risk but raises coordination and compliance costs across contracts and supply chains.

Clinical and data infrastructure vendors
Clinical research orgs, specialty labs and data-platform vendors (CRO market ~70 billion USD in 2024) are critical across trials and post‑marketing commitments, and a small set of top-tier vendors handle most late‑stage programs, creating switching risks to timelines and quality. That concentration gives moderate supplier power over pricing and study prioritization. Multi-vendor strategies lower vendor lock but raise program oversight and integration costs.
- Concentration: top vendors dominate late‑stage work
- Risk: switching impacts timelines/quality
- Pricing power: moderate due to few alternatives
- Mitigation: multi‑vendor increases control burden
Packaging, devices, and cold-chain logistics
Sterile packaging, specialty vials and temperature-controlled logistics are highly concentrated suppliers; disruptions like shortages or recalls can immediately halt sales and increase supplier leverage, with the global cold-chain logistics market exceeding $300 billion in 2024, raising transport cost exposure for specialty drugs. Contracting buffer stocks and alternate SKUs mitigates risk but increases working capital and COGS and global distribution adds regulatory and customs complexity.
- Concentration: few qualified sterile vial and cold-chain providers
- 2024: cold-chain market >$300B, amplifying logistics spend
- Mitigation: buffer stocks/alternate SKUs raise inventory cost
- Global reach: adds customs, GDP, and regulatory compliance risk
Supplier power high for niche oxybate APIs and DEA‑quota drugs; sterile CMO capacity tight
Supplier power is high for niche oxybate APIs and DEA‑quota drugs with few qualified makers, raising price and continuity risk. Sterile CMOs face >90% fill‑finish utilization in 2024, tightening capacity. CROs ($70B 2024) and cold‑chain (>$300B 2024) concentration add moderate–high leverage and cost exposure.
| Category | 2024 data | Impact |
|---|---|---|
| APIs | Few suppliers; DEA quotas | High |
| Sterile CMOs | >90% util. | High |
| CROs | $70B market | Moderate |
| Cold‑chain | >$300B | Moderate‑High |
What is included in the product
 Detailed Word Document
Tailored exclusively for Jazz Pharmaceuticals, this Porter's Five Forces overview uncovers key drivers of competition, customer and supplier influence, and market entry barriers, identifying disruptive threats, substitutes, and dynamics that affect pricing, profitability, and strategic positioning.

 Customizable Excel Spreadsheet
A concise one-sheet Porter's Five Forces for Jazz Pharmaceuticals that highlights competitive pressures, regulatory risk, and supplier/buyer dynamics—ideal for rapid strategic decisions, pitch decks, or boardroom briefings.
Customers Bargaining Power

Payers and PBMs in the U.S.
Reimbursement gatekeepers and PBMs negotiate rebates (often 20–40%) and tightly manage utilization for Jazz’s sleep and oncology drugs, with Medicare Part D covering ~50 million beneficiaries in 2024 amplifying payer leverage. Orphan designation limits direct rivals but does not prevent formulary exclusion or aggressive utilization management. Step therapy, prior authorization and outcomes-based contracts further shift pricing power to payers, driving net price erosion despite high list prices.
Hospitals and GPOs for oncology
Hospital pharmacies and GPOs, which represent about 90% of U.S. hospitals, aggregate demand for oncology injectables like Vyxeos and Rylaze, giving buyers scale leverage. Formularies and budget-impact reviews drive tough negotiations and formulary exclusions. Bundled purchasing and chargeback mechanisms often produce contract discounts frequently exceeding 20%, increasing buyer power. Clinical differentiation remains essential to preserve access and pricing.

International HTA bodies
International HTA bodies such as NICE (threshold ~£20,000–30,000/QALY), G-BA and CADTH (commonly referenced ~CAD$50,000/QALY) tie price to cost‑effectiveness, granting them leverage to delay or restrict access. They routinely demand discounts, rebates or risk‑sharing arrangements, exerting strong buyer power outside the U.S. Thorough dossiers and robust real‑world evidence are critical to secure favorable appraisals and market access.

Patients and prescribers in niche diseases
Patients and prescribers in rare diseases often show muted price sensitivity because FDA orphan designation covers conditions affecting fewer than 200,000 people in the US (as of 2024). Co-pays and access programs nevertheless materially influence uptake. Educational/adherence services and stronger safety profiles increase prescriber loyalty and reduce switching.
- Low price sensitivity: orphan populations <200,000 (FDA 2024)
- Access impact: co-pays and assistance programs drive initiation
- Retention drivers: safety profile + adherence support cut switching
Channel concentration and data transparency
Claims analytics let payers enforce prior authorizations and steer prescribing, increasing buyer leverage; the top three PBMs control roughly 80% of US commercial claims and Medicare Part D had about 50 million enrollees in 2024, magnifying negotiating power. Greater transparency on outcomes and rivals’ rebates fuels price pressure, while value-based and indication-based contracts can partially offset that leverage.
- Claims analytics: enforce restrictions
- Payer concentration: top 3 PBMs ~80%
- Transparency: rebates/outcomes drive price pressure
- Contract innovation: value/indication pricing offsets leverage
Payers, PBMs & GPOs wield pricing power — 80% PBMs; 50M Part D
Payers and PBMs exert strong pricing leverage—top 3 PBMs ~80% of US claims and Medicare Part D ~50 million enrollees (2024)—driving rebates often 20–40% and tight utilization management. Hospital GPOs cover ~90% of US hospitals, concentrating negotiating power for oncology injectables. Orphan status (<200,000 US patients) reduces competition but does not eliminate formulary exclusion or step therapy.
| Metric | 2024 value |
|---|---|
| Top 3 PBM share | ~80% |
| Medicare Part D enrollees | ~50M |
| Hospitals in GPOs | ~90% |
| Typical rebates | 20–40% |
Preview the Actual Deliverable
Jazz Pharmaceuticals Porter's Five Forces Analysis
This Porter's Five Forces analysis of Jazz Pharmaceuticals assesses competitive rivalry, supplier and buyer power, threat of substitutes, and barriers to entry with actionable insights for strategy and valuation. This preview shows the exact document you'll receive immediately after purchase—no surprises, no placeholders. The report is fully formatted, evidence-based, and ready for immediate use to inform investment or strategic decisions.

Don't Miss the Bigger Picture
Jazz Pharmaceuticals faces moderate supplier power, high buyer scrutiny, and persistent threat from generics and biotech innovation, shaping a complex competitive landscape. This snapshot highlights key pressures and strategic levers but only scratches the surface. Unlock the full Porter's Five Forces Analysis to access force-by-force ratings, visuals, and actionable insights for investment or strategy.
Suppliers Bargaining Power
Specialty APIs and controlled substances
Jazz depends on niche APIs such as oxybate chemistries and DEA‑regulated controlled substances that have few qualified manufacturers, and annual DEA production quotas constrain availability. Supplier switching requires lengthy validation, GMP audits and quota transfers, slowing timelines. This supplier concentration increases leverage over pricing and contract terms. Dual‑sourcing is feasible but adds significant cost and time.
Biologics/complex injectables manufacturing
Oncology injectables like Rylaze and Vyxeos require CMOs with sterile biologics capabilities, and 2024 industry reports showed sterile fill‑finish capacity running above 90%, tightening supplier leverage. Scarce capacity and risk of batch failures that can halt supply increase supplier power and price negotiation strength. Long tech‑transfer timelines (often 12–24 months) lock Jazz into incumbent partners. Contracts commonly include minimum purchase commitments and inflation pass‑through clauses.
Licensing and co-development partners
Licensing of key assets like lurbinectedin/Zepzelca creates direct dependency on originators for IP, supply continuity and milestone payments, letting partners negotiate royalties (commonly 5–20%) and restrictive territory rights. Renegotiations or performance clauses tied to sales milestones can compress Jazz’s margins and cash flow. Diversifying licensors reduces single-source risk but raises coordination and compliance costs across contracts and supply chains.
Clinical and data infrastructure vendors
Clinical research orgs, specialty labs and data-platform vendors (CRO market ~70 billion USD in 2024) are critical across trials and post‑marketing commitments, and a small set of top-tier vendors handle most late‑stage programs, creating switching risks to timelines and quality. That concentration gives moderate supplier power over pricing and study prioritization. Multi-vendor strategies lower vendor lock but raise program oversight and integration costs.
- Concentration: top vendors dominate late‑stage work
- Risk: switching impacts timelines/quality
- Pricing power: moderate due to few alternatives
- Mitigation: multi‑vendor increases control burden
Packaging, devices, and cold-chain logistics
Sterile packaging, specialty vials and temperature-controlled logistics are highly concentrated suppliers; disruptions like shortages or recalls can immediately halt sales and increase supplier leverage, with the global cold-chain logistics market exceeding $300 billion in 2024, raising transport cost exposure for specialty drugs. Contracting buffer stocks and alternate SKUs mitigates risk but increases working capital and COGS and global distribution adds regulatory and customs complexity.
- Concentration: few qualified sterile vial and cold-chain providers
- 2024: cold-chain market >$300B, amplifying logistics spend
- Mitigation: buffer stocks/alternate SKUs raise inventory cost
- Global reach: adds customs, GDP, and regulatory compliance risk
Supplier power high for niche oxybate APIs and DEA‑quota drugs; sterile CMO capacity tight
Supplier power is high for niche oxybate APIs and DEA‑quota drugs with few qualified makers, raising price and continuity risk. Sterile CMOs face >90% fill‑finish utilization in 2024, tightening capacity. CROs ($70B 2024) and cold‑chain (>$300B 2024) concentration add moderate–high leverage and cost exposure.
| Category | 2024 data | Impact |
|---|---|---|
| APIs | Few suppliers; DEA quotas | High |
| Sterile CMOs | >90% util. | High |
| CROs | $70B market | Moderate |
| Cold‑chain | >$300B | Moderate‑High |
What is included in the product
Detailed Word Document
Tailored exclusively for Jazz Pharmaceuticals, this Porter's Five Forces overview uncovers key drivers of competition, customer and supplier influence, and market entry barriers, identifying disruptive threats, substitutes, and dynamics that affect pricing, profitability, and strategic positioning.
Customizable Excel Spreadsheet
A concise one-sheet Porter's Five Forces for Jazz Pharmaceuticals that highlights competitive pressures, regulatory risk, and supplier/buyer dynamics—ideal for rapid strategic decisions, pitch decks, or boardroom briefings.
Customers Bargaining Power
Payers and PBMs in the U.S.
Reimbursement gatekeepers and PBMs negotiate rebates (often 20–40%) and tightly manage utilization for Jazz’s sleep and oncology drugs, with Medicare Part D covering ~50 million beneficiaries in 2024 amplifying payer leverage. Orphan designation limits direct rivals but does not prevent formulary exclusion or aggressive utilization management. Step therapy, prior authorization and outcomes-based contracts further shift pricing power to payers, driving net price erosion despite high list prices.
Hospitals and GPOs for oncology
Hospital pharmacies and GPOs, which represent about 90% of U.S. hospitals, aggregate demand for oncology injectables like Vyxeos and Rylaze, giving buyers scale leverage. Formularies and budget-impact reviews drive tough negotiations and formulary exclusions. Bundled purchasing and chargeback mechanisms often produce contract discounts frequently exceeding 20%, increasing buyer power. Clinical differentiation remains essential to preserve access and pricing.
International HTA bodies
International HTA bodies such as NICE (threshold ~£20,000–30,000/QALY), G-BA and CADTH (commonly referenced ~CAD$50,000/QALY) tie price to cost‑effectiveness, granting them leverage to delay or restrict access. They routinely demand discounts, rebates or risk‑sharing arrangements, exerting strong buyer power outside the U.S. Thorough dossiers and robust real‑world evidence are critical to secure favorable appraisals and market access.
Patients and prescribers in niche diseases
Patients and prescribers in rare diseases often show muted price sensitivity because FDA orphan designation covers conditions affecting fewer than 200,000 people in the US (as of 2024). Co-pays and access programs nevertheless materially influence uptake. Educational/adherence services and stronger safety profiles increase prescriber loyalty and reduce switching.
- Low price sensitivity: orphan populations <200,000 (FDA 2024)
- Access impact: co-pays and assistance programs drive initiation
- Retention drivers: safety profile + adherence support cut switching
Channel concentration and data transparency
Claims analytics let payers enforce prior authorizations and steer prescribing, increasing buyer leverage; the top three PBMs control roughly 80% of US commercial claims and Medicare Part D had about 50 million enrollees in 2024, magnifying negotiating power. Greater transparency on outcomes and rivals’ rebates fuels price pressure, while value-based and indication-based contracts can partially offset that leverage.
- Claims analytics: enforce restrictions
- Payer concentration: top 3 PBMs ~80%
- Transparency: rebates/outcomes drive price pressure
- Contract innovation: value/indication pricing offsets leverage
Payers, PBMs & GPOs wield pricing power — 80% PBMs; 50M Part D
Payers and PBMs exert strong pricing leverage—top 3 PBMs ~80% of US claims and Medicare Part D ~50 million enrollees (2024)—driving rebates often 20–40% and tight utilization management. Hospital GPOs cover ~90% of US hospitals, concentrating negotiating power for oncology injectables. Orphan status (<200,000 US patients) reduces competition but does not eliminate formulary exclusion or step therapy.
| Metric | 2024 value |
|---|---|
| Top 3 PBM share | ~80% |
| Medicare Part D enrollees | ~50M |
| Hospitals in GPOs | ~90% |
| Typical rebates | 20–40% |
Preview the Actual Deliverable
Jazz Pharmaceuticals Porter's Five Forces Analysis
This Porter's Five Forces analysis of Jazz Pharmaceuticals assesses competitive rivalry, supplier and buyer power, threat of substitutes, and barriers to entry with actionable insights for strategy and valuation. This preview shows the exact document you'll receive immediately after purchase—no surprises, no placeholders. The report is fully formatted, evidence-based, and ready for immediate use to inform investment or strategic decisions.
Description
Don't Miss the Bigger Picture
Jazz Pharmaceuticals faces moderate supplier power, high buyer scrutiny, and persistent threat from generics and biotech innovation, shaping a complex competitive landscape. This snapshot highlights key pressures and strategic levers but only scratches the surface. Unlock the full Porter's Five Forces Analysis to access force-by-force ratings, visuals, and actionable insights for investment or strategy.
Suppliers Bargaining Power
Specialty APIs and controlled substances
Jazz depends on niche APIs such as oxybate chemistries and DEA‑regulated controlled substances that have few qualified manufacturers, and annual DEA production quotas constrain availability. Supplier switching requires lengthy validation, GMP audits and quota transfers, slowing timelines. This supplier concentration increases leverage over pricing and contract terms. Dual‑sourcing is feasible but adds significant cost and time.
Biologics/complex injectables manufacturing
Oncology injectables like Rylaze and Vyxeos require CMOs with sterile biologics capabilities, and 2024 industry reports showed sterile fill‑finish capacity running above 90%, tightening supplier leverage. Scarce capacity and risk of batch failures that can halt supply increase supplier power and price negotiation strength. Long tech‑transfer timelines (often 12–24 months) lock Jazz into incumbent partners. Contracts commonly include minimum purchase commitments and inflation pass‑through clauses.
Licensing and co-development partners
Licensing of key assets like lurbinectedin/Zepzelca creates direct dependency on originators for IP, supply continuity and milestone payments, letting partners negotiate royalties (commonly 5–20%) and restrictive territory rights. Renegotiations or performance clauses tied to sales milestones can compress Jazz’s margins and cash flow. Diversifying licensors reduces single-source risk but raises coordination and compliance costs across contracts and supply chains.
Clinical and data infrastructure vendors
Clinical research orgs, specialty labs and data-platform vendors (CRO market ~70 billion USD in 2024) are critical across trials and post‑marketing commitments, and a small set of top-tier vendors handle most late‑stage programs, creating switching risks to timelines and quality. That concentration gives moderate supplier power over pricing and study prioritization. Multi-vendor strategies lower vendor lock but raise program oversight and integration costs.
- Concentration: top vendors dominate late‑stage work
- Risk: switching impacts timelines/quality
- Pricing power: moderate due to few alternatives
- Mitigation: multi‑vendor increases control burden
Packaging, devices, and cold-chain logistics
Sterile packaging, specialty vials and temperature-controlled logistics are highly concentrated suppliers; disruptions like shortages or recalls can immediately halt sales and increase supplier leverage, with the global cold-chain logistics market exceeding $300 billion in 2024, raising transport cost exposure for specialty drugs. Contracting buffer stocks and alternate SKUs mitigates risk but increases working capital and COGS and global distribution adds regulatory and customs complexity.
- Concentration: few qualified sterile vial and cold-chain providers
- 2024: cold-chain market >$300B, amplifying logistics spend
- Mitigation: buffer stocks/alternate SKUs raise inventory cost
- Global reach: adds customs, GDP, and regulatory compliance risk
Supplier power high for niche oxybate APIs and DEA‑quota drugs; sterile CMO capacity tight
Supplier power is high for niche oxybate APIs and DEA‑quota drugs with few qualified makers, raising price and continuity risk. Sterile CMOs face >90% fill‑finish utilization in 2024, tightening capacity. CROs ($70B 2024) and cold‑chain (>$300B 2024) concentration add moderate–high leverage and cost exposure.
| Category | 2024 data | Impact |
|---|---|---|
| APIs | Few suppliers; DEA quotas | High |
| Sterile CMOs | >90% util. | High |
| CROs | $70B market | Moderate |
| Cold‑chain | >$300B | Moderate‑High |
What is included in the product
Detailed Word Document
Tailored exclusively for Jazz Pharmaceuticals, this Porter's Five Forces overview uncovers key drivers of competition, customer and supplier influence, and market entry barriers, identifying disruptive threats, substitutes, and dynamics that affect pricing, profitability, and strategic positioning.
Customizable Excel Spreadsheet
A concise one-sheet Porter's Five Forces for Jazz Pharmaceuticals that highlights competitive pressures, regulatory risk, and supplier/buyer dynamics—ideal for rapid strategic decisions, pitch decks, or boardroom briefings.
Customers Bargaining Power
Payers and PBMs in the U.S.
Reimbursement gatekeepers and PBMs negotiate rebates (often 20–40%) and tightly manage utilization for Jazz’s sleep and oncology drugs, with Medicare Part D covering ~50 million beneficiaries in 2024 amplifying payer leverage. Orphan designation limits direct rivals but does not prevent formulary exclusion or aggressive utilization management. Step therapy, prior authorization and outcomes-based contracts further shift pricing power to payers, driving net price erosion despite high list prices.
Hospitals and GPOs for oncology
Hospital pharmacies and GPOs, which represent about 90% of U.S. hospitals, aggregate demand for oncology injectables like Vyxeos and Rylaze, giving buyers scale leverage. Formularies and budget-impact reviews drive tough negotiations and formulary exclusions. Bundled purchasing and chargeback mechanisms often produce contract discounts frequently exceeding 20%, increasing buyer power. Clinical differentiation remains essential to preserve access and pricing.
International HTA bodies
International HTA bodies such as NICE (threshold ~£20,000–30,000/QALY), G-BA and CADTH (commonly referenced ~CAD$50,000/QALY) tie price to cost‑effectiveness, granting them leverage to delay or restrict access. They routinely demand discounts, rebates or risk‑sharing arrangements, exerting strong buyer power outside the U.S. Thorough dossiers and robust real‑world evidence are critical to secure favorable appraisals and market access.
Patients and prescribers in niche diseases
Patients and prescribers in rare diseases often show muted price sensitivity because FDA orphan designation covers conditions affecting fewer than 200,000 people in the US (as of 2024). Co-pays and access programs nevertheless materially influence uptake. Educational/adherence services and stronger safety profiles increase prescriber loyalty and reduce switching.
- Low price sensitivity: orphan populations <200,000 (FDA 2024)
- Access impact: co-pays and assistance programs drive initiation
- Retention drivers: safety profile + adherence support cut switching
Channel concentration and data transparency
Claims analytics let payers enforce prior authorizations and steer prescribing, increasing buyer leverage; the top three PBMs control roughly 80% of US commercial claims and Medicare Part D had about 50 million enrollees in 2024, magnifying negotiating power. Greater transparency on outcomes and rivals’ rebates fuels price pressure, while value-based and indication-based contracts can partially offset that leverage.
- Claims analytics: enforce restrictions
- Payer concentration: top 3 PBMs ~80%
- Transparency: rebates/outcomes drive price pressure
- Contract innovation: value/indication pricing offsets leverage
Payers, PBMs & GPOs wield pricing power — 80% PBMs; 50M Part D
Payers and PBMs exert strong pricing leverage—top 3 PBMs ~80% of US claims and Medicare Part D ~50 million enrollees (2024)—driving rebates often 20–40% and tight utilization management. Hospital GPOs cover ~90% of US hospitals, concentrating negotiating power for oncology injectables. Orphan status (<200,000 US patients) reduces competition but does not eliminate formulary exclusion or step therapy.
| Metric | 2024 value |
|---|---|
| Top 3 PBM share | ~80% |
| Medicare Part D enrollees | ~50M |
| Hospitals in GPOs | ~90% |
| Typical rebates | 20–40% |
Preview the Actual Deliverable
Jazz Pharmaceuticals Porter's Five Forces Analysis
This Porter's Five Forces analysis of Jazz Pharmaceuticals assesses competitive rivalry, supplier and buyer power, threat of substitutes, and barriers to entry with actionable insights for strategy and valuation. This preview shows the exact document you'll receive immediately after purchase—no surprises, no placeholders. The report is fully formatted, evidence-based, and ready for immediate use to inform investment or strategic decisions.











