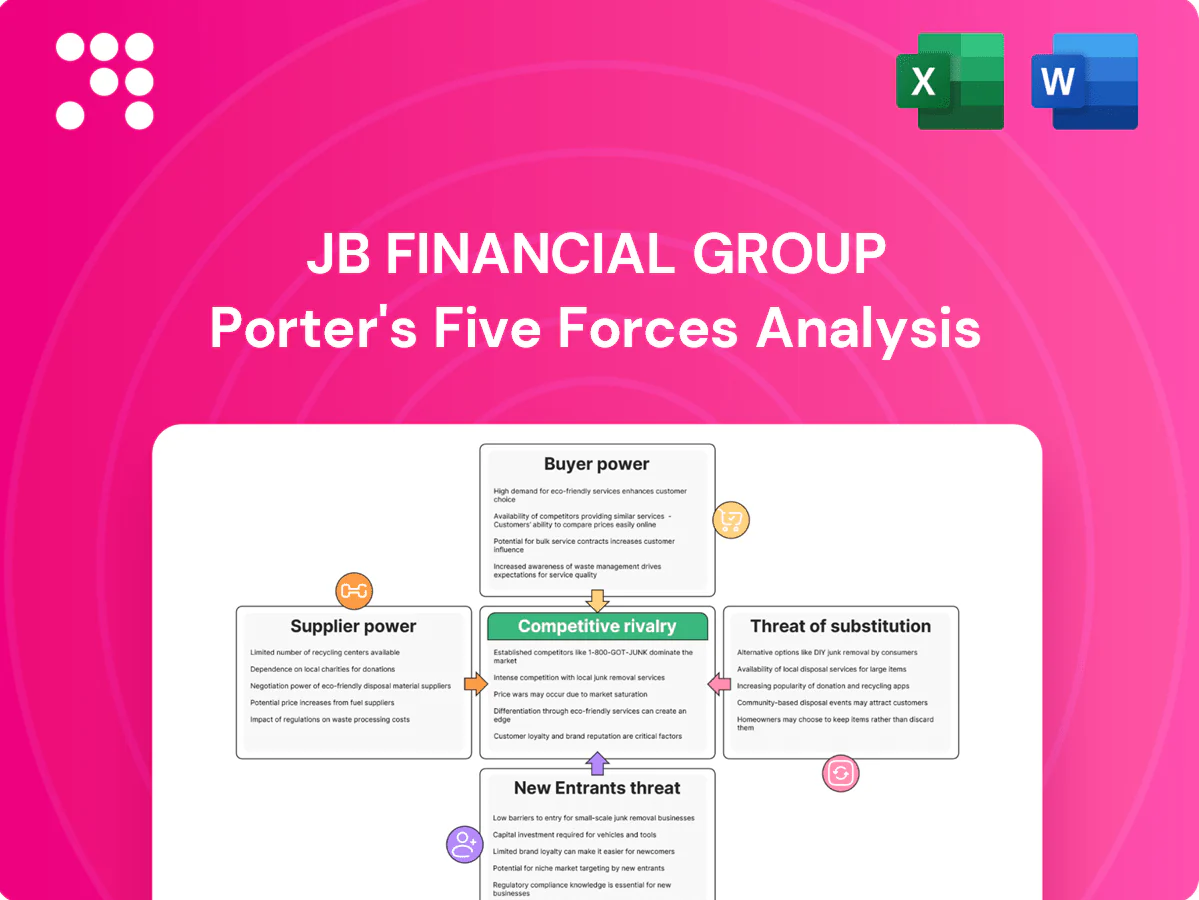
JB Financial Group Porter's Five Forces Analysis

Don't Miss the Bigger Picture
JB Financial Group faces moderate buyer power, regulatory-driven supplier constraints, and evolving fintech substitutes that could reshape margins; established scale limits entrant threats but heightens competitive rivalry. This brief snapshot only scratches the surface. Unlock the full Porter's Five Forces Analysis to explore JB Financial Group’s competitive dynamics, market pressures, and strategic advantages in detail.
Suppliers Bargaining Power

Concentrated core tech vendors
JB Financial Group relies on a small set of core banking, securities and risk-IT platforms, giving vendors leverage over pricing and upgrade terms; core replacements typically cost $50–200M and take 2–5 years, reinforcing vendor stickiness. Vendors can shape roadmaps and service levels, slowing product rollouts. Multi-vendor strategies and growing in-house capabilities partially offset this power.
Wholesale and interbank funding
Beyond core deposits, JB Financial taps wholesale markets, bond investors and interbank lines that can reprice rapidly, increasing supplier leverage during stress. In tightening or risk-off periods spreads widen and covenants tighten, elevating supplier power and funding cost volatility. Diversified maturities, stable liquidity buffers and its regional deposit franchise and investment-grade standing mitigate but do not eliminate this exposure.

Payment and card networks
Card schemes and payment rails remain concentrated—Visa and Mastercard account for roughly 75% of global branded card volume in 2024—letting scheme fees and rules be largely dictated to issuers and acquirers. Scheme and processor fees (typically 0.1–2.0% per transaction), plus compliance, fraud tools and tokenization, add mandatory cost layers with few substitutes. Scale discounts favor larger peers, squeezing margins for mid‑sized groups; strategic partnerships and intra‑group volume aggregation can partially offset fees.

Data, credit bureaus, and market data
Access to credit bureaus and KYC/AML datasets is concentrated among three global credit bureaus (Experian, TransUnion, Equifax) and a few market-data vendors (Bloomberg, Refinitiv, S&P), creating high supplier leverage for JB Financial; license hikes or restrictions can cascade across subsidiaries, and vendor lock-in stems from model calibration and regulator-approved datasets tied to specific feeds.
- Concentration: three major credit bureaus
- Key vendors: Bloomberg, Refinitiv, S&P
- Risk: cascading license/price impact
- Mitigation: enterprise-wide contracting
Skilled talent and consulting
Specialist risk, digital, and regulatory talent is scarce in South Korea, giving labor suppliers meaningful bargaining power; JB Financial Group faces wage inflation and retention bonuses concentrated in Seoul’s finance-tech corridor. Critical transformation projects frequently rely on external consultants who command premium rates, increasing operating costs. South Korea sustained high R&D intensity (~4.5% of GDP in 2023–24), underscoring competition for skilled talent.
- High supplier leverage
- Wage inflation & retention bonuses concentrated in Seoul
- Premium consultant rates for critical projects
- Internal training and regional employer branding mitigate dependence
Supplier concentration: core IT swaps $50–200M, card share ~75%, 3 bureaus
Suppliers wield high leverage: core banking swaps cost $50–200M and take 2–5 years, while Visa/Mastercard control ~75% of branded card volume (2024), and three major credit bureaus dominate data feeds. Wholesale funding reprice risk raises vulnerability in stress despite investment‑grade standing and liquidity buffers. Talent scarcity in Seoul and premium consultants lift operating costs.
| Metric | Value (year) |
|---|---|
| Core IT replacement | $50–200M, 2–5 yrs |
| Card scheme share | ~75% (2024) |
| Credit bureaus | 3 major providers |
| R&D intensity (KOR) | ~4.5% GDP (2023–24) |
What is included in the product
 Detailed Word Document
Tailored Porter's Five Forces analysis for JB Financial Group that uncovers competitive drivers, customer and supplier power, and market entry barriers. Identifies disruptive threats, substitutes, and strategic levers affecting pricing, profitability, and long-term market position.

 Customizable Excel Spreadsheet
A one-sheet Porter’s Five Forces for JB Financial Group visualizes competitive pressure with a spider chart and customizable intensity levels, letting executives quickly spot threats, model scenarios, and paste clear slides into decks—no macros required.
Customers Bargaining Power

Low switching costs in retail
Low switching costs are driven by digital onboarding, open banking APIs and comparison apps that let retail customers move deposits and loans in minutes; smartphone penetration in Korea near 95% in 2024 magnifies this ease. Rate and fee transparency raises price sensitivity, while KakaoBank, K-Bank and Toss Bank—three dominant internet banks—amplify churn via superior UX and promotions. Strong local loyalty in Jeonbuk cushions some outflow, but nationwide competition increases buyer leverage.
SME and corporate bargaining
Corporate and SME clients exert strong bargaining power by negotiating loan spreads, collateral and fees through multi-banking, forcing JB Financial to compete on pricing and service depth. Bundling cash management, FX and trade finance has become table stakes to retain mandates, while deep relationships can win deals even as clients re-tender regularly. Sector specialization and faster credit decisioning materially reduce buyer leverage.

Institutional investors and brokerage clients
Brokerage and asset-management clients compare execution quality, research depth and fees when choosing JB Financial; institutional clients push for block liquidity, prime services and competitive commissions. Retail investors remain highly fee-sensitive and prioritize platform UX. Differentiated proprietary research and exclusive product access allow JB Financial to charge modest premiums to select client segments.

Sensitivity to service quality
Outage intolerance in payments and mobile banking gives JB Financial Group customers strong leverage to demand strict SLAs and compensation; with 96% smartphone penetration in South Korea (2024), disruptions rapidly affect transaction volumes. Negative experiences amplify via social channels, accelerating attrition, while customers increasingly expect 24/7 support and seamless omni-channel journeys. Superior CX and rapid incident response materially blunt this bargaining power.
- Expectations: 99.9% uptime SLAs
- Market reality: 96% smartphone penetration (2024)
- Risk: fast social amplification driving churn
Regulated consumer protections
Korean Financial Consumer Protection Act (2020) and the 2021 legal cap on loan interest at 20% enforce APR disclosure, complaint redress and refinancing options, strengthening buyers’ leverage on pricing and terms. Caps and mandated disclosures limit upselling flexibility, while clear communication and compliant product design support trust and retention.
- FCPA 2020: mandatory disclosure, complaint channels
- Interest cap 20% (2021)
- Refinancing rights improve customer leverage
- Disclosure limits upsell, boosts retention
Customers wield high bargaining power: 96% mobile reach, 20% APR cap, 99.9% SLA
Customers hold elevated bargaining power: low switching costs from open banking and three dominant internet banks (KakaoBank, K-Bank, Toss Bank) drive price sensitivity; corporate clients leverage multi-banking for spreads while retail demands UX and low fees. Regulatory caps (20% APR) and 96% smartphone penetration (2024) amplify expectations for 99.9% uptime and rapid redress.
| Metric | Value | Implication |
|---|---|---|
| Smartphone penetration (2024) | 96% | High churn risk |
| Internet banks | 3 | Low switching cost |
| Interest cap | 20% | Limits pricing |
| Expected SLA | 99.9% | Service pressure |
What You See Is What You Get
JB Financial Group Porter's Five Forces Analysis
This Porter’s Five Forces analysis of JB Financial Group evaluates competitive rivalry, supplier and buyer power, threat of substitutes, and barriers to entry to inform strategic decisions. It highlights key risks and opportunities with evidence-based insights and actionable implications. The preview shown is the exact, fully formatted document you’ll receive instantly after purchase.

Don't Miss the Bigger Picture
JB Financial Group faces moderate buyer power, regulatory-driven supplier constraints, and evolving fintech substitutes that could reshape margins; established scale limits entrant threats but heightens competitive rivalry. This brief snapshot only scratches the surface. Unlock the full Porter's Five Forces Analysis to explore JB Financial Group’s competitive dynamics, market pressures, and strategic advantages in detail.
Suppliers Bargaining Power
Concentrated core tech vendors
JB Financial Group relies on a small set of core banking, securities and risk-IT platforms, giving vendors leverage over pricing and upgrade terms; core replacements typically cost $50–200M and take 2–5 years, reinforcing vendor stickiness. Vendors can shape roadmaps and service levels, slowing product rollouts. Multi-vendor strategies and growing in-house capabilities partially offset this power.
Wholesale and interbank funding
Beyond core deposits, JB Financial taps wholesale markets, bond investors and interbank lines that can reprice rapidly, increasing supplier leverage during stress. In tightening or risk-off periods spreads widen and covenants tighten, elevating supplier power and funding cost volatility. Diversified maturities, stable liquidity buffers and its regional deposit franchise and investment-grade standing mitigate but do not eliminate this exposure.
Payment and card networks
Card schemes and payment rails remain concentrated—Visa and Mastercard account for roughly 75% of global branded card volume in 2024—letting scheme fees and rules be largely dictated to issuers and acquirers. Scheme and processor fees (typically 0.1–2.0% per transaction), plus compliance, fraud tools and tokenization, add mandatory cost layers with few substitutes. Scale discounts favor larger peers, squeezing margins for mid‑sized groups; strategic partnerships and intra‑group volume aggregation can partially offset fees.
Data, credit bureaus, and market data
Access to credit bureaus and KYC/AML datasets is concentrated among three global credit bureaus (Experian, TransUnion, Equifax) and a few market-data vendors (Bloomberg, Refinitiv, S&P), creating high supplier leverage for JB Financial; license hikes or restrictions can cascade across subsidiaries, and vendor lock-in stems from model calibration and regulator-approved datasets tied to specific feeds.
- Concentration: three major credit bureaus
- Key vendors: Bloomberg, Refinitiv, S&P
- Risk: cascading license/price impact
- Mitigation: enterprise-wide contracting
Skilled talent and consulting
Specialist risk, digital, and regulatory talent is scarce in South Korea, giving labor suppliers meaningful bargaining power; JB Financial Group faces wage inflation and retention bonuses concentrated in Seoul’s finance-tech corridor. Critical transformation projects frequently rely on external consultants who command premium rates, increasing operating costs. South Korea sustained high R&D intensity (~4.5% of GDP in 2023–24), underscoring competition for skilled talent.
- High supplier leverage
- Wage inflation & retention bonuses concentrated in Seoul
- Premium consultant rates for critical projects
- Internal training and regional employer branding mitigate dependence
Supplier concentration: core IT swaps $50–200M, card share ~75%, 3 bureaus
Suppliers wield high leverage: core banking swaps cost $50–200M and take 2–5 years, while Visa/Mastercard control ~75% of branded card volume (2024), and three major credit bureaus dominate data feeds. Wholesale funding reprice risk raises vulnerability in stress despite investment‑grade standing and liquidity buffers. Talent scarcity in Seoul and premium consultants lift operating costs.
| Metric | Value (year) |
|---|---|
| Core IT replacement | $50–200M, 2–5 yrs |
| Card scheme share | ~75% (2024) |
| Credit bureaus | 3 major providers |
| R&D intensity (KOR) | ~4.5% GDP (2023–24) |
What is included in the product
Detailed Word Document
Tailored Porter's Five Forces analysis for JB Financial Group that uncovers competitive drivers, customer and supplier power, and market entry barriers. Identifies disruptive threats, substitutes, and strategic levers affecting pricing, profitability, and long-term market position.
Customizable Excel Spreadsheet
A one-sheet Porter’s Five Forces for JB Financial Group visualizes competitive pressure with a spider chart and customizable intensity levels, letting executives quickly spot threats, model scenarios, and paste clear slides into decks—no macros required.
Customers Bargaining Power
Low switching costs in retail
Low switching costs are driven by digital onboarding, open banking APIs and comparison apps that let retail customers move deposits and loans in minutes; smartphone penetration in Korea near 95% in 2024 magnifies this ease. Rate and fee transparency raises price sensitivity, while KakaoBank, K-Bank and Toss Bank—three dominant internet banks—amplify churn via superior UX and promotions. Strong local loyalty in Jeonbuk cushions some outflow, but nationwide competition increases buyer leverage.
SME and corporate bargaining
Corporate and SME clients exert strong bargaining power by negotiating loan spreads, collateral and fees through multi-banking, forcing JB Financial to compete on pricing and service depth. Bundling cash management, FX and trade finance has become table stakes to retain mandates, while deep relationships can win deals even as clients re-tender regularly. Sector specialization and faster credit decisioning materially reduce buyer leverage.
Institutional investors and brokerage clients
Brokerage and asset-management clients compare execution quality, research depth and fees when choosing JB Financial; institutional clients push for block liquidity, prime services and competitive commissions. Retail investors remain highly fee-sensitive and prioritize platform UX. Differentiated proprietary research and exclusive product access allow JB Financial to charge modest premiums to select client segments.
Sensitivity to service quality
Outage intolerance in payments and mobile banking gives JB Financial Group customers strong leverage to demand strict SLAs and compensation; with 96% smartphone penetration in South Korea (2024), disruptions rapidly affect transaction volumes. Negative experiences amplify via social channels, accelerating attrition, while customers increasingly expect 24/7 support and seamless omni-channel journeys. Superior CX and rapid incident response materially blunt this bargaining power.
- Expectations: 99.9% uptime SLAs
- Market reality: 96% smartphone penetration (2024)
- Risk: fast social amplification driving churn
Regulated consumer protections
Korean Financial Consumer Protection Act (2020) and the 2021 legal cap on loan interest at 20% enforce APR disclosure, complaint redress and refinancing options, strengthening buyers’ leverage on pricing and terms. Caps and mandated disclosures limit upselling flexibility, while clear communication and compliant product design support trust and retention.
- FCPA 2020: mandatory disclosure, complaint channels
- Interest cap 20% (2021)
- Refinancing rights improve customer leverage
- Disclosure limits upsell, boosts retention
Customers wield high bargaining power: 96% mobile reach, 20% APR cap, 99.9% SLA
Customers hold elevated bargaining power: low switching costs from open banking and three dominant internet banks (KakaoBank, K-Bank, Toss Bank) drive price sensitivity; corporate clients leverage multi-banking for spreads while retail demands UX and low fees. Regulatory caps (20% APR) and 96% smartphone penetration (2024) amplify expectations for 99.9% uptime and rapid redress.
| Metric | Value | Implication |
|---|---|---|
| Smartphone penetration (2024) | 96% | High churn risk |
| Internet banks | 3 | Low switching cost |
| Interest cap | 20% | Limits pricing |
| Expected SLA | 99.9% | Service pressure |
What You See Is What You Get
JB Financial Group Porter's Five Forces Analysis
This Porter’s Five Forces analysis of JB Financial Group evaluates competitive rivalry, supplier and buyer power, threat of substitutes, and barriers to entry to inform strategic decisions. It highlights key risks and opportunities with evidence-based insights and actionable implications. The preview shown is the exact, fully formatted document you’ll receive instantly after purchase.
Original: $10.00
-65%$10.00
$3.50Description
Don't Miss the Bigger Picture
JB Financial Group faces moderate buyer power, regulatory-driven supplier constraints, and evolving fintech substitutes that could reshape margins; established scale limits entrant threats but heightens competitive rivalry. This brief snapshot only scratches the surface. Unlock the full Porter's Five Forces Analysis to explore JB Financial Group’s competitive dynamics, market pressures, and strategic advantages in detail.
Suppliers Bargaining Power
Concentrated core tech vendors
JB Financial Group relies on a small set of core banking, securities and risk-IT platforms, giving vendors leverage over pricing and upgrade terms; core replacements typically cost $50–200M and take 2–5 years, reinforcing vendor stickiness. Vendors can shape roadmaps and service levels, slowing product rollouts. Multi-vendor strategies and growing in-house capabilities partially offset this power.
Wholesale and interbank funding
Beyond core deposits, JB Financial taps wholesale markets, bond investors and interbank lines that can reprice rapidly, increasing supplier leverage during stress. In tightening or risk-off periods spreads widen and covenants tighten, elevating supplier power and funding cost volatility. Diversified maturities, stable liquidity buffers and its regional deposit franchise and investment-grade standing mitigate but do not eliminate this exposure.
Payment and card networks
Card schemes and payment rails remain concentrated—Visa and Mastercard account for roughly 75% of global branded card volume in 2024—letting scheme fees and rules be largely dictated to issuers and acquirers. Scheme and processor fees (typically 0.1–2.0% per transaction), plus compliance, fraud tools and tokenization, add mandatory cost layers with few substitutes. Scale discounts favor larger peers, squeezing margins for mid‑sized groups; strategic partnerships and intra‑group volume aggregation can partially offset fees.
Data, credit bureaus, and market data
Access to credit bureaus and KYC/AML datasets is concentrated among three global credit bureaus (Experian, TransUnion, Equifax) and a few market-data vendors (Bloomberg, Refinitiv, S&P), creating high supplier leverage for JB Financial; license hikes or restrictions can cascade across subsidiaries, and vendor lock-in stems from model calibration and regulator-approved datasets tied to specific feeds.
- Concentration: three major credit bureaus
- Key vendors: Bloomberg, Refinitiv, S&P
- Risk: cascading license/price impact
- Mitigation: enterprise-wide contracting
Skilled talent and consulting
Specialist risk, digital, and regulatory talent is scarce in South Korea, giving labor suppliers meaningful bargaining power; JB Financial Group faces wage inflation and retention bonuses concentrated in Seoul’s finance-tech corridor. Critical transformation projects frequently rely on external consultants who command premium rates, increasing operating costs. South Korea sustained high R&D intensity (~4.5% of GDP in 2023–24), underscoring competition for skilled talent.
- High supplier leverage
- Wage inflation & retention bonuses concentrated in Seoul
- Premium consultant rates for critical projects
- Internal training and regional employer branding mitigate dependence
Supplier concentration: core IT swaps $50–200M, card share ~75%, 3 bureaus
Suppliers wield high leverage: core banking swaps cost $50–200M and take 2–5 years, while Visa/Mastercard control ~75% of branded card volume (2024), and three major credit bureaus dominate data feeds. Wholesale funding reprice risk raises vulnerability in stress despite investment‑grade standing and liquidity buffers. Talent scarcity in Seoul and premium consultants lift operating costs.
| Metric | Value (year) |
|---|---|
| Core IT replacement | $50–200M, 2–5 yrs |
| Card scheme share | ~75% (2024) |
| Credit bureaus | 3 major providers |
| R&D intensity (KOR) | ~4.5% GDP (2023–24) |
What is included in the product
Detailed Word Document
Tailored Porter's Five Forces analysis for JB Financial Group that uncovers competitive drivers, customer and supplier power, and market entry barriers. Identifies disruptive threats, substitutes, and strategic levers affecting pricing, profitability, and long-term market position.
Customizable Excel Spreadsheet
A one-sheet Porter’s Five Forces for JB Financial Group visualizes competitive pressure with a spider chart and customizable intensity levels, letting executives quickly spot threats, model scenarios, and paste clear slides into decks—no macros required.
Customers Bargaining Power
Low switching costs in retail
Low switching costs are driven by digital onboarding, open banking APIs and comparison apps that let retail customers move deposits and loans in minutes; smartphone penetration in Korea near 95% in 2024 magnifies this ease. Rate and fee transparency raises price sensitivity, while KakaoBank, K-Bank and Toss Bank—three dominant internet banks—amplify churn via superior UX and promotions. Strong local loyalty in Jeonbuk cushions some outflow, but nationwide competition increases buyer leverage.
SME and corporate bargaining
Corporate and SME clients exert strong bargaining power by negotiating loan spreads, collateral and fees through multi-banking, forcing JB Financial to compete on pricing and service depth. Bundling cash management, FX and trade finance has become table stakes to retain mandates, while deep relationships can win deals even as clients re-tender regularly. Sector specialization and faster credit decisioning materially reduce buyer leverage.
Institutional investors and brokerage clients
Brokerage and asset-management clients compare execution quality, research depth and fees when choosing JB Financial; institutional clients push for block liquidity, prime services and competitive commissions. Retail investors remain highly fee-sensitive and prioritize platform UX. Differentiated proprietary research and exclusive product access allow JB Financial to charge modest premiums to select client segments.
Sensitivity to service quality
Outage intolerance in payments and mobile banking gives JB Financial Group customers strong leverage to demand strict SLAs and compensation; with 96% smartphone penetration in South Korea (2024), disruptions rapidly affect transaction volumes. Negative experiences amplify via social channels, accelerating attrition, while customers increasingly expect 24/7 support and seamless omni-channel journeys. Superior CX and rapid incident response materially blunt this bargaining power.
- Expectations: 99.9% uptime SLAs
- Market reality: 96% smartphone penetration (2024)
- Risk: fast social amplification driving churn
Regulated consumer protections
Korean Financial Consumer Protection Act (2020) and the 2021 legal cap on loan interest at 20% enforce APR disclosure, complaint redress and refinancing options, strengthening buyers’ leverage on pricing and terms. Caps and mandated disclosures limit upselling flexibility, while clear communication and compliant product design support trust and retention.
- FCPA 2020: mandatory disclosure, complaint channels
- Interest cap 20% (2021)
- Refinancing rights improve customer leverage
- Disclosure limits upsell, boosts retention
Customers wield high bargaining power: 96% mobile reach, 20% APR cap, 99.9% SLA
Customers hold elevated bargaining power: low switching costs from open banking and three dominant internet banks (KakaoBank, K-Bank, Toss Bank) drive price sensitivity; corporate clients leverage multi-banking for spreads while retail demands UX and low fees. Regulatory caps (20% APR) and 96% smartphone penetration (2024) amplify expectations for 99.9% uptime and rapid redress.
| Metric | Value | Implication |
|---|---|---|
| Smartphone penetration (2024) | 96% | High churn risk |
| Internet banks | 3 | Low switching cost |
| Interest cap | 20% | Limits pricing |
| Expected SLA | 99.9% | Service pressure |
What You See Is What You Get
JB Financial Group Porter's Five Forces Analysis
This Porter’s Five Forces analysis of JB Financial Group evaluates competitive rivalry, supplier and buyer power, threat of substitutes, and barriers to entry to inform strategic decisions. It highlights key risks and opportunities with evidence-based insights and actionable implications. The preview shown is the exact, fully formatted document you’ll receive instantly after purchase.











