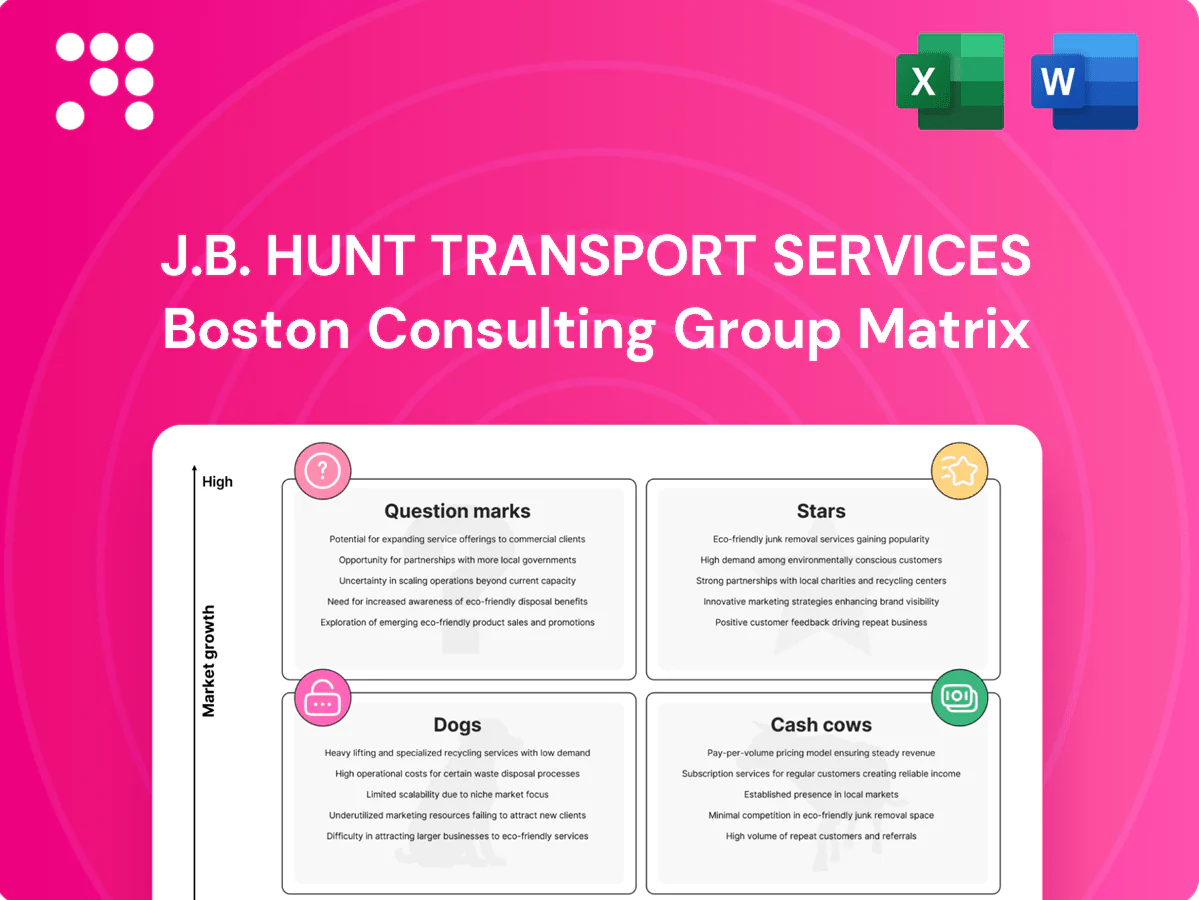
J.B. Hunt Transport Services Boston Consulting Group Matrix

Actionable Strategy Starts Here
J.B. Hunt’s BCG Matrix preview shows where its core services sit in a shifting freight market—some lanes look like Stars, others feel more like Cash Cows, and a few segments raise real questions. Want the full picture with quadrant-by-quadrant placement, data-driven recommendations, and clear moves for capital allocation? Purchase the complete BCG Matrix for a ready-to-use Word report and Excel summary that saves you time and guides smarter strategy.
Stars

Intermodal (JBI) leadership
Intermodal (JBI) sits in high-share, high-growth pockets as shippers shift to rail for lower cost and about 75% less CO2 per ton-mile; JBI drives roughly half of J.B. Hunt’s network strength. Strong rail partnerships and a container/chassis fleet exceeding 300,000 units sustain the flywheel. Ongoing capex of hundreds of millions annually in boxes, chassis, drayage and tech is required; sustain leadership now and it converts to a cash cow as growth moderates.
Final Mile (big & bulky)
E-commerce pushes oversized home delivery up and right, with US e-commerce penetration near 22% in 2024 and big-and-bulky volumes rising materially. JBH’s nationwide network and white-glove capability are hard to replicate, underpinning its Final Mile star status. It still needs investment in density, scheduling tech, and customer experience. At scale unit economics tighten and the segment helps JBH exceed $15B in 2024 revenue and generate cash.

J.B. Hunt 360 digital marketplace
J.B. Hunt 360, launched in 2016 by JBHT, shows rapid adoption with platform-led pricing and rising liquidity creating data moats that compound advantages. Network effects drive lower cost-to-serve and better matching across shippers and carriers. The platform is cash-hungry now—funding engineering, carrier incentives and TMS integrations. If share holds, 360 can become the control tower for the company’s logistics ecosystem.

Premium intermodal lanes (port + inland hubs)
Premium intermodal lanes (port + inland hubs) sit as Stars for J.B. Hunt as 2024 saw volumes rise with nearshoring and shifted port flows, supporting an estimated 13.8 billion USD company revenue and rising intermodal contribution; service reliability and container availability drive pricing power and yield expansion.
Continuous coordination with rail partners and dray fleets is required to defend share; margin profile strengthened through 2024 as operational scale and premium lane density improved.
- Volume growth: nearshoring-driven lane expansion
- Pricing power: reliability + box availability
- Ops risk: rail and dray coordination needed
- Outcome: defend share, margins improve over time
Dedicated e-commerce fleets
Dedicated e-commerce fleets secure guaranteed capacity and on-time performance for retailers, especially in peak windows; contracted fleets with embedded operations teams convert that reliability into sticky, recurring revenue. These services demand continuous driver recruiting, advanced routing technology, and owned/leased assets. Scale converts variable peak chaos into predictable margin expansion.
- Retailer need: guaranteed capacity
- Revenue: sticky via contracts
- Ops: embedded teams
- Requires: recruiting, routing tech, assets
- Outcome: scale → dependable profit
>300,000 IM scale + 22% final-mile e-comm lift margins
Intermodal (JBI) and Final Mile are Stars: JBI drives network strength with >300,000 boxes/chassis and fuels margin expansion; Final Mile benefits from ~22% US e-commerce penetration in 2024 and scale economics. 360 platform grows liquidity and control-tower potential but requires heavy tech and incentive spend; premium lanes lifted JBH to ~$13.8B revenue in 2024.
| Segment | 2024 Metric | Key Impact |
|---|---|---|
| Intermodal | >300,000 units | Network leverage, pricing power |
| Final Mile | 22% e-comm pen. | Volume growth, sticky contracts |
| 360 | Platform liquidity ↑ | Data moat, cash burn |
What is included in the product
 Detailed Word Document
Comprehensive BCG Matrix for J.B. Hunt: identifies Stars, Cash Cows, Question Marks, Dogs with strategic investment, hold, or divest moves.

 Customizable Excel Spreadsheet
One-page BCG Matrix for J.B. Hunt — quadrant view, export-ready for C-suite decks and printable A4 PDFs.
Cash Cows

Dedicated Contract Services (DCS)
Dedicated Contract Services delivers long-term, often 3–5 year contracts with predictable volumes and high switching costs, making it a stable cash cow for J.B. Hunt as of 2024. When executed tightly it is mature, margin-accretive and supports corporate liquidity. It needs modest ongoing investment in safety, maintenance and optimization tools rather than heavy capex. Milk for cash while guarding service levels to protect contract renewal economics.
Core enterprise accounts
Core enterprise accounts
Deep relationships across retail, CPG, and industrials generate steady lanes, supporting J.B. Hunt’s contract backbone that helped deliver roughly $3.9B in revenue in Q3 2024. Procurement cycles favor incumbents with KPI discipline, boosting renewal rates and lowering churn. Low incremental selling cost once embedded makes these high-margin cash cows; protect incumbency and upsell where earned.
High-density regional intermodal
High-density regional intermodal operates on established corridors with repeatable turns and reliable dray, cutting empty miles and dwell and supporting predictable weekly utilization. In 2024 the intermodal portfolio contributed about $6.2 billion in revenue and delivered solid mid-single-digit to low-double-digit margins, reflecting steady cash generation. Growth is moderate; maintain assets, keep service tight, and harvest cash.

Drop-trailer and pool programs
Drop-trailer and pool programs anchor J.B. Hunt as cash cows by locking in long-term shipper volume through asset pools that smooth operations and reduce carrier uncertainty; in 2024 J.B. Hunt reported roughly $14.6 billion in revenue, with dedicated and intermodal solutions driving stable contract flows.
Mature processes yield predictable utilization and fewer surprises, cutting churn and marketing spend—operational excellence, not sales, preserves margin.
Incremental investments in yard visibility and telematics expand the competitive moat by raising switching costs and improving turn times.
- High retention: program-based volume stability
- Low incremental marketing: ops-driven margins
- Predictable utilization: fewer service surprises
- Tech-enabled moat: yard visibility, telematics
Fleet maintenance & safety infrastructure
Fleet maintenance and safety infrastructure at J.B. Hunt drive lower unit cost through scaled shops, parts buying power and integrated safety systems; in 2024 the company sustained network cash generation alongside $16.3B revenue, underscoring stable, ongoing cash contribution. Capex is light relative to payoff at scale; continued investment in uptime and telematics yields incremental ROI and lower downtime.
- Scaled shops: centralized maintenance lowers per-unit cost
- Parts buying power: bulk procurement reduces input prices
- Safety systems: fewer incidents, lower claims
- Capex light: high cash conversion
- Focus: uptime and telematics for marginal gains
Dedicated and intermodal fuel steady margins — Q3 dedicated $3.9B, intermodal $6.2B
Dedicated contract services, core enterprise accounts and high-density intermodal function as J.B. Hunt cash cows in 2024, driving predictable margins and liquidity. Q3 dedicated revenue ~3.9B; intermodal ~6.2B; company FY revenue ~16.3B, supporting high cash conversion. Focus: modest capex, maintenance, telematics to sustain renewals.
| Metric | 2024 |
|---|---|
| Dedicated Q3 | $3.9B |
| Intermodal | $6.2B |
| Company FY | $16.3B |
Delivered as Shown
J.B. Hunt Transport Services BCG Matrix
The J.B. Hunt Transport Services BCG Matrix you’re previewing is the exact same final file you’ll get after purchase. No watermarks, no demo labels—just a fully formatted report built for strategic clarity. It includes market-backed positioning and clear recommendations you can present or edit immediately. Buy once and download instantly—no surprises, no revisions needed.

Actionable Strategy Starts Here
J.B. Hunt’s BCG Matrix preview shows where its core services sit in a shifting freight market—some lanes look like Stars, others feel more like Cash Cows, and a few segments raise real questions. Want the full picture with quadrant-by-quadrant placement, data-driven recommendations, and clear moves for capital allocation? Purchase the complete BCG Matrix for a ready-to-use Word report and Excel summary that saves you time and guides smarter strategy.
Stars
Intermodal (JBI) leadership
Intermodal (JBI) sits in high-share, high-growth pockets as shippers shift to rail for lower cost and about 75% less CO2 per ton-mile; JBI drives roughly half of J.B. Hunt’s network strength. Strong rail partnerships and a container/chassis fleet exceeding 300,000 units sustain the flywheel. Ongoing capex of hundreds of millions annually in boxes, chassis, drayage and tech is required; sustain leadership now and it converts to a cash cow as growth moderates.
Final Mile (big & bulky)
E-commerce pushes oversized home delivery up and right, with US e-commerce penetration near 22% in 2024 and big-and-bulky volumes rising materially. JBH’s nationwide network and white-glove capability are hard to replicate, underpinning its Final Mile star status. It still needs investment in density, scheduling tech, and customer experience. At scale unit economics tighten and the segment helps JBH exceed $15B in 2024 revenue and generate cash.
J.B. Hunt 360 digital marketplace
J.B. Hunt 360, launched in 2016 by JBHT, shows rapid adoption with platform-led pricing and rising liquidity creating data moats that compound advantages. Network effects drive lower cost-to-serve and better matching across shippers and carriers. The platform is cash-hungry now—funding engineering, carrier incentives and TMS integrations. If share holds, 360 can become the control tower for the company’s logistics ecosystem.
Premium intermodal lanes (port + inland hubs)
Premium intermodal lanes (port + inland hubs) sit as Stars for J.B. Hunt as 2024 saw volumes rise with nearshoring and shifted port flows, supporting an estimated 13.8 billion USD company revenue and rising intermodal contribution; service reliability and container availability drive pricing power and yield expansion.
Continuous coordination with rail partners and dray fleets is required to defend share; margin profile strengthened through 2024 as operational scale and premium lane density improved.
- Volume growth: nearshoring-driven lane expansion
- Pricing power: reliability + box availability
- Ops risk: rail and dray coordination needed
- Outcome: defend share, margins improve over time
Dedicated e-commerce fleets
Dedicated e-commerce fleets secure guaranteed capacity and on-time performance for retailers, especially in peak windows; contracted fleets with embedded operations teams convert that reliability into sticky, recurring revenue. These services demand continuous driver recruiting, advanced routing technology, and owned/leased assets. Scale converts variable peak chaos into predictable margin expansion.
- Retailer need: guaranteed capacity
- Revenue: sticky via contracts
- Ops: embedded teams
- Requires: recruiting, routing tech, assets
- Outcome: scale → dependable profit
>300,000 IM scale + 22% final-mile e-comm lift margins
Intermodal (JBI) and Final Mile are Stars: JBI drives network strength with >300,000 boxes/chassis and fuels margin expansion; Final Mile benefits from ~22% US e-commerce penetration in 2024 and scale economics. 360 platform grows liquidity and control-tower potential but requires heavy tech and incentive spend; premium lanes lifted JBH to ~$13.8B revenue in 2024.
| Segment | 2024 Metric | Key Impact |
|---|---|---|
| Intermodal | >300,000 units | Network leverage, pricing power |
| Final Mile | 22% e-comm pen. | Volume growth, sticky contracts |
| 360 | Platform liquidity ↑ | Data moat, cash burn |
What is included in the product
Detailed Word Document
Comprehensive BCG Matrix for J.B. Hunt: identifies Stars, Cash Cows, Question Marks, Dogs with strategic investment, hold, or divest moves.
Customizable Excel Spreadsheet
One-page BCG Matrix for J.B. Hunt — quadrant view, export-ready for C-suite decks and printable A4 PDFs.
Cash Cows
Dedicated Contract Services (DCS)
Dedicated Contract Services delivers long-term, often 3–5 year contracts with predictable volumes and high switching costs, making it a stable cash cow for J.B. Hunt as of 2024. When executed tightly it is mature, margin-accretive and supports corporate liquidity. It needs modest ongoing investment in safety, maintenance and optimization tools rather than heavy capex. Milk for cash while guarding service levels to protect contract renewal economics.
Core enterprise accounts
Core enterprise accounts
Deep relationships across retail, CPG, and industrials generate steady lanes, supporting J.B. Hunt’s contract backbone that helped deliver roughly $3.9B in revenue in Q3 2024. Procurement cycles favor incumbents with KPI discipline, boosting renewal rates and lowering churn. Low incremental selling cost once embedded makes these high-margin cash cows; protect incumbency and upsell where earned.
High-density regional intermodal
High-density regional intermodal operates on established corridors with repeatable turns and reliable dray, cutting empty miles and dwell and supporting predictable weekly utilization. In 2024 the intermodal portfolio contributed about $6.2 billion in revenue and delivered solid mid-single-digit to low-double-digit margins, reflecting steady cash generation. Growth is moderate; maintain assets, keep service tight, and harvest cash.
Drop-trailer and pool programs
Drop-trailer and pool programs anchor J.B. Hunt as cash cows by locking in long-term shipper volume through asset pools that smooth operations and reduce carrier uncertainty; in 2024 J.B. Hunt reported roughly $14.6 billion in revenue, with dedicated and intermodal solutions driving stable contract flows.
Mature processes yield predictable utilization and fewer surprises, cutting churn and marketing spend—operational excellence, not sales, preserves margin.
Incremental investments in yard visibility and telematics expand the competitive moat by raising switching costs and improving turn times.
- High retention: program-based volume stability
- Low incremental marketing: ops-driven margins
- Predictable utilization: fewer service surprises
- Tech-enabled moat: yard visibility, telematics
Fleet maintenance & safety infrastructure
Fleet maintenance and safety infrastructure at J.B. Hunt drive lower unit cost through scaled shops, parts buying power and integrated safety systems; in 2024 the company sustained network cash generation alongside $16.3B revenue, underscoring stable, ongoing cash contribution. Capex is light relative to payoff at scale; continued investment in uptime and telematics yields incremental ROI and lower downtime.
- Scaled shops: centralized maintenance lowers per-unit cost
- Parts buying power: bulk procurement reduces input prices
- Safety systems: fewer incidents, lower claims
- Capex light: high cash conversion
- Focus: uptime and telematics for marginal gains
Dedicated and intermodal fuel steady margins — Q3 dedicated $3.9B, intermodal $6.2B
Dedicated contract services, core enterprise accounts and high-density intermodal function as J.B. Hunt cash cows in 2024, driving predictable margins and liquidity. Q3 dedicated revenue ~3.9B; intermodal ~6.2B; company FY revenue ~16.3B, supporting high cash conversion. Focus: modest capex, maintenance, telematics to sustain renewals.
| Metric | 2024 |
|---|---|
| Dedicated Q3 | $3.9B |
| Intermodal | $6.2B |
| Company FY | $16.3B |
Delivered as Shown
J.B. Hunt Transport Services BCG Matrix
The J.B. Hunt Transport Services BCG Matrix you’re previewing is the exact same final file you’ll get after purchase. No watermarks, no demo labels—just a fully formatted report built for strategic clarity. It includes market-backed positioning and clear recommendations you can present or edit immediately. Buy once and download instantly—no surprises, no revisions needed.
Original: $10.00
-65%$10.00
$3.50Description
Actionable Strategy Starts Here
J.B. Hunt’s BCG Matrix preview shows where its core services sit in a shifting freight market—some lanes look like Stars, others feel more like Cash Cows, and a few segments raise real questions. Want the full picture with quadrant-by-quadrant placement, data-driven recommendations, and clear moves for capital allocation? Purchase the complete BCG Matrix for a ready-to-use Word report and Excel summary that saves you time and guides smarter strategy.
Stars
Intermodal (JBI) leadership
Intermodal (JBI) sits in high-share, high-growth pockets as shippers shift to rail for lower cost and about 75% less CO2 per ton-mile; JBI drives roughly half of J.B. Hunt’s network strength. Strong rail partnerships and a container/chassis fleet exceeding 300,000 units sustain the flywheel. Ongoing capex of hundreds of millions annually in boxes, chassis, drayage and tech is required; sustain leadership now and it converts to a cash cow as growth moderates.
Final Mile (big & bulky)
E-commerce pushes oversized home delivery up and right, with US e-commerce penetration near 22% in 2024 and big-and-bulky volumes rising materially. JBH’s nationwide network and white-glove capability are hard to replicate, underpinning its Final Mile star status. It still needs investment in density, scheduling tech, and customer experience. At scale unit economics tighten and the segment helps JBH exceed $15B in 2024 revenue and generate cash.
J.B. Hunt 360 digital marketplace
J.B. Hunt 360, launched in 2016 by JBHT, shows rapid adoption with platform-led pricing and rising liquidity creating data moats that compound advantages. Network effects drive lower cost-to-serve and better matching across shippers and carriers. The platform is cash-hungry now—funding engineering, carrier incentives and TMS integrations. If share holds, 360 can become the control tower for the company’s logistics ecosystem.
Premium intermodal lanes (port + inland hubs)
Premium intermodal lanes (port + inland hubs) sit as Stars for J.B. Hunt as 2024 saw volumes rise with nearshoring and shifted port flows, supporting an estimated 13.8 billion USD company revenue and rising intermodal contribution; service reliability and container availability drive pricing power and yield expansion.
Continuous coordination with rail partners and dray fleets is required to defend share; margin profile strengthened through 2024 as operational scale and premium lane density improved.
- Volume growth: nearshoring-driven lane expansion
- Pricing power: reliability + box availability
- Ops risk: rail and dray coordination needed
- Outcome: defend share, margins improve over time
Dedicated e-commerce fleets
Dedicated e-commerce fleets secure guaranteed capacity and on-time performance for retailers, especially in peak windows; contracted fleets with embedded operations teams convert that reliability into sticky, recurring revenue. These services demand continuous driver recruiting, advanced routing technology, and owned/leased assets. Scale converts variable peak chaos into predictable margin expansion.
- Retailer need: guaranteed capacity
- Revenue: sticky via contracts
- Ops: embedded teams
- Requires: recruiting, routing tech, assets
- Outcome: scale → dependable profit
>300,000 IM scale + 22% final-mile e-comm lift margins
Intermodal (JBI) and Final Mile are Stars: JBI drives network strength with >300,000 boxes/chassis and fuels margin expansion; Final Mile benefits from ~22% US e-commerce penetration in 2024 and scale economics. 360 platform grows liquidity and control-tower potential but requires heavy tech and incentive spend; premium lanes lifted JBH to ~$13.8B revenue in 2024.
| Segment | 2024 Metric | Key Impact |
|---|---|---|
| Intermodal | >300,000 units | Network leverage, pricing power |
| Final Mile | 22% e-comm pen. | Volume growth, sticky contracts |
| 360 | Platform liquidity ↑ | Data moat, cash burn |
What is included in the product
Detailed Word Document
Comprehensive BCG Matrix for J.B. Hunt: identifies Stars, Cash Cows, Question Marks, Dogs with strategic investment, hold, or divest moves.
Customizable Excel Spreadsheet
One-page BCG Matrix for J.B. Hunt — quadrant view, export-ready for C-suite decks and printable A4 PDFs.
Cash Cows
Dedicated Contract Services (DCS)
Dedicated Contract Services delivers long-term, often 3–5 year contracts with predictable volumes and high switching costs, making it a stable cash cow for J.B. Hunt as of 2024. When executed tightly it is mature, margin-accretive and supports corporate liquidity. It needs modest ongoing investment in safety, maintenance and optimization tools rather than heavy capex. Milk for cash while guarding service levels to protect contract renewal economics.
Core enterprise accounts
Core enterprise accounts
Deep relationships across retail, CPG, and industrials generate steady lanes, supporting J.B. Hunt’s contract backbone that helped deliver roughly $3.9B in revenue in Q3 2024. Procurement cycles favor incumbents with KPI discipline, boosting renewal rates and lowering churn. Low incremental selling cost once embedded makes these high-margin cash cows; protect incumbency and upsell where earned.
High-density regional intermodal
High-density regional intermodal operates on established corridors with repeatable turns and reliable dray, cutting empty miles and dwell and supporting predictable weekly utilization. In 2024 the intermodal portfolio contributed about $6.2 billion in revenue and delivered solid mid-single-digit to low-double-digit margins, reflecting steady cash generation. Growth is moderate; maintain assets, keep service tight, and harvest cash.
Drop-trailer and pool programs
Drop-trailer and pool programs anchor J.B. Hunt as cash cows by locking in long-term shipper volume through asset pools that smooth operations and reduce carrier uncertainty; in 2024 J.B. Hunt reported roughly $14.6 billion in revenue, with dedicated and intermodal solutions driving stable contract flows.
Mature processes yield predictable utilization and fewer surprises, cutting churn and marketing spend—operational excellence, not sales, preserves margin.
Incremental investments in yard visibility and telematics expand the competitive moat by raising switching costs and improving turn times.
- High retention: program-based volume stability
- Low incremental marketing: ops-driven margins
- Predictable utilization: fewer service surprises
- Tech-enabled moat: yard visibility, telematics
Fleet maintenance & safety infrastructure
Fleet maintenance and safety infrastructure at J.B. Hunt drive lower unit cost through scaled shops, parts buying power and integrated safety systems; in 2024 the company sustained network cash generation alongside $16.3B revenue, underscoring stable, ongoing cash contribution. Capex is light relative to payoff at scale; continued investment in uptime and telematics yields incremental ROI and lower downtime.
- Scaled shops: centralized maintenance lowers per-unit cost
- Parts buying power: bulk procurement reduces input prices
- Safety systems: fewer incidents, lower claims
- Capex light: high cash conversion
- Focus: uptime and telematics for marginal gains
Dedicated and intermodal fuel steady margins — Q3 dedicated $3.9B, intermodal $6.2B
Dedicated contract services, core enterprise accounts and high-density intermodal function as J.B. Hunt cash cows in 2024, driving predictable margins and liquidity. Q3 dedicated revenue ~3.9B; intermodal ~6.2B; company FY revenue ~16.3B, supporting high cash conversion. Focus: modest capex, maintenance, telematics to sustain renewals.
| Metric | 2024 |
|---|---|
| Dedicated Q3 | $3.9B |
| Intermodal | $6.2B |
| Company FY | $16.3B |
Delivered as Shown
J.B. Hunt Transport Services BCG Matrix
The J.B. Hunt Transport Services BCG Matrix you’re previewing is the exact same final file you’ll get after purchase. No watermarks, no demo labels—just a fully formatted report built for strategic clarity. It includes market-backed positioning and clear recommendations you can present or edit immediately. Buy once and download instantly—no surprises, no revisions needed.











