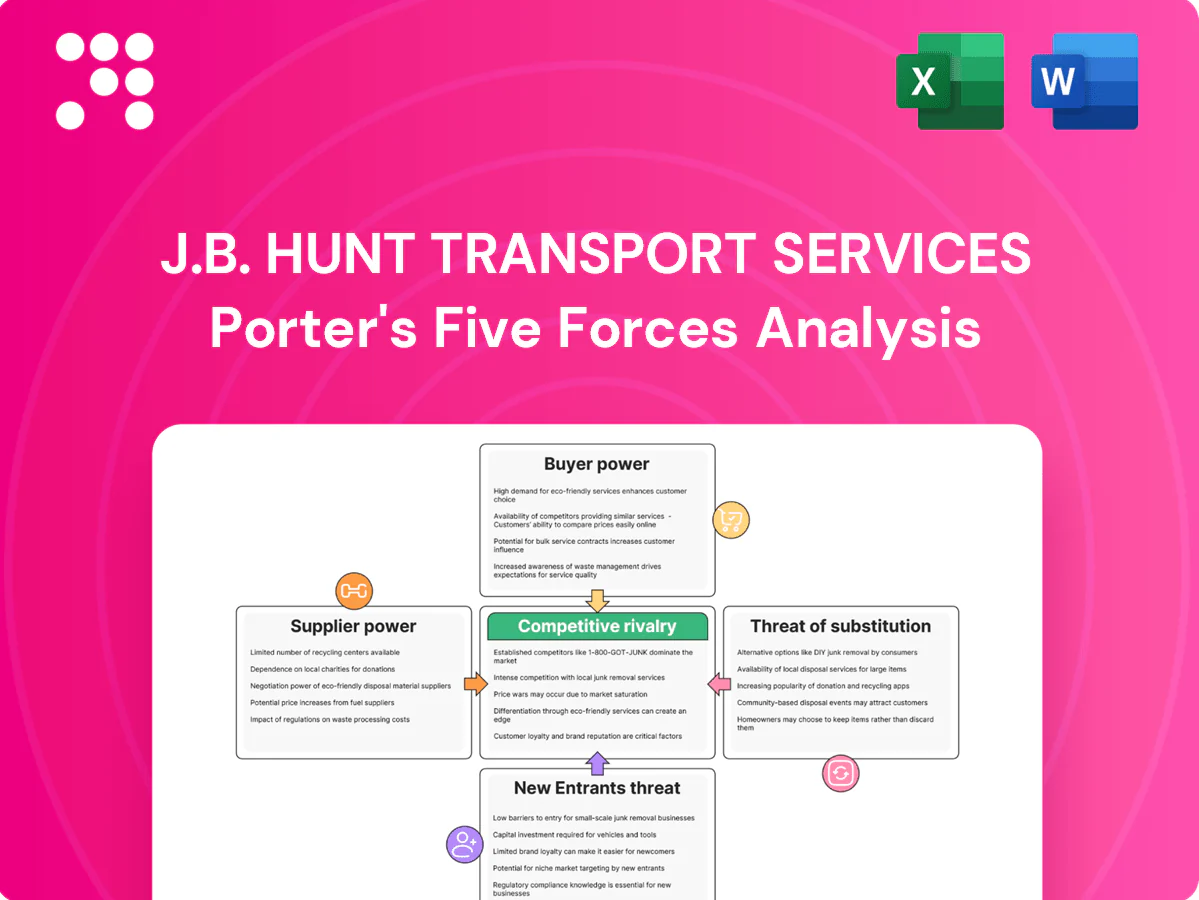
J.B. Hunt Transport Services Porter's Five Forces Analysis

Go Beyond the Preview—Access the Full Strategic Report
J.B. Hunt operates in a capital‑intensive, consolidation‑driven freight sector where buyer power is moderate and supplier power is limited by scale and contract leverage.
This brief snapshot only scratches the surface. Unlock the full Porter's Five Forces Analysis to explore J.B. Hunt Transport Services’s competitive dynamics, market pressures, and strategic advantages in detail.
Suppliers Bargaining Power

Concentrated rail partners
Intermodal depends on a few Class I railroads—there are seven in the US—concentrating bargaining power with carriers like BNSF and Norfolk Southern, which can tighten J.B. Hunt margins through service terms, access and equipment availability. J.B. Hunt mitigates this via long-standing strategic alliances and volume commitments, supporting its 2024 revenue of about $16.3 billion. Still, service disruptions or pricing actions by rail partners can quickly ripple through earnings.
Equipment and OEM dependence
Tractors, trailers, containers and chassis are concentrated among OEMs such as PACCAR, Daimler, Volvo and Navistar, which faced cyclical backlogs into 2024; emissions and advanced safety specs (AEB, tighter NOx/CO2 targets) raised unit costs and limited substitution. J.B. Hunt’s scale, standardized specs and multi‑year orders secure production priority, but tight supply windows in 2024 still pushed up prices and extended lead times.

Fuel and energy volatility
Fuel suppliers are numerous but 2024 U.S. on‑highway diesel averaged about $3.90/gal, and swift price swings can reshape J.B. Hunt economics quickly. Fuel surcharges mitigate volatility but recovery lags and customer mix cause uneven pass‑through. Efficiency investments (telematics, aero) and hedging programs partially cut exposure; sudden fuel spikes compress margins when surcharge recovery is delayed.

Labor and driver markets
Qualified drivers and technicians remain scarce, lifting wage pressure — BLS shows 1.7 million heavy and tractor-trailer drivers with a 2023 median wage of $48,310, raising labor costs for carriers; training, retention, and safety compliance further add expense and complexity. J.B. Hunt’s brand, dedicated accounts, and home-time routes improve recruitment and retention, but tight labor cycles amplify the workforce’s supplier-like power.
- High scarcity -> upward wage pressure
- Training & compliance increase operating cost
- Brand & home-time routes boost attraction
Technology and data vendors
TMS, telematics, and visibility platforms are central to J.B. Hunt service quality, with enterprise TMS implementations typically taking 6–12 months and costing roughly $250k–$3M, which creates vendor leverage because switching core systems is costly and risky. J.B. Hunt reduces lock-in by building internal capabilities and integrating multiple providers; uptime and cyber requirements—where average enterprise breach costs remain in the low millions—drive stricter terms and higher vendor fees. Integration complexity and SLAs materially shape contract pricing and renewal negotiations.
- 6–12 months typical TMS implementation
- $250k–$3M implementation cost
- Multi-vendor integration reduces single-vendor lock-in
- Cyber/uptime SLAs increase contract costs
Suppliers squeeze margins: $16.3B scale vs fuel $3.90/gal, drivers 1.7M
Suppliers exert moderate-to-high power: seven Class I railroads and OEMs (PACCAR, Volvo) constrain pricing and equipment access, while 2024 revenue of ~$16.3B and scale partially offset this. Fuel volatility (US diesel ~$3.90/gal in 2024), scarce drivers (1.7M drivers; 2023 median wage $48,310) and costly TMS integrations sustain supplier leverage.
| Metric | 2023/24 Value |
|---|---|
| J.B. Hunt Revenue | $16.3B (2024) |
| Diesel (US) | $3.90/gal (2024 avg) |
| Drivers | 1.7M; median $48,310 (2023) |
| TMS cost | $250k–$3M; 6–12 months |
What is included in the product
 Detailed Word Document
Tailored for J.B. Hunt Transport Services, this Porter's Five Forces overview uncovers competitive drivers, buyer and supplier power, entry barriers, and substitute threats to assess pricing pressure, profitability, and strategic vulnerabilities.

 Customizable Excel Spreadsheet
One-sheet Porter's Five Forces for J.B. Hunt—quickly visualize competitive pressure with a radar chart, swap in your data, and copy-ready layout for decks to accelerate strategic decisions and relieve analysis bottlenecks.
Customers Bargaining Power

Large shipper concentration
Major retailers, manufacturers and e-commerce platforms buy large volumes and run competitive RFPs, using multi-sourcing to pressure rates and service levels. J.B. Hunt counters with scale, reliability and integrated intermodal, dedicated and final-mile offerings. In 2024 J.B. Hunt reported roughly $13.5 billion in revenue, and its highest-volume accounts continue to command favorable contractual terms.
Price transparency and benchmarking
In 2024 load boards, DAT/TMC indices and broker quotes have amplified rate visibility, enabling shippers to benchmark lanes in real time and push for lower spot pricing; truckload customers can quickly shift lanes, increasing short-term bargaining leverage. Longer-term intermodal and dedicated contracts remain anchored by KPIs and minimum volumes, dampening churn. Data-driven bid processes force carriers like J.B. Hunt to maintain tight cost discipline to win profitable business.

Switching costs vary by service
Switching costs vary: truckload is relatively easy to re-source, while intermodal and LTL impose moderate frictions; J.B. Hunt's intermodal comprised roughly 35% of revenue in 2023, underlining its strategic weight.
Dedicated contracts and final-mile integrations create higher switching costs through long-term commitments and embedded assets.
Custom routing, proprietary TMS integrations and trained crews deepen customer stickiness, which reduces buyer power in those segments.

Service quality and reliability
Service quality — on-time performance, visibility, and low claims rates — drives shippers to prioritize J.B. Hunt beyond price; consistent capacity during peaks or disruptions yields repeat business. J.B. Hunt’s dense network and rail partnerships enhance resilience and recovery, reducing buyer leverage. Superior execution and integrated visibility tools constrain customers’ bargaining power.
- On-time performance
- Visibility/track-and-trace
- Low claims rates
- Network density & rail alliances
Demand cyclicality
In soft freight markets excess capacity boosts buyer power and forces rate concessions, while tight markets shift leverage to carriers with available assets; J.B. Hunt reported full-year 2024 revenue of about $16.0 billion and used a roughly 55% contract/45% spot mix to balance exposure. The firm actively manages mix between contract and spot to smooth cycles and preserve margins across demand swings, trimming volatility in operating income.
- 0. 2024 revenue ~16.0 billion
- 1. Contract/spot mix ~55/45
- 2. Mix management reduces margin volatility
- 3. Excess capacity increases buyer leverage in soft markets
Retailer volume pressures rates; carrier uses scale, intermodal, dedicated, final-mile & TMS
Large retailers and shippers wield volume-driven leverage through RFPs and real-time rate transparency, but J.B. Hunt offsets pressure with scale, integrated intermodal/dedicated/final-mile solutions and TMS integrations. In 2024 J.B. Hunt reported about $16.0B revenue and a ~55/45 contract-to-spot mix; buyer power rises in soft markets and falls when capacity tightens.
| Metric | Value |
|---|---|
| 2024 revenue | $16.0B |
| Contract/Spot mix | ~55/45 |
| Intermodal share (2023) | ~35% of revenue |
Preview Before You Purchase
J.B. Hunt Transport Services Porter's Five Forces Analysis
This J.B. Hunt Transport Services Porter's Five Forces analysis is the exact document you'll receive immediately after purchase—no surprises, no placeholders. It provides a professionally written, fully formatted assessment of competitive rivalry, supplier and buyer power, threats of new entrants and substitutes, and strategic implications. Download access is instant and the file is ready for immediate use.

Go Beyond the Preview—Access the Full Strategic Report
J.B. Hunt operates in a capital‑intensive, consolidation‑driven freight sector where buyer power is moderate and supplier power is limited by scale and contract leverage.
This brief snapshot only scratches the surface. Unlock the full Porter's Five Forces Analysis to explore J.B. Hunt Transport Services’s competitive dynamics, market pressures, and strategic advantages in detail.
Suppliers Bargaining Power
Concentrated rail partners
Intermodal depends on a few Class I railroads—there are seven in the US—concentrating bargaining power with carriers like BNSF and Norfolk Southern, which can tighten J.B. Hunt margins through service terms, access and equipment availability. J.B. Hunt mitigates this via long-standing strategic alliances and volume commitments, supporting its 2024 revenue of about $16.3 billion. Still, service disruptions or pricing actions by rail partners can quickly ripple through earnings.
Equipment and OEM dependence
Tractors, trailers, containers and chassis are concentrated among OEMs such as PACCAR, Daimler, Volvo and Navistar, which faced cyclical backlogs into 2024; emissions and advanced safety specs (AEB, tighter NOx/CO2 targets) raised unit costs and limited substitution. J.B. Hunt’s scale, standardized specs and multi‑year orders secure production priority, but tight supply windows in 2024 still pushed up prices and extended lead times.
Fuel and energy volatility
Fuel suppliers are numerous but 2024 U.S. on‑highway diesel averaged about $3.90/gal, and swift price swings can reshape J.B. Hunt economics quickly. Fuel surcharges mitigate volatility but recovery lags and customer mix cause uneven pass‑through. Efficiency investments (telematics, aero) and hedging programs partially cut exposure; sudden fuel spikes compress margins when surcharge recovery is delayed.
Labor and driver markets
Qualified drivers and technicians remain scarce, lifting wage pressure — BLS shows 1.7 million heavy and tractor-trailer drivers with a 2023 median wage of $48,310, raising labor costs for carriers; training, retention, and safety compliance further add expense and complexity. J.B. Hunt’s brand, dedicated accounts, and home-time routes improve recruitment and retention, but tight labor cycles amplify the workforce’s supplier-like power.
- High scarcity -> upward wage pressure
- Training & compliance increase operating cost
- Brand & home-time routes boost attraction
Technology and data vendors
TMS, telematics, and visibility platforms are central to J.B. Hunt service quality, with enterprise TMS implementations typically taking 6–12 months and costing roughly $250k–$3M, which creates vendor leverage because switching core systems is costly and risky. J.B. Hunt reduces lock-in by building internal capabilities and integrating multiple providers; uptime and cyber requirements—where average enterprise breach costs remain in the low millions—drive stricter terms and higher vendor fees. Integration complexity and SLAs materially shape contract pricing and renewal negotiations.
- 6–12 months typical TMS implementation
- $250k–$3M implementation cost
- Multi-vendor integration reduces single-vendor lock-in
- Cyber/uptime SLAs increase contract costs
Suppliers squeeze margins: $16.3B scale vs fuel $3.90/gal, drivers 1.7M
Suppliers exert moderate-to-high power: seven Class I railroads and OEMs (PACCAR, Volvo) constrain pricing and equipment access, while 2024 revenue of ~$16.3B and scale partially offset this. Fuel volatility (US diesel ~$3.90/gal in 2024), scarce drivers (1.7M drivers; 2023 median wage $48,310) and costly TMS integrations sustain supplier leverage.
| Metric | 2023/24 Value |
|---|---|
| J.B. Hunt Revenue | $16.3B (2024) |
| Diesel (US) | $3.90/gal (2024 avg) |
| Drivers | 1.7M; median $48,310 (2023) |
| TMS cost | $250k–$3M; 6–12 months |
What is included in the product
Detailed Word Document
Tailored for J.B. Hunt Transport Services, this Porter's Five Forces overview uncovers competitive drivers, buyer and supplier power, entry barriers, and substitute threats to assess pricing pressure, profitability, and strategic vulnerabilities.
Customizable Excel Spreadsheet
One-sheet Porter's Five Forces for J.B. Hunt—quickly visualize competitive pressure with a radar chart, swap in your data, and copy-ready layout for decks to accelerate strategic decisions and relieve analysis bottlenecks.
Customers Bargaining Power
Large shipper concentration
Major retailers, manufacturers and e-commerce platforms buy large volumes and run competitive RFPs, using multi-sourcing to pressure rates and service levels. J.B. Hunt counters with scale, reliability and integrated intermodal, dedicated and final-mile offerings. In 2024 J.B. Hunt reported roughly $13.5 billion in revenue, and its highest-volume accounts continue to command favorable contractual terms.
Price transparency and benchmarking
In 2024 load boards, DAT/TMC indices and broker quotes have amplified rate visibility, enabling shippers to benchmark lanes in real time and push for lower spot pricing; truckload customers can quickly shift lanes, increasing short-term bargaining leverage. Longer-term intermodal and dedicated contracts remain anchored by KPIs and minimum volumes, dampening churn. Data-driven bid processes force carriers like J.B. Hunt to maintain tight cost discipline to win profitable business.
Switching costs vary by service
Switching costs vary: truckload is relatively easy to re-source, while intermodal and LTL impose moderate frictions; J.B. Hunt's intermodal comprised roughly 35% of revenue in 2023, underlining its strategic weight.
Dedicated contracts and final-mile integrations create higher switching costs through long-term commitments and embedded assets.
Custom routing, proprietary TMS integrations and trained crews deepen customer stickiness, which reduces buyer power in those segments.
Service quality and reliability
Service quality — on-time performance, visibility, and low claims rates — drives shippers to prioritize J.B. Hunt beyond price; consistent capacity during peaks or disruptions yields repeat business. J.B. Hunt’s dense network and rail partnerships enhance resilience and recovery, reducing buyer leverage. Superior execution and integrated visibility tools constrain customers’ bargaining power.
- On-time performance
- Visibility/track-and-trace
- Low claims rates
- Network density & rail alliances
Demand cyclicality
In soft freight markets excess capacity boosts buyer power and forces rate concessions, while tight markets shift leverage to carriers with available assets; J.B. Hunt reported full-year 2024 revenue of about $16.0 billion and used a roughly 55% contract/45% spot mix to balance exposure. The firm actively manages mix between contract and spot to smooth cycles and preserve margins across demand swings, trimming volatility in operating income.
- 0. 2024 revenue ~16.0 billion
- 1. Contract/spot mix ~55/45
- 2. Mix management reduces margin volatility
- 3. Excess capacity increases buyer leverage in soft markets
Retailer volume pressures rates; carrier uses scale, intermodal, dedicated, final-mile & TMS
Large retailers and shippers wield volume-driven leverage through RFPs and real-time rate transparency, but J.B. Hunt offsets pressure with scale, integrated intermodal/dedicated/final-mile solutions and TMS integrations. In 2024 J.B. Hunt reported about $16.0B revenue and a ~55/45 contract-to-spot mix; buyer power rises in soft markets and falls when capacity tightens.
| Metric | Value |
|---|---|
| 2024 revenue | $16.0B |
| Contract/Spot mix | ~55/45 |
| Intermodal share (2023) | ~35% of revenue |
Preview Before You Purchase
J.B. Hunt Transport Services Porter's Five Forces Analysis
This J.B. Hunt Transport Services Porter's Five Forces analysis is the exact document you'll receive immediately after purchase—no surprises, no placeholders. It provides a professionally written, fully formatted assessment of competitive rivalry, supplier and buyer power, threats of new entrants and substitutes, and strategic implications. Download access is instant and the file is ready for immediate use.
Original: $10.00
-65%$10.00
$3.50Description
Go Beyond the Preview—Access the Full Strategic Report
J.B. Hunt operates in a capital‑intensive, consolidation‑driven freight sector where buyer power is moderate and supplier power is limited by scale and contract leverage.
This brief snapshot only scratches the surface. Unlock the full Porter's Five Forces Analysis to explore J.B. Hunt Transport Services’s competitive dynamics, market pressures, and strategic advantages in detail.
Suppliers Bargaining Power
Concentrated rail partners
Intermodal depends on a few Class I railroads—there are seven in the US—concentrating bargaining power with carriers like BNSF and Norfolk Southern, which can tighten J.B. Hunt margins through service terms, access and equipment availability. J.B. Hunt mitigates this via long-standing strategic alliances and volume commitments, supporting its 2024 revenue of about $16.3 billion. Still, service disruptions or pricing actions by rail partners can quickly ripple through earnings.
Equipment and OEM dependence
Tractors, trailers, containers and chassis are concentrated among OEMs such as PACCAR, Daimler, Volvo and Navistar, which faced cyclical backlogs into 2024; emissions and advanced safety specs (AEB, tighter NOx/CO2 targets) raised unit costs and limited substitution. J.B. Hunt’s scale, standardized specs and multi‑year orders secure production priority, but tight supply windows in 2024 still pushed up prices and extended lead times.
Fuel and energy volatility
Fuel suppliers are numerous but 2024 U.S. on‑highway diesel averaged about $3.90/gal, and swift price swings can reshape J.B. Hunt economics quickly. Fuel surcharges mitigate volatility but recovery lags and customer mix cause uneven pass‑through. Efficiency investments (telematics, aero) and hedging programs partially cut exposure; sudden fuel spikes compress margins when surcharge recovery is delayed.
Labor and driver markets
Qualified drivers and technicians remain scarce, lifting wage pressure — BLS shows 1.7 million heavy and tractor-trailer drivers with a 2023 median wage of $48,310, raising labor costs for carriers; training, retention, and safety compliance further add expense and complexity. J.B. Hunt’s brand, dedicated accounts, and home-time routes improve recruitment and retention, but tight labor cycles amplify the workforce’s supplier-like power.
- High scarcity -> upward wage pressure
- Training & compliance increase operating cost
- Brand & home-time routes boost attraction
Technology and data vendors
TMS, telematics, and visibility platforms are central to J.B. Hunt service quality, with enterprise TMS implementations typically taking 6–12 months and costing roughly $250k–$3M, which creates vendor leverage because switching core systems is costly and risky. J.B. Hunt reduces lock-in by building internal capabilities and integrating multiple providers; uptime and cyber requirements—where average enterprise breach costs remain in the low millions—drive stricter terms and higher vendor fees. Integration complexity and SLAs materially shape contract pricing and renewal negotiations.
- 6–12 months typical TMS implementation
- $250k–$3M implementation cost
- Multi-vendor integration reduces single-vendor lock-in
- Cyber/uptime SLAs increase contract costs
Suppliers squeeze margins: $16.3B scale vs fuel $3.90/gal, drivers 1.7M
Suppliers exert moderate-to-high power: seven Class I railroads and OEMs (PACCAR, Volvo) constrain pricing and equipment access, while 2024 revenue of ~$16.3B and scale partially offset this. Fuel volatility (US diesel ~$3.90/gal in 2024), scarce drivers (1.7M drivers; 2023 median wage $48,310) and costly TMS integrations sustain supplier leverage.
| Metric | 2023/24 Value |
|---|---|
| J.B. Hunt Revenue | $16.3B (2024) |
| Diesel (US) | $3.90/gal (2024 avg) |
| Drivers | 1.7M; median $48,310 (2023) |
| TMS cost | $250k–$3M; 6–12 months |
What is included in the product
Detailed Word Document
Tailored for J.B. Hunt Transport Services, this Porter's Five Forces overview uncovers competitive drivers, buyer and supplier power, entry barriers, and substitute threats to assess pricing pressure, profitability, and strategic vulnerabilities.
Customizable Excel Spreadsheet
One-sheet Porter's Five Forces for J.B. Hunt—quickly visualize competitive pressure with a radar chart, swap in your data, and copy-ready layout for decks to accelerate strategic decisions and relieve analysis bottlenecks.
Customers Bargaining Power
Large shipper concentration
Major retailers, manufacturers and e-commerce platforms buy large volumes and run competitive RFPs, using multi-sourcing to pressure rates and service levels. J.B. Hunt counters with scale, reliability and integrated intermodal, dedicated and final-mile offerings. In 2024 J.B. Hunt reported roughly $13.5 billion in revenue, and its highest-volume accounts continue to command favorable contractual terms.
Price transparency and benchmarking
In 2024 load boards, DAT/TMC indices and broker quotes have amplified rate visibility, enabling shippers to benchmark lanes in real time and push for lower spot pricing; truckload customers can quickly shift lanes, increasing short-term bargaining leverage. Longer-term intermodal and dedicated contracts remain anchored by KPIs and minimum volumes, dampening churn. Data-driven bid processes force carriers like J.B. Hunt to maintain tight cost discipline to win profitable business.
Switching costs vary by service
Switching costs vary: truckload is relatively easy to re-source, while intermodal and LTL impose moderate frictions; J.B. Hunt's intermodal comprised roughly 35% of revenue in 2023, underlining its strategic weight.
Dedicated contracts and final-mile integrations create higher switching costs through long-term commitments and embedded assets.
Custom routing, proprietary TMS integrations and trained crews deepen customer stickiness, which reduces buyer power in those segments.
Service quality and reliability
Service quality — on-time performance, visibility, and low claims rates — drives shippers to prioritize J.B. Hunt beyond price; consistent capacity during peaks or disruptions yields repeat business. J.B. Hunt’s dense network and rail partnerships enhance resilience and recovery, reducing buyer leverage. Superior execution and integrated visibility tools constrain customers’ bargaining power.
- On-time performance
- Visibility/track-and-trace
- Low claims rates
- Network density & rail alliances
Demand cyclicality
In soft freight markets excess capacity boosts buyer power and forces rate concessions, while tight markets shift leverage to carriers with available assets; J.B. Hunt reported full-year 2024 revenue of about $16.0 billion and used a roughly 55% contract/45% spot mix to balance exposure. The firm actively manages mix between contract and spot to smooth cycles and preserve margins across demand swings, trimming volatility in operating income.
- 0. 2024 revenue ~16.0 billion
- 1. Contract/spot mix ~55/45
- 2. Mix management reduces margin volatility
- 3. Excess capacity increases buyer leverage in soft markets
Retailer volume pressures rates; carrier uses scale, intermodal, dedicated, final-mile & TMS
Large retailers and shippers wield volume-driven leverage through RFPs and real-time rate transparency, but J.B. Hunt offsets pressure with scale, integrated intermodal/dedicated/final-mile solutions and TMS integrations. In 2024 J.B. Hunt reported about $16.0B revenue and a ~55/45 contract-to-spot mix; buyer power rises in soft markets and falls when capacity tightens.
| Metric | Value |
|---|---|
| 2024 revenue | $16.0B |
| Contract/Spot mix | ~55/45 |
| Intermodal share (2023) | ~35% of revenue |
Preview Before You Purchase
J.B. Hunt Transport Services Porter's Five Forces Analysis
This J.B. Hunt Transport Services Porter's Five Forces analysis is the exact document you'll receive immediately after purchase—no surprises, no placeholders. It provides a professionally written, fully formatted assessment of competitive rivalry, supplier and buyer power, threats of new entrants and substitutes, and strategic implications. Download access is instant and the file is ready for immediate use.











