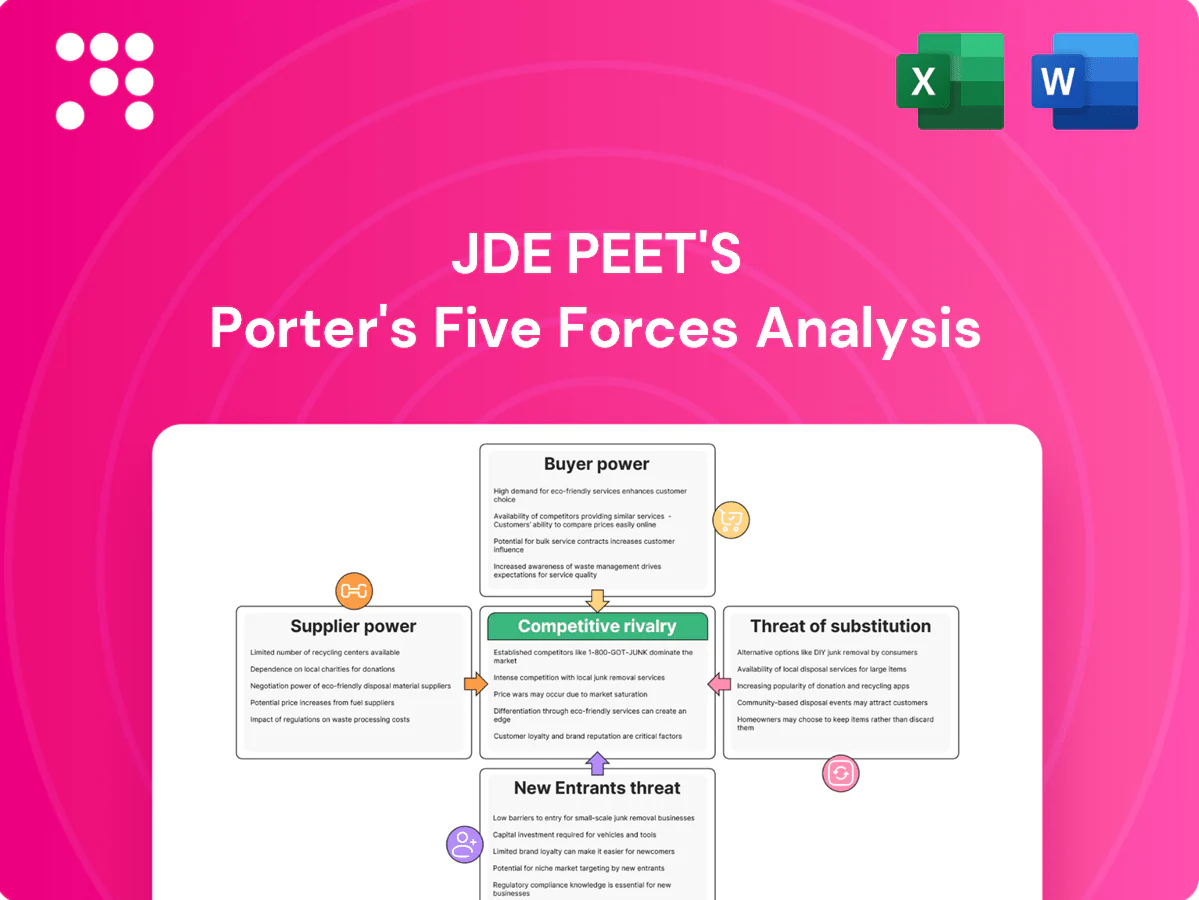
JDE Peet's Porter's Five Forces Analysis

Elevate Your Analysis with the Complete Porter's Five Forces Analysis
JDE Peet's faces intense buyer expectations, sizable supplier leverage in coffee markets, and moderate threats from substitutes and new entrants, shaping a complex competitive landscape. This brief snapshot only scratches the surface. Unlock the full Porter's Five Forces Analysis to explore detailed force ratings, visuals, and strategic implications.
Suppliers Bargaining Power

Concentrated bean origins
Arabica and Robusta supply is concentrated in a few origins—Brazil supplies roughly 35–40% of global coffee and Vietnam accounts for about 40% of world Robusta—exposing JDE Peet's to weather, disease and political shocks. Producer cooperatives and large exporters in these countries can materially influence prices and export volumes. Long-term sourcing programs and origin diversification mitigate but do not eliminate concentration risk. Certifications (Fairtrade, Rainforest Alliance) add resilience but typically raise bean costs by about 5–15%.
Commodity price volatility
Commodity price volatility is high for coffee and tea—ICE Arabica averaged about 1.80 USD/lb in 2024 while Robusta hovered near 2,000 USD/MT—so sudden spikes in futures and FX swings erode JDE Peet's margins and complicate procurement planning.
Hedging smooths near-term P&L but cannot alter upward structural cost trends; effective cost pass-through varies by channel, with retail more resilient than branded-away foodservice where competitive intensity limits price recovery.

Quality and specialty differentiation
High-grade beans and specialty lots are scarcer—specialty coffee represents roughly 10% of global production—giving niche suppliers more leverage. Premium portfolios and single-origin SKUs demand tighter specs and long-term contracts; JDE Peet's scale secures volumes but competition for top-grade supply pushes premiums often 20–50% above commodity prices. Supplier development programs can align incentives and improve traceability.

Packaging and equipment inputs
Aluminum, paper, plastics and specialty machinery vendors create non-commodity supplier exposure for JDE Peet's; input inflation and capacity constraints tightened purchasing terms across 2022–24. Multi-sourcing and long-term contracts reduce dependency, but switching costs remain for proprietary pod and capsule formats. Sustainability-driven packaging targets further narrow qualified suppliers.
- Supplier concentration: increases leverage
- Contracting: long-term deals cut spot risk
- Sustainability: limits eligible vendors
Sustainability and compliance demands
Sustainability demands—deforestation-free sourcing, full traceability and stricter ESG standards—shift bargaining power toward suppliers already certified, as JDE Peet’s 2025 commitments require deeper engagement and auditing. When certified supply is tight (estimated shortfall ~15% in 2024) compliance costs (roughly a 5–10% premium) can be passed through, raising baseline procurement costs but improving resilience.
- Certified supply shortfall ~15% (2024)
- Certification premium 5–10%
- Higher audit/engagement spend increases fixed sourcing costs
Supplier power up: Brazil 35–40% Arabica, Robusta ~40%
Bargaining power of suppliers is elevated: Brazil supplies ~35–40% of Arabica, Vietnam ~40% of Robusta, creating origin concentration risk; ICE Arabica averaged ~1.80 USD/lb in 2024 and Robusta ~2,000 USD/MT, compressing margins. Certified supply shortfall ~15% (2024) with premiums ~5–10%; specialty coffee (~10% of output) commands 20–50% premiums. Hedging and long-term contracts mitigate but do not remove supplier leverage.
| Metric | 2024 Value |
|---|---|
| Brazil Arabica share | 35–40% |
| Vietnam Robusta share | ~40% |
| ICE Arabica price | ~1.80 USD/lb |
| Robusta price | ~2,000 USD/MT |
| Certified supply shortfall | ~15% |
| Certification premium | 5–10% |
| Specialty share | ~10% (premium 20–50%) |
What is included in the product
 Detailed Word Document
Tailored Porter's Five Forces analysis for JDE Peet's uncovering competitive intensity, buyer and supplier power, threat of substitutes and entrants, and industry rivalry, with insights on pricing, margins and strategic defenses. Ideal for investor reports, strategy decks and academic use—fully editable for customization.

 Customizable Excel Spreadsheet
A concise one-sheet Porter's Five Forces for JDE Peet's—instantly visualise competitive pressure with a spider chart and customise force levels as market trends shift; clean layout ready for pitch decks, no macros required and easy to swap in your own data.
Customers Bargaining Power

Retailers and grocers’ scale
Large grocery chains, with the top four US grocers accounting for roughly 60% of the market (2023), wield strong negotiating power over price, promo funding and shelf space, forcing significant trade discounts. Private label penetration has risen in many markets, increasing retailer leverage versus branded suppliers. JDE Peet's scale and diverse brand portfolio (revenues €7.8bn in 2023) help preserve margin but trade terms remain demanding. Joint category management with retailers can partially rebalance power by aligning assortment and promotions.
Foodservice and OOH contracts
Cafes, offices and hospitality buyers negotiate on volume, equipment and service bundles, pushing JDE Peet's to tailor discounts and operating fees to large accounts. Tender-based procurement increases price pressure and requires highly specific service and billing terms. Long contracts, typically 3–5 years, improve revenue visibility but lock in pricing mechanics, while equipment placement raises switching costs and boosts retention.

Consumer price sensitivity
Inflation-driven downtrading pushed some consumers from premium to mainstream or private label during 2023–24, pressuring JDE Peet's value mix despite group revenue of about €7.7bn in 2023. Price elasticities differ by channel and brand strength, with retail shoppers more price-sensitive than out-of-home buyers. Frequent promotions (promotion intensity up in many markets in 2023) cultivate deal-seeking behavior. Loyalty programs and distinctive formats help blunt pure price competition.

E-commerce transparency
Online marketplaces enable instant price comparisons and review-driven choice, forcing JDE Peet's to defend margins on standard SKUs and accelerating mix shifts toward differentiated, premium formats; by 2024 marketplaces represented roughly 25% of global retail e-commerce, heightening price pressure. Direct-to-consumer channels offer richer first-party data but demand competitive pricing and fulfillment; subscription models can stabilize demand and cut churn, often improving CLV.
- marketplaces ≈25% of retail e‑commerce (2024)
- standard SKU margins compressed; mix shifts to premium
- DTC = data advantage but needs competitive pricing
- subscriptions reduce churn, raise CLV
Brand equity as counterweight
Iconic brands and a broad assortment give JDE Peet's negotiating leverage and justify premiums; the group reported over 50 brands in 100+ countries (company data, 2024). Taste consistency, wide availability and ongoing NPD anchor loyalty, but sustained marketing and R&D spend are required to limit private-label creep. Portfolio breadth enables tailored value propositions by segment.
- 50+ brands
- 100+ countries
- Premium pricing leverage
- Requires steady investment vs private label
Retailer bargaining and private label squeeze margins despite ≈€7.8bn scale
Large grocers (top‑4 ≈60% US market, 2023) and rising private label drive strong retailer bargaining, forcing trade discounts despite JDE Peet's scale (revenues ≈€7.8bn, 2023) and 50+ brands across 100+ countries (2024). Out‑of‑home tenders and equipment deals pressure pricing but raise switching costs; online marketplaces (~25% retail e‑commerce, 2024) increase price transparency. DTC/subscriptions and NPD partially restore mix and margin.
| Metric | 2023/24 |
|---|---|
| Revenue | ≈€7.8bn (2023) |
| Brands/Countries | 50+ / 100+ |
| Top‑4 US grocers | ≈60% market (2023) |
| Marketplaces | ≈25% retail e‑commerce (2024) |
Full Version Awaits
JDE Peet's Porter's Five Forces Analysis
This preview shows the exact JDE Peet's Porter's Five Forces analysis you'll receive immediately after purchase—no placeholders or mockups. It is the fully formatted, ready-to-use document covering competitive rivalry, supplier and buyer power, threats of entry and substitution. Buy once, download instantly; this file is the final deliverable.

Elevate Your Analysis with the Complete Porter's Five Forces Analysis
JDE Peet's faces intense buyer expectations, sizable supplier leverage in coffee markets, and moderate threats from substitutes and new entrants, shaping a complex competitive landscape. This brief snapshot only scratches the surface. Unlock the full Porter's Five Forces Analysis to explore detailed force ratings, visuals, and strategic implications.
Suppliers Bargaining Power
Concentrated bean origins
Arabica and Robusta supply is concentrated in a few origins—Brazil supplies roughly 35–40% of global coffee and Vietnam accounts for about 40% of world Robusta—exposing JDE Peet's to weather, disease and political shocks. Producer cooperatives and large exporters in these countries can materially influence prices and export volumes. Long-term sourcing programs and origin diversification mitigate but do not eliminate concentration risk. Certifications (Fairtrade, Rainforest Alliance) add resilience but typically raise bean costs by about 5–15%.
Commodity price volatility
Commodity price volatility is high for coffee and tea—ICE Arabica averaged about 1.80 USD/lb in 2024 while Robusta hovered near 2,000 USD/MT—so sudden spikes in futures and FX swings erode JDE Peet's margins and complicate procurement planning.
Hedging smooths near-term P&L but cannot alter upward structural cost trends; effective cost pass-through varies by channel, with retail more resilient than branded-away foodservice where competitive intensity limits price recovery.
Quality and specialty differentiation
High-grade beans and specialty lots are scarcer—specialty coffee represents roughly 10% of global production—giving niche suppliers more leverage. Premium portfolios and single-origin SKUs demand tighter specs and long-term contracts; JDE Peet's scale secures volumes but competition for top-grade supply pushes premiums often 20–50% above commodity prices. Supplier development programs can align incentives and improve traceability.
Packaging and equipment inputs
Aluminum, paper, plastics and specialty machinery vendors create non-commodity supplier exposure for JDE Peet's; input inflation and capacity constraints tightened purchasing terms across 2022–24. Multi-sourcing and long-term contracts reduce dependency, but switching costs remain for proprietary pod and capsule formats. Sustainability-driven packaging targets further narrow qualified suppliers.
- Supplier concentration: increases leverage
- Contracting: long-term deals cut spot risk
- Sustainability: limits eligible vendors
Sustainability and compliance demands
Sustainability demands—deforestation-free sourcing, full traceability and stricter ESG standards—shift bargaining power toward suppliers already certified, as JDE Peet’s 2025 commitments require deeper engagement and auditing. When certified supply is tight (estimated shortfall ~15% in 2024) compliance costs (roughly a 5–10% premium) can be passed through, raising baseline procurement costs but improving resilience.
- Certified supply shortfall ~15% (2024)
- Certification premium 5–10%
- Higher audit/engagement spend increases fixed sourcing costs
Supplier power up: Brazil 35–40% Arabica, Robusta ~40%
Bargaining power of suppliers is elevated: Brazil supplies ~35–40% of Arabica, Vietnam ~40% of Robusta, creating origin concentration risk; ICE Arabica averaged ~1.80 USD/lb in 2024 and Robusta ~2,000 USD/MT, compressing margins. Certified supply shortfall ~15% (2024) with premiums ~5–10%; specialty coffee (~10% of output) commands 20–50% premiums. Hedging and long-term contracts mitigate but do not remove supplier leverage.
| Metric | 2024 Value |
|---|---|
| Brazil Arabica share | 35–40% |
| Vietnam Robusta share | ~40% |
| ICE Arabica price | ~1.80 USD/lb |
| Robusta price | ~2,000 USD/MT |
| Certified supply shortfall | ~15% |
| Certification premium | 5–10% |
| Specialty share | ~10% (premium 20–50%) |
What is included in the product
Detailed Word Document
Tailored Porter's Five Forces analysis for JDE Peet's uncovering competitive intensity, buyer and supplier power, threat of substitutes and entrants, and industry rivalry, with insights on pricing, margins and strategic defenses. Ideal for investor reports, strategy decks and academic use—fully editable for customization.
Customizable Excel Spreadsheet
A concise one-sheet Porter's Five Forces for JDE Peet's—instantly visualise competitive pressure with a spider chart and customise force levels as market trends shift; clean layout ready for pitch decks, no macros required and easy to swap in your own data.
Customers Bargaining Power
Retailers and grocers’ scale
Large grocery chains, with the top four US grocers accounting for roughly 60% of the market (2023), wield strong negotiating power over price, promo funding and shelf space, forcing significant trade discounts. Private label penetration has risen in many markets, increasing retailer leverage versus branded suppliers. JDE Peet's scale and diverse brand portfolio (revenues €7.8bn in 2023) help preserve margin but trade terms remain demanding. Joint category management with retailers can partially rebalance power by aligning assortment and promotions.
Foodservice and OOH contracts
Cafes, offices and hospitality buyers negotiate on volume, equipment and service bundles, pushing JDE Peet's to tailor discounts and operating fees to large accounts. Tender-based procurement increases price pressure and requires highly specific service and billing terms. Long contracts, typically 3–5 years, improve revenue visibility but lock in pricing mechanics, while equipment placement raises switching costs and boosts retention.
Consumer price sensitivity
Inflation-driven downtrading pushed some consumers from premium to mainstream or private label during 2023–24, pressuring JDE Peet's value mix despite group revenue of about €7.7bn in 2023. Price elasticities differ by channel and brand strength, with retail shoppers more price-sensitive than out-of-home buyers. Frequent promotions (promotion intensity up in many markets in 2023) cultivate deal-seeking behavior. Loyalty programs and distinctive formats help blunt pure price competition.
E-commerce transparency
Online marketplaces enable instant price comparisons and review-driven choice, forcing JDE Peet's to defend margins on standard SKUs and accelerating mix shifts toward differentiated, premium formats; by 2024 marketplaces represented roughly 25% of global retail e-commerce, heightening price pressure. Direct-to-consumer channels offer richer first-party data but demand competitive pricing and fulfillment; subscription models can stabilize demand and cut churn, often improving CLV.
- marketplaces ≈25% of retail e‑commerce (2024)
- standard SKU margins compressed; mix shifts to premium
- DTC = data advantage but needs competitive pricing
- subscriptions reduce churn, raise CLV
Brand equity as counterweight
Iconic brands and a broad assortment give JDE Peet's negotiating leverage and justify premiums; the group reported over 50 brands in 100+ countries (company data, 2024). Taste consistency, wide availability and ongoing NPD anchor loyalty, but sustained marketing and R&D spend are required to limit private-label creep. Portfolio breadth enables tailored value propositions by segment.
- 50+ brands
- 100+ countries
- Premium pricing leverage
- Requires steady investment vs private label
Retailer bargaining and private label squeeze margins despite ≈€7.8bn scale
Large grocers (top‑4 ≈60% US market, 2023) and rising private label drive strong retailer bargaining, forcing trade discounts despite JDE Peet's scale (revenues ≈€7.8bn, 2023) and 50+ brands across 100+ countries (2024). Out‑of‑home tenders and equipment deals pressure pricing but raise switching costs; online marketplaces (~25% retail e‑commerce, 2024) increase price transparency. DTC/subscriptions and NPD partially restore mix and margin.
| Metric | 2023/24 |
|---|---|
| Revenue | ≈€7.8bn (2023) |
| Brands/Countries | 50+ / 100+ |
| Top‑4 US grocers | ≈60% market (2023) |
| Marketplaces | ≈25% retail e‑commerce (2024) |
Full Version Awaits
JDE Peet's Porter's Five Forces Analysis
This preview shows the exact JDE Peet's Porter's Five Forces analysis you'll receive immediately after purchase—no placeholders or mockups. It is the fully formatted, ready-to-use document covering competitive rivalry, supplier and buyer power, threats of entry and substitution. Buy once, download instantly; this file is the final deliverable.
Original: $10.00
-65%$10.00
$3.50Description
Elevate Your Analysis with the Complete Porter's Five Forces Analysis
JDE Peet's faces intense buyer expectations, sizable supplier leverage in coffee markets, and moderate threats from substitutes and new entrants, shaping a complex competitive landscape. This brief snapshot only scratches the surface. Unlock the full Porter's Five Forces Analysis to explore detailed force ratings, visuals, and strategic implications.
Suppliers Bargaining Power
Concentrated bean origins
Arabica and Robusta supply is concentrated in a few origins—Brazil supplies roughly 35–40% of global coffee and Vietnam accounts for about 40% of world Robusta—exposing JDE Peet's to weather, disease and political shocks. Producer cooperatives and large exporters in these countries can materially influence prices and export volumes. Long-term sourcing programs and origin diversification mitigate but do not eliminate concentration risk. Certifications (Fairtrade, Rainforest Alliance) add resilience but typically raise bean costs by about 5–15%.
Commodity price volatility
Commodity price volatility is high for coffee and tea—ICE Arabica averaged about 1.80 USD/lb in 2024 while Robusta hovered near 2,000 USD/MT—so sudden spikes in futures and FX swings erode JDE Peet's margins and complicate procurement planning.
Hedging smooths near-term P&L but cannot alter upward structural cost trends; effective cost pass-through varies by channel, with retail more resilient than branded-away foodservice where competitive intensity limits price recovery.
Quality and specialty differentiation
High-grade beans and specialty lots are scarcer—specialty coffee represents roughly 10% of global production—giving niche suppliers more leverage. Premium portfolios and single-origin SKUs demand tighter specs and long-term contracts; JDE Peet's scale secures volumes but competition for top-grade supply pushes premiums often 20–50% above commodity prices. Supplier development programs can align incentives and improve traceability.
Packaging and equipment inputs
Aluminum, paper, plastics and specialty machinery vendors create non-commodity supplier exposure for JDE Peet's; input inflation and capacity constraints tightened purchasing terms across 2022–24. Multi-sourcing and long-term contracts reduce dependency, but switching costs remain for proprietary pod and capsule formats. Sustainability-driven packaging targets further narrow qualified suppliers.
- Supplier concentration: increases leverage
- Contracting: long-term deals cut spot risk
- Sustainability: limits eligible vendors
Sustainability and compliance demands
Sustainability demands—deforestation-free sourcing, full traceability and stricter ESG standards—shift bargaining power toward suppliers already certified, as JDE Peet’s 2025 commitments require deeper engagement and auditing. When certified supply is tight (estimated shortfall ~15% in 2024) compliance costs (roughly a 5–10% premium) can be passed through, raising baseline procurement costs but improving resilience.
- Certified supply shortfall ~15% (2024)
- Certification premium 5–10%
- Higher audit/engagement spend increases fixed sourcing costs
Supplier power up: Brazil 35–40% Arabica, Robusta ~40%
Bargaining power of suppliers is elevated: Brazil supplies ~35–40% of Arabica, Vietnam ~40% of Robusta, creating origin concentration risk; ICE Arabica averaged ~1.80 USD/lb in 2024 and Robusta ~2,000 USD/MT, compressing margins. Certified supply shortfall ~15% (2024) with premiums ~5–10%; specialty coffee (~10% of output) commands 20–50% premiums. Hedging and long-term contracts mitigate but do not remove supplier leverage.
| Metric | 2024 Value |
|---|---|
| Brazil Arabica share | 35–40% |
| Vietnam Robusta share | ~40% |
| ICE Arabica price | ~1.80 USD/lb |
| Robusta price | ~2,000 USD/MT |
| Certified supply shortfall | ~15% |
| Certification premium | 5–10% |
| Specialty share | ~10% (premium 20–50%) |
What is included in the product
Detailed Word Document
Tailored Porter's Five Forces analysis for JDE Peet's uncovering competitive intensity, buyer and supplier power, threat of substitutes and entrants, and industry rivalry, with insights on pricing, margins and strategic defenses. Ideal for investor reports, strategy decks and academic use—fully editable for customization.
Customizable Excel Spreadsheet
A concise one-sheet Porter's Five Forces for JDE Peet's—instantly visualise competitive pressure with a spider chart and customise force levels as market trends shift; clean layout ready for pitch decks, no macros required and easy to swap in your own data.
Customers Bargaining Power
Retailers and grocers’ scale
Large grocery chains, with the top four US grocers accounting for roughly 60% of the market (2023), wield strong negotiating power over price, promo funding and shelf space, forcing significant trade discounts. Private label penetration has risen in many markets, increasing retailer leverage versus branded suppliers. JDE Peet's scale and diverse brand portfolio (revenues €7.8bn in 2023) help preserve margin but trade terms remain demanding. Joint category management with retailers can partially rebalance power by aligning assortment and promotions.
Foodservice and OOH contracts
Cafes, offices and hospitality buyers negotiate on volume, equipment and service bundles, pushing JDE Peet's to tailor discounts and operating fees to large accounts. Tender-based procurement increases price pressure and requires highly specific service and billing terms. Long contracts, typically 3–5 years, improve revenue visibility but lock in pricing mechanics, while equipment placement raises switching costs and boosts retention.
Consumer price sensitivity
Inflation-driven downtrading pushed some consumers from premium to mainstream or private label during 2023–24, pressuring JDE Peet's value mix despite group revenue of about €7.7bn in 2023. Price elasticities differ by channel and brand strength, with retail shoppers more price-sensitive than out-of-home buyers. Frequent promotions (promotion intensity up in many markets in 2023) cultivate deal-seeking behavior. Loyalty programs and distinctive formats help blunt pure price competition.
E-commerce transparency
Online marketplaces enable instant price comparisons and review-driven choice, forcing JDE Peet's to defend margins on standard SKUs and accelerating mix shifts toward differentiated, premium formats; by 2024 marketplaces represented roughly 25% of global retail e-commerce, heightening price pressure. Direct-to-consumer channels offer richer first-party data but demand competitive pricing and fulfillment; subscription models can stabilize demand and cut churn, often improving CLV.
- marketplaces ≈25% of retail e‑commerce (2024)
- standard SKU margins compressed; mix shifts to premium
- DTC = data advantage but needs competitive pricing
- subscriptions reduce churn, raise CLV
Brand equity as counterweight
Iconic brands and a broad assortment give JDE Peet's negotiating leverage and justify premiums; the group reported over 50 brands in 100+ countries (company data, 2024). Taste consistency, wide availability and ongoing NPD anchor loyalty, but sustained marketing and R&D spend are required to limit private-label creep. Portfolio breadth enables tailored value propositions by segment.
- 50+ brands
- 100+ countries
- Premium pricing leverage
- Requires steady investment vs private label
Retailer bargaining and private label squeeze margins despite ≈€7.8bn scale
Large grocers (top‑4 ≈60% US market, 2023) and rising private label drive strong retailer bargaining, forcing trade discounts despite JDE Peet's scale (revenues ≈€7.8bn, 2023) and 50+ brands across 100+ countries (2024). Out‑of‑home tenders and equipment deals pressure pricing but raise switching costs; online marketplaces (~25% retail e‑commerce, 2024) increase price transparency. DTC/subscriptions and NPD partially restore mix and margin.
| Metric | 2023/24 |
|---|---|
| Revenue | ≈€7.8bn (2023) |
| Brands/Countries | 50+ / 100+ |
| Top‑4 US grocers | ≈60% market (2023) |
| Marketplaces | ≈25% retail e‑commerce (2024) |
Full Version Awaits
JDE Peet's Porter's Five Forces Analysis
This preview shows the exact JDE Peet's Porter's Five Forces analysis you'll receive immediately after purchase—no placeholders or mockups. It is the fully formatted, ready-to-use document covering competitive rivalry, supplier and buyer power, threats of entry and substitution. Buy once, download instantly; this file is the final deliverable.











