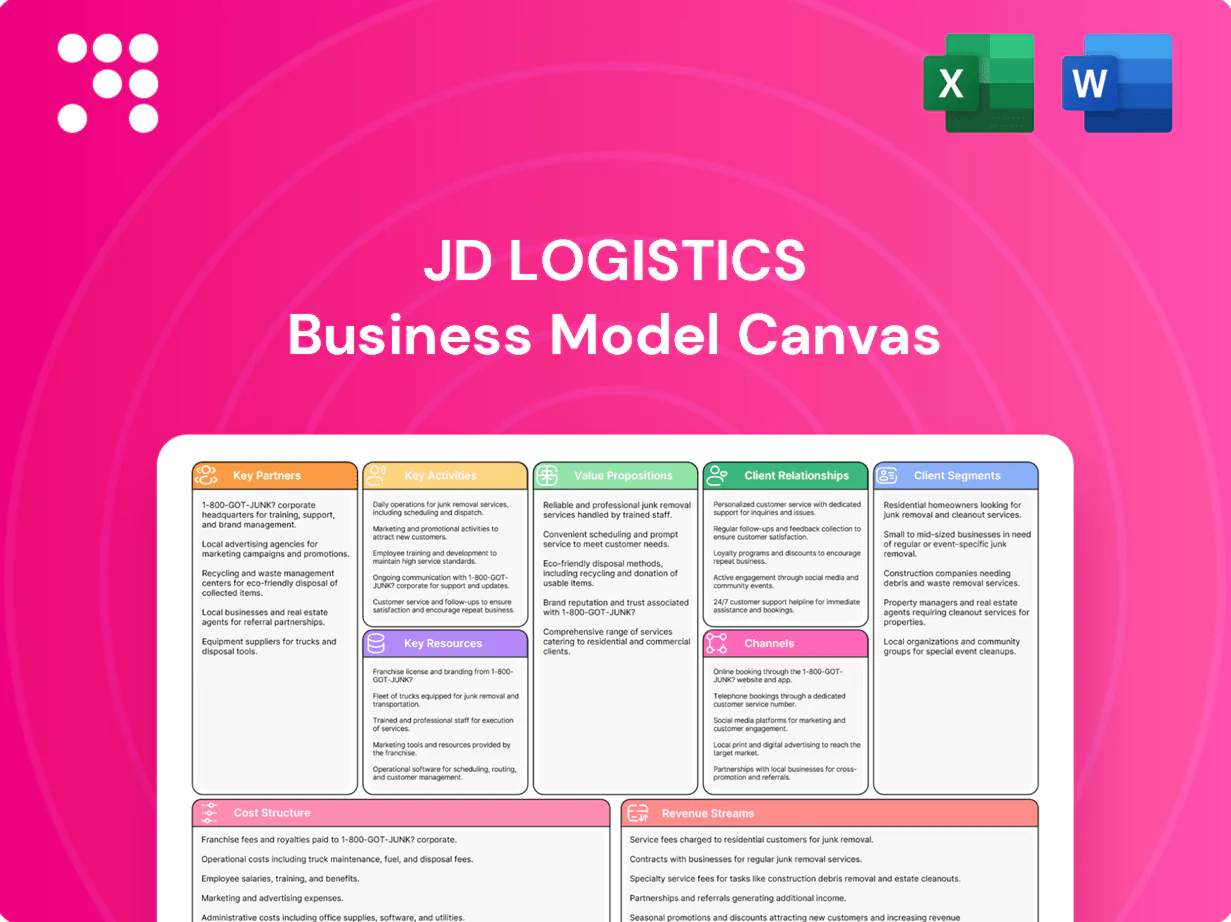
JD Logistics Business Model Canvas

Business Model Canvas: scale, tech investment and partnership-driven margins
Discover JD Logistics’ core strategy in a concise Business Model Canvas that maps value propositions, customer segments, key partners, revenue streams and cost structure. This snapshot reveals how operational scale, tech investment and partner networks drive competitive advantage and margins. Purchase the full editable Canvas (Word & Excel) to benchmark, adapt strategy, or prepare investor-ready analysis.
Partnerships

E-commerce & retail platforms
Partnerships with major marketplaces and omnichannel retailers provide predictable volumes—JD Logistics reports peak-season order surges of ~25%—enabling joint demand planning for slotting, inventory placement and SLA alignment. API integrations cut order ingestion and tracking time by up to 40%, while co-marketing with merchants boosts adoption of value-added logistics services and drives repeat merchant revenue growth.
Manufacturers & suppliers
Upstream partnerships with manufacturers and suppliers enable vendor-managed inventory and factory-to-warehouse flows, shortening replenishment cycles and supporting JD Logistics’ promise of same- or next-day service to about 99% of China’s population. Coordinated inbound consolidation reduces lead times and transport costs through pooled shipments and cross-dock operations. Shared forecasts and EDI integrations improve capacity planning and materially reduce stockouts. Aligned quality and packaging standards enable automation-ready handling across JD’s network.

Transport carriers & last-mile networks
Regional carriers, linehaul partners and crowd-sourced couriers expand JD Logistics coverage and surge capacity, supporting peak volumes in 2024 while preserving same/next-day service. Multi-modal options (road, rail, air) balance cost, speed and CO2 targets, aiding emissions reductions tied to JD’s 2024 efficiency drives. A unified TMS with dynamic routing raised utilization and helped maintain OTIF above 95%, while contingency partners mitigate holiday and weather disruptions.

Technology & automation providers
Technology & automation providers—robotics, AGVs, vision systems and WMS/TMS vendors—accelerate JD Logistics operational efficiency, co-development pilots shorten innovation cycles and tailor solutions to Chinese regulations, data partnerships enrich ETA, risk scoring and demand forecasting; China handled 119.32 billion parcels in 2023, underscoring scale.
- Robotics/AGVs: faster throughput
- Co-development: regulatory fit
- Data: ETA & demand
- Cloud/Edge: resilience & scale
Cold chain & compliance partners
Refrigeration OEMs such as Carrier and Thermo King and calibrated IoT sensors with GDP-compliant handlers safeguard temperature integrity; regulatory consultants ensure food and pharma adherence across 31 provinces in China. Insurance partners underwrite in-transit risk using telemetry to price data-backed premiums, while certified disposal and recall partners manage exceptions responsibly.
- OEMs: Carrier, Thermo King
- Sensors: calibrated IoT telemetry
- Compliance: 31 provinces
- Insurance: data-backed premiums
- Disposal: certified recall partners
119.32B parcels (2023); ~99% same/next-day; OTIF > 95%
Key partnerships with marketplaces, suppliers, carriers, automation vendors and refrigeration/insurance providers deliver predictable peak volumes (~25% surge), API integrations (40% faster order handling), same-/next-day reach to ~99% of China, OTIF >95% and nationwide compliance across 31 provinces, leveraging scale from 119.32 billion parcels handled in China in 2023.
| Partnership | Metric | Fact |
|---|---|---|
| Marketplaces | Peak surge | ~25% |
| Tech APIs | Order/track time | Up to 40% faster |
| Coverage | Same/next-day reach | ~99% of population |
| Operations | OTIF | >95% |
| Scale | Parcels (2023) | 119.32 billion |
| Compliance | Provinces | 31 |
What is included in the product
 Detailed Word Document
A comprehensive Business Model Canvas for JD Logistics detailing customer segments, omnichannel delivery and warehousing channels, and value propositions around speed, reliability, and tech-enabled fulfillment. Organized into nine blocks with competitive advantages, SWOT-linked insights and practical use for presentations, investor discussions, and strategic decision-making.

 Customizable Excel Spreadsheet
High-level view of JD Logistics' business model that highlights pain-point solutions across last-mile delivery, warehousing, cold chain and tech integration in an editable one-page canvas for quick team alignment.
Activities

End-to-end supply chain orchestration
Designing, operating, and optimizing integrated warehousing-to-delivery solutions is core, supported by a nationwide network of 1,400+ warehouses and dense last-mile nodes that enable same- or next-day fulfillment for most urban customers.
Network planning, inventory positioning, and cross-docking reduce order cycle times by up to 30%, while dynamic routing and SKU-level inventory placement cut carrying costs and stockouts.
Control towers monitor SLAs and exceptions in real time across millions of daily shipments, and continuous improvement initiatives drive year-on-year cost-per-delivery reductions to keep service competitive.
Warehouse automation & operations
Running smart fulfillment centers with robotics and AI raises throughput and accuracy—JD Logistics operates over 1,000 automated facilities and reports double‑digit efficiency gains in robotized sites versus manual ones. Slotting, wave picking, and micro‑fulfillment shorten pick paths by up to 40%, cutting cycle times and labor per order. Rigorous maintenance and safety programs sustain >99% uptime, while seasonal reconfiguration enables rapid capacity shifts for promotions and new SKUs.

Transportation & last-mile execution
Linehaul scheduling, milk runs and dynamic routing drive on-time shipping across JD Logistics’ network, which covered 99% of China’s population in 2024. Real-time tracking and POD digitization provide end-to-end visibility for millions of daily orders. Capacity balancing smooths peak spikes and supports reverse logistics flows. Green delivery pilots in urban cores seek to cut emissions through EV and cargo-bike trials.

Data analytics & AI optimization
Data analytics and AI optimization drive JD Logistics decisions via forecasting, network simulation, and dynamic pricing engines that aligned with handling over 1 billion annual orders by 2024 to balance cost and service levels.
ETA prediction, anomaly detection, and AI labor planning raised reliability and on-time performance in 2024 pilots, while customer dashboards surface real-time KPIs and margins per route.
A/B testing continuously refines service bundles and SLAs, improving conversion and retention metrics across metropolitan and rural cohorts.
- Forecasting: demand smoothing
- Network simulation: capacity scenarios
- Pricing engines: yield optimization
- ETA & anomaly: reliability
- Dashboards: actionable KPIs
- A/B testing: bundle & SLA tuning
Industry-specific solutions
Industry-specific SOPs for electronics, apparel, FMCG and healthcare embed vertical expertise across JD Logistics operations, reinforcing handling protocols and SKU-level KPIs to cut errors and speed throughput.
Cold chain mapping delivers end-to-end temperature control and traceability across multimodal lanes, supporting temperature ranges from frozen to ambient for medical and perishable goods.
Value-added services—kitting, labeling, customization—increase client stickiness and enable tailored fulfillment; integrated compliance and documentation reduce regulatory risk for cross-border and healthcare clients.
- Vertical SOPs: electronics, apparel, FMCG, healthcare
- Cold chain: end-to-end mapping and traceability
- Value-adds: kitting, labeling, customization
- Compliance: documentation to lower client risk
1,400+ warehouses and 1,000+ automated sites deliver same/next-day to 99% of China
Designing and operating end-to-end warehousing-to-delivery with 1,400+ warehouses and 1,000+ automated sites enables same/next‑day fulfillment for most urban customers (2024).
Network planning, cross‑docking, dynamic routing and AI-driven inventory cut cycle times ~30% and supported >1 billion orders in 2024.
Control towers, real‑time tracking and vertical SOPs sustain 99% China population coverage and continuous cost-per-delivery improvements.
| Metric | 2024 |
|---|---|
| Warehouses | 1,400+ |
| Automated sites | 1,000+ |
| Orders handled | >1 billion |
| Population coverage | 99% |
Delivered as Displayed
Business Model Canvas
The document you're previewing is the exact JD Logistics Business Model Canvas you'll receive after purchase. This live preview shows real content and structure—no mockups or placeholders. Upon checkout you'll download the full, editable file formatted for immediate use in Word and Excel. What you see is what you get.

Business Model Canvas: scale, tech investment and partnership-driven margins
Discover JD Logistics’ core strategy in a concise Business Model Canvas that maps value propositions, customer segments, key partners, revenue streams and cost structure. This snapshot reveals how operational scale, tech investment and partner networks drive competitive advantage and margins. Purchase the full editable Canvas (Word & Excel) to benchmark, adapt strategy, or prepare investor-ready analysis.
Partnerships
E-commerce & retail platforms
Partnerships with major marketplaces and omnichannel retailers provide predictable volumes—JD Logistics reports peak-season order surges of ~25%—enabling joint demand planning for slotting, inventory placement and SLA alignment. API integrations cut order ingestion and tracking time by up to 40%, while co-marketing with merchants boosts adoption of value-added logistics services and drives repeat merchant revenue growth.
Manufacturers & suppliers
Upstream partnerships with manufacturers and suppliers enable vendor-managed inventory and factory-to-warehouse flows, shortening replenishment cycles and supporting JD Logistics’ promise of same- or next-day service to about 99% of China’s population. Coordinated inbound consolidation reduces lead times and transport costs through pooled shipments and cross-dock operations. Shared forecasts and EDI integrations improve capacity planning and materially reduce stockouts. Aligned quality and packaging standards enable automation-ready handling across JD’s network.
Transport carriers & last-mile networks
Regional carriers, linehaul partners and crowd-sourced couriers expand JD Logistics coverage and surge capacity, supporting peak volumes in 2024 while preserving same/next-day service. Multi-modal options (road, rail, air) balance cost, speed and CO2 targets, aiding emissions reductions tied to JD’s 2024 efficiency drives. A unified TMS with dynamic routing raised utilization and helped maintain OTIF above 95%, while contingency partners mitigate holiday and weather disruptions.
Technology & automation providers
Technology & automation providers—robotics, AGVs, vision systems and WMS/TMS vendors—accelerate JD Logistics operational efficiency, co-development pilots shorten innovation cycles and tailor solutions to Chinese regulations, data partnerships enrich ETA, risk scoring and demand forecasting; China handled 119.32 billion parcels in 2023, underscoring scale.
- Robotics/AGVs: faster throughput
- Co-development: regulatory fit
- Data: ETA & demand
- Cloud/Edge: resilience & scale
Cold chain & compliance partners
Refrigeration OEMs such as Carrier and Thermo King and calibrated IoT sensors with GDP-compliant handlers safeguard temperature integrity; regulatory consultants ensure food and pharma adherence across 31 provinces in China. Insurance partners underwrite in-transit risk using telemetry to price data-backed premiums, while certified disposal and recall partners manage exceptions responsibly.
- OEMs: Carrier, Thermo King
- Sensors: calibrated IoT telemetry
- Compliance: 31 provinces
- Insurance: data-backed premiums
- Disposal: certified recall partners
119.32B parcels (2023); ~99% same/next-day; OTIF > 95%
Key partnerships with marketplaces, suppliers, carriers, automation vendors and refrigeration/insurance providers deliver predictable peak volumes (~25% surge), API integrations (40% faster order handling), same-/next-day reach to ~99% of China, OTIF >95% and nationwide compliance across 31 provinces, leveraging scale from 119.32 billion parcels handled in China in 2023.
| Partnership | Metric | Fact |
|---|---|---|
| Marketplaces | Peak surge | ~25% |
| Tech APIs | Order/track time | Up to 40% faster |
| Coverage | Same/next-day reach | ~99% of population |
| Operations | OTIF | >95% |
| Scale | Parcels (2023) | 119.32 billion |
| Compliance | Provinces | 31 |
What is included in the product
Detailed Word Document
A comprehensive Business Model Canvas for JD Logistics detailing customer segments, omnichannel delivery and warehousing channels, and value propositions around speed, reliability, and tech-enabled fulfillment. Organized into nine blocks with competitive advantages, SWOT-linked insights and practical use for presentations, investor discussions, and strategic decision-making.
Customizable Excel Spreadsheet
High-level view of JD Logistics' business model that highlights pain-point solutions across last-mile delivery, warehousing, cold chain and tech integration in an editable one-page canvas for quick team alignment.
Activities
End-to-end supply chain orchestration
Designing, operating, and optimizing integrated warehousing-to-delivery solutions is core, supported by a nationwide network of 1,400+ warehouses and dense last-mile nodes that enable same- or next-day fulfillment for most urban customers.
Network planning, inventory positioning, and cross-docking reduce order cycle times by up to 30%, while dynamic routing and SKU-level inventory placement cut carrying costs and stockouts.
Control towers monitor SLAs and exceptions in real time across millions of daily shipments, and continuous improvement initiatives drive year-on-year cost-per-delivery reductions to keep service competitive.
Warehouse automation & operations
Running smart fulfillment centers with robotics and AI raises throughput and accuracy—JD Logistics operates over 1,000 automated facilities and reports double‑digit efficiency gains in robotized sites versus manual ones. Slotting, wave picking, and micro‑fulfillment shorten pick paths by up to 40%, cutting cycle times and labor per order. Rigorous maintenance and safety programs sustain >99% uptime, while seasonal reconfiguration enables rapid capacity shifts for promotions and new SKUs.
Transportation & last-mile execution
Linehaul scheduling, milk runs and dynamic routing drive on-time shipping across JD Logistics’ network, which covered 99% of China’s population in 2024. Real-time tracking and POD digitization provide end-to-end visibility for millions of daily orders. Capacity balancing smooths peak spikes and supports reverse logistics flows. Green delivery pilots in urban cores seek to cut emissions through EV and cargo-bike trials.
Data analytics & AI optimization
Data analytics and AI optimization drive JD Logistics decisions via forecasting, network simulation, and dynamic pricing engines that aligned with handling over 1 billion annual orders by 2024 to balance cost and service levels.
ETA prediction, anomaly detection, and AI labor planning raised reliability and on-time performance in 2024 pilots, while customer dashboards surface real-time KPIs and margins per route.
A/B testing continuously refines service bundles and SLAs, improving conversion and retention metrics across metropolitan and rural cohorts.
- Forecasting: demand smoothing
- Network simulation: capacity scenarios
- Pricing engines: yield optimization
- ETA & anomaly: reliability
- Dashboards: actionable KPIs
- A/B testing: bundle & SLA tuning
Industry-specific solutions
Industry-specific SOPs for electronics, apparel, FMCG and healthcare embed vertical expertise across JD Logistics operations, reinforcing handling protocols and SKU-level KPIs to cut errors and speed throughput.
Cold chain mapping delivers end-to-end temperature control and traceability across multimodal lanes, supporting temperature ranges from frozen to ambient for medical and perishable goods.
Value-added services—kitting, labeling, customization—increase client stickiness and enable tailored fulfillment; integrated compliance and documentation reduce regulatory risk for cross-border and healthcare clients.
- Vertical SOPs: electronics, apparel, FMCG, healthcare
- Cold chain: end-to-end mapping and traceability
- Value-adds: kitting, labeling, customization
- Compliance: documentation to lower client risk
1,400+ warehouses and 1,000+ automated sites deliver same/next-day to 99% of China
Designing and operating end-to-end warehousing-to-delivery with 1,400+ warehouses and 1,000+ automated sites enables same/next‑day fulfillment for most urban customers (2024).
Network planning, cross‑docking, dynamic routing and AI-driven inventory cut cycle times ~30% and supported >1 billion orders in 2024.
Control towers, real‑time tracking and vertical SOPs sustain 99% China population coverage and continuous cost-per-delivery improvements.
| Metric | 2024 |
|---|---|
| Warehouses | 1,400+ |
| Automated sites | 1,000+ |
| Orders handled | >1 billion |
| Population coverage | 99% |
Delivered as Displayed
Business Model Canvas
The document you're previewing is the exact JD Logistics Business Model Canvas you'll receive after purchase. This live preview shows real content and structure—no mockups or placeholders. Upon checkout you'll download the full, editable file formatted for immediate use in Word and Excel. What you see is what you get.
Description
Business Model Canvas: scale, tech investment and partnership-driven margins
Discover JD Logistics’ core strategy in a concise Business Model Canvas that maps value propositions, customer segments, key partners, revenue streams and cost structure. This snapshot reveals how operational scale, tech investment and partner networks drive competitive advantage and margins. Purchase the full editable Canvas (Word & Excel) to benchmark, adapt strategy, or prepare investor-ready analysis.
Partnerships
E-commerce & retail platforms
Partnerships with major marketplaces and omnichannel retailers provide predictable volumes—JD Logistics reports peak-season order surges of ~25%—enabling joint demand planning for slotting, inventory placement and SLA alignment. API integrations cut order ingestion and tracking time by up to 40%, while co-marketing with merchants boosts adoption of value-added logistics services and drives repeat merchant revenue growth.
Manufacturers & suppliers
Upstream partnerships with manufacturers and suppliers enable vendor-managed inventory and factory-to-warehouse flows, shortening replenishment cycles and supporting JD Logistics’ promise of same- or next-day service to about 99% of China’s population. Coordinated inbound consolidation reduces lead times and transport costs through pooled shipments and cross-dock operations. Shared forecasts and EDI integrations improve capacity planning and materially reduce stockouts. Aligned quality and packaging standards enable automation-ready handling across JD’s network.
Transport carriers & last-mile networks
Regional carriers, linehaul partners and crowd-sourced couriers expand JD Logistics coverage and surge capacity, supporting peak volumes in 2024 while preserving same/next-day service. Multi-modal options (road, rail, air) balance cost, speed and CO2 targets, aiding emissions reductions tied to JD’s 2024 efficiency drives. A unified TMS with dynamic routing raised utilization and helped maintain OTIF above 95%, while contingency partners mitigate holiday and weather disruptions.
Technology & automation providers
Technology & automation providers—robotics, AGVs, vision systems and WMS/TMS vendors—accelerate JD Logistics operational efficiency, co-development pilots shorten innovation cycles and tailor solutions to Chinese regulations, data partnerships enrich ETA, risk scoring and demand forecasting; China handled 119.32 billion parcels in 2023, underscoring scale.
- Robotics/AGVs: faster throughput
- Co-development: regulatory fit
- Data: ETA & demand
- Cloud/Edge: resilience & scale
Cold chain & compliance partners
Refrigeration OEMs such as Carrier and Thermo King and calibrated IoT sensors with GDP-compliant handlers safeguard temperature integrity; regulatory consultants ensure food and pharma adherence across 31 provinces in China. Insurance partners underwrite in-transit risk using telemetry to price data-backed premiums, while certified disposal and recall partners manage exceptions responsibly.
- OEMs: Carrier, Thermo King
- Sensors: calibrated IoT telemetry
- Compliance: 31 provinces
- Insurance: data-backed premiums
- Disposal: certified recall partners
119.32B parcels (2023); ~99% same/next-day; OTIF > 95%
Key partnerships with marketplaces, suppliers, carriers, automation vendors and refrigeration/insurance providers deliver predictable peak volumes (~25% surge), API integrations (40% faster order handling), same-/next-day reach to ~99% of China, OTIF >95% and nationwide compliance across 31 provinces, leveraging scale from 119.32 billion parcels handled in China in 2023.
| Partnership | Metric | Fact |
|---|---|---|
| Marketplaces | Peak surge | ~25% |
| Tech APIs | Order/track time | Up to 40% faster |
| Coverage | Same/next-day reach | ~99% of population |
| Operations | OTIF | >95% |
| Scale | Parcels (2023) | 119.32 billion |
| Compliance | Provinces | 31 |
What is included in the product
Detailed Word Document
A comprehensive Business Model Canvas for JD Logistics detailing customer segments, omnichannel delivery and warehousing channels, and value propositions around speed, reliability, and tech-enabled fulfillment. Organized into nine blocks with competitive advantages, SWOT-linked insights and practical use for presentations, investor discussions, and strategic decision-making.
Customizable Excel Spreadsheet
High-level view of JD Logistics' business model that highlights pain-point solutions across last-mile delivery, warehousing, cold chain and tech integration in an editable one-page canvas for quick team alignment.
Activities
End-to-end supply chain orchestration
Designing, operating, and optimizing integrated warehousing-to-delivery solutions is core, supported by a nationwide network of 1,400+ warehouses and dense last-mile nodes that enable same- or next-day fulfillment for most urban customers.
Network planning, inventory positioning, and cross-docking reduce order cycle times by up to 30%, while dynamic routing and SKU-level inventory placement cut carrying costs and stockouts.
Control towers monitor SLAs and exceptions in real time across millions of daily shipments, and continuous improvement initiatives drive year-on-year cost-per-delivery reductions to keep service competitive.
Warehouse automation & operations
Running smart fulfillment centers with robotics and AI raises throughput and accuracy—JD Logistics operates over 1,000 automated facilities and reports double‑digit efficiency gains in robotized sites versus manual ones. Slotting, wave picking, and micro‑fulfillment shorten pick paths by up to 40%, cutting cycle times and labor per order. Rigorous maintenance and safety programs sustain >99% uptime, while seasonal reconfiguration enables rapid capacity shifts for promotions and new SKUs.
Transportation & last-mile execution
Linehaul scheduling, milk runs and dynamic routing drive on-time shipping across JD Logistics’ network, which covered 99% of China’s population in 2024. Real-time tracking and POD digitization provide end-to-end visibility for millions of daily orders. Capacity balancing smooths peak spikes and supports reverse logistics flows. Green delivery pilots in urban cores seek to cut emissions through EV and cargo-bike trials.
Data analytics & AI optimization
Data analytics and AI optimization drive JD Logistics decisions via forecasting, network simulation, and dynamic pricing engines that aligned with handling over 1 billion annual orders by 2024 to balance cost and service levels.
ETA prediction, anomaly detection, and AI labor planning raised reliability and on-time performance in 2024 pilots, while customer dashboards surface real-time KPIs and margins per route.
A/B testing continuously refines service bundles and SLAs, improving conversion and retention metrics across metropolitan and rural cohorts.
- Forecasting: demand smoothing
- Network simulation: capacity scenarios
- Pricing engines: yield optimization
- ETA & anomaly: reliability
- Dashboards: actionable KPIs
- A/B testing: bundle & SLA tuning
Industry-specific solutions
Industry-specific SOPs for electronics, apparel, FMCG and healthcare embed vertical expertise across JD Logistics operations, reinforcing handling protocols and SKU-level KPIs to cut errors and speed throughput.
Cold chain mapping delivers end-to-end temperature control and traceability across multimodal lanes, supporting temperature ranges from frozen to ambient for medical and perishable goods.
Value-added services—kitting, labeling, customization—increase client stickiness and enable tailored fulfillment; integrated compliance and documentation reduce regulatory risk for cross-border and healthcare clients.
- Vertical SOPs: electronics, apparel, FMCG, healthcare
- Cold chain: end-to-end mapping and traceability
- Value-adds: kitting, labeling, customization
- Compliance: documentation to lower client risk
1,400+ warehouses and 1,000+ automated sites deliver same/next-day to 99% of China
Designing and operating end-to-end warehousing-to-delivery with 1,400+ warehouses and 1,000+ automated sites enables same/next‑day fulfillment for most urban customers (2024).
Network planning, cross‑docking, dynamic routing and AI-driven inventory cut cycle times ~30% and supported >1 billion orders in 2024.
Control towers, real‑time tracking and vertical SOPs sustain 99% China population coverage and continuous cost-per-delivery improvements.
| Metric | 2024 |
|---|---|
| Warehouses | 1,400+ |
| Automated sites | 1,000+ |
| Orders handled | >1 billion |
| Population coverage | 99% |
Delivered as Displayed
Business Model Canvas
The document you're previewing is the exact JD Logistics Business Model Canvas you'll receive after purchase. This live preview shows real content and structure—no mockups or placeholders. Upon checkout you'll download the full, editable file formatted for immediate use in Word and Excel. What you see is what you get.











