JD Logistics Porter's Five Forces Analysis

Elevate Your Analysis with the Complete Porter's Five Forces Analysis
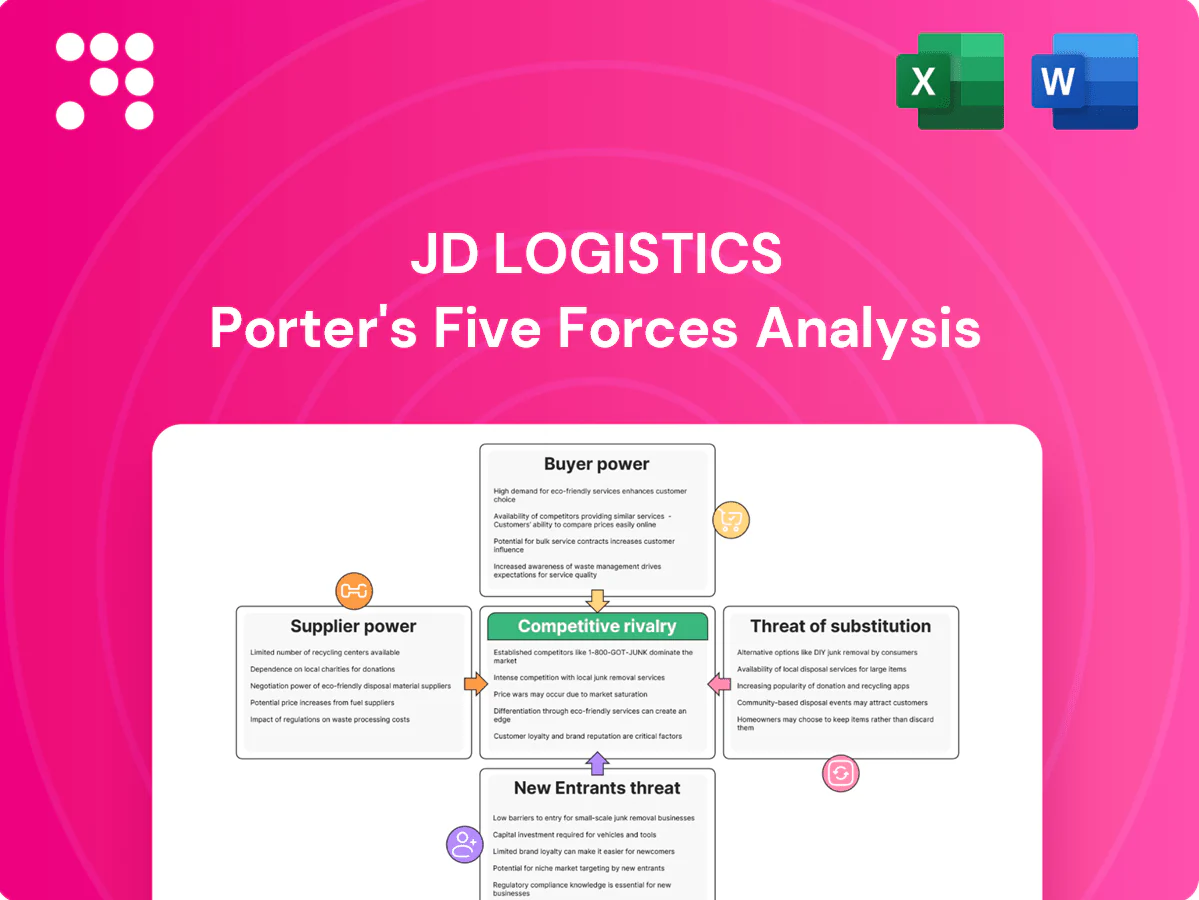
This snapshot highlights JD Logistics’ competitive intensity—strong supplier relationships, rising buyer sophistication, moderate barriers to entry, and growing substitute and rivalry pressures; it’s a concise view of industry tensions and strategic levers. Unlock the full Porter’s Five Forces Analysis to access force-by-force ratings, visuals, and actionable insights tailored to JD Logistics. Purchase the complete report for a consultant-grade, ready-to-use breakdown.
Suppliers Bargaining Power

Fleet and fuel vendors
Vehicle OEMs, leasing firms and fuel suppliers can shift costs via pricing cycles and availability; JD Logistics counters with scale purchasing, multi-sourcing and growing alternative-energy fleets, plus long-term contracts and hedging to damp volatility. Sudden spikes in oil prices or battery material inputs can still compress margins rapidly, and structural dependence on external fleet and fuel markets remains.
Warehouse landlords
Land scarcity in tier-1/2 cities gives industrial park owners leverage on rents and renewals, with vacancy in prime urban logistics nodes under 5% in 2024, keeping upward pressure on fees. JD’s network of over 1,400 self-built warehouses and long-term leases cushions this supplier power and limits immediate exposure. Relocation risks raise switching costs and operational disruption, while real estate cycles can quickly ease or tighten landlord leverage.

Automation and tech suppliers
Robotics, WMS and AI vendors supply critical systems with few best-in-class alternatives, concentrating supplier power and raising prices and delivery leverage. Vendor lock-in and integration complexity increase switching costs, especially for large-scale hubs. JD’s in-house R&D in 2024 reduces dependence but still requires specialized hardware and components. Global chip and sensor supply constraints in 2024 can delay rollouts and extend timelines.

Cold-chain equipment providers
Cold-chain equipment providers — reefer trucks ($50,000–150,000), IoT sensors ($20–200) and temperature-control units — are specialized and costly; certification and compliance (GDP, FDA/CFDA standards) narrow supplier options. JD Logistics’ scale improves bargaining but routine maintenance/calibration (typically every 6–12 months) sustains supplier dependence and failures risk SLA breaches in pharma and fresh categories.
- CapEx: reefer $50k–150k
- IoT unit: $20–200
- Calibration: 6–12 months
- Compliance: GDP/FDA/CFDA
Labor and gig networks
- Peak-season shortages → higher overtime premiums
- Automation & training reduce turnover
- Scheduling algorithms cut labor inefficiency
- Policy changes on gig work raise fixed costs
Supplier power tight: real estate, fleet, hardware, labor — mitigated by scale, 1,400+ warehouses
Vehicle/fuel, real estate, tech vendors and labor exert concentrated supplier power; JD offsets with scale purchasing, 1,400+ self-built warehouses, in‑house R&D and automation. Vacancy in tier‑1/2 urban nodes <5% in 2024 and 154.4bn parcels in 2023 keep cost pressure. Specialized kit (reefer $50k–150k; IoT $20–200) and 6–12m calibration cycles sustain dependence; chip shortages in 2024 delayed rollouts.
| Supplier | Key metric (2023/24) | JD mitigant |
|---|---|---|
| Real estate | Vacancy <5% (2024) | 1,400+ self-built, long leases |
| Fleet/fuel | Parcels 154.4bn (2023) | Scale buying, alt-energy fleets |
| Tech/hardware | Reefer $50k–150k; IoT $20–200 | In-house R&D, multi-sourcing |
| Labor | Peak shortages, gig policy risk | Automation, training, scheduling |
What is included in the product
 Detailed Word Document
Concise Porter's Five Forces assessment of JD Logistics, revealing competitive intensity, buyer and supplier power, substitutes and entry barriers, and highlighting disruptive threats and strategic levers that influence its pricing, margins, and market positioning.

 Customizable Excel Spreadsheet
A concise one-sheet Porter’s Five Forces for JD Logistics that visualizes competitive pressures with an editable spider chart for rapid strategic decisions; customize inputs, scenarios, and labels without macros to plug directly into decks, dashboards, or boardroom reports.
Customers Bargaining Power

Large enterprise shippers
Large enterprise shippers — major e-commerce platforms, 3C, FMCG and apparel clients — exert strong bargaining power in 2024, using volume to press for rate discounts, tighter SLAs and bundled value-adds. JD defends margins via tiered pricing, integrated end-to-end solutions that increase stickiness and multi-year contract tenures. Persistent annual RFP re-bids keep pricing pressure elevated.
Multi-sourcing options
Customers can split volumes across SF, ZTO, YTO, STO, Cainiao partners and regional carriers, leveraging China's parcel network that handled about 120 billion parcels in 2023, creating credible outside options and raising buyer power. JD Logistics counters with end-to-end integration and nationwide coverage to reduce switching appeal. Real-time performance dashboards and contractual penalties further anchor retention.

Price transparency
Price transparency from digital freight platforms and benchmarking in 2024 lets buyers compare rates across carriers in real time, driving negotiation power and compressing margins; industry reports show benchmarking-driven rate pressure of around 10–15% for standard lanes. JD must justify any premium through demonstrable reliability, faster SLAs and tech-enabled visibility, while using dynamic pricing and cost-to-serve analytics to protect margins.

Integration switching costs
Integration switching costs for customers are moderate-to-high as deep API/OMS/WMS links and customized SOPs, packaging and returns flows embed operations; by 2024 standardized interfaces are lowering onboarding time while JD Logistics raises exit friction through co-designed workflows and operational tie-ins.
- Integration depth: API/OMS/WMS
- Customization: SOPs, packaging, returns
- Trend 2024: rising standardization
- JD play: co-designed workflows to increase switching cost
Demand volatility
Demand volatility around Double 11 and 618 drives large, short-term shifts in buyer volumes and contract terms, with clients often requesting surge capacity without long-term commitments; JD Logistics offsets this via flexible capacity allocation and surge pricing to protect utilization. Forecast sharing and vendor-managed inventory programs align incentives, smoothing peaks and lowering spot-surge reliance.
- Seasonal spikes: Double 11, 618
- Client demand: surge capacity, no long-term commitment
- JD tools: flexible capacity, surge pricing
- Mitigation: forecast sharing, VMI
Enterprise shippers force 10-15% lane-rate cuts; China 120bn parcels create strong alternatives
Large enterprise shippers exert strong bargaining power in 2024, leveraging volume for discounts, tighter SLAs and bundled services. Rate transparency and benchmarking drive ~10–15% downward pressure on standard lanes; China handled about 120 billion parcels in 2023, creating credible outside options. JD defends margins with tiered pricing, end-to-end integration, contract tenures and surge pricing for peak events.
| Metric | 2023/2024 | Impact on JD |
|---|---|---|
| China parcel volume | ~120bn (2023) | more buyer options |
| Benchmark rate pressure | ~10–15% (2024) | compresses margins |
| Peak events | Double 11, 618 | surge demand, spot pricing |
Full Version Awaits
JD Logistics Porter's Five Forces Analysis
This preview shows the exact Porter’s Five Forces analysis of JD Logistics you’ll receive upon purchase—fully written, formatted, and ready to download. It covers competitive rivalry, supplier and buyer power, entry threats, and substitution risk. No placeholders or samples—this is the final deliverable.

Elevate Your Analysis with the Complete Porter's Five Forces Analysis
This snapshot highlights JD Logistics’ competitive intensity—strong supplier relationships, rising buyer sophistication, moderate barriers to entry, and growing substitute and rivalry pressures; it’s a concise view of industry tensions and strategic levers. Unlock the full Porter’s Five Forces Analysis to access force-by-force ratings, visuals, and actionable insights tailored to JD Logistics. Purchase the complete report for a consultant-grade, ready-to-use breakdown.
Suppliers Bargaining Power
Fleet and fuel vendors
Vehicle OEMs, leasing firms and fuel suppliers can shift costs via pricing cycles and availability; JD Logistics counters with scale purchasing, multi-sourcing and growing alternative-energy fleets, plus long-term contracts and hedging to damp volatility. Sudden spikes in oil prices or battery material inputs can still compress margins rapidly, and structural dependence on external fleet and fuel markets remains.
Warehouse landlords
Land scarcity in tier-1/2 cities gives industrial park owners leverage on rents and renewals, with vacancy in prime urban logistics nodes under 5% in 2024, keeping upward pressure on fees. JD’s network of over 1,400 self-built warehouses and long-term leases cushions this supplier power and limits immediate exposure. Relocation risks raise switching costs and operational disruption, while real estate cycles can quickly ease or tighten landlord leverage.
Automation and tech suppliers
Robotics, WMS and AI vendors supply critical systems with few best-in-class alternatives, concentrating supplier power and raising prices and delivery leverage. Vendor lock-in and integration complexity increase switching costs, especially for large-scale hubs. JD’s in-house R&D in 2024 reduces dependence but still requires specialized hardware and components. Global chip and sensor supply constraints in 2024 can delay rollouts and extend timelines.
Cold-chain equipment providers
Cold-chain equipment providers — reefer trucks ($50,000–150,000), IoT sensors ($20–200) and temperature-control units — are specialized and costly; certification and compliance (GDP, FDA/CFDA standards) narrow supplier options. JD Logistics’ scale improves bargaining but routine maintenance/calibration (typically every 6–12 months) sustains supplier dependence and failures risk SLA breaches in pharma and fresh categories.
- CapEx: reefer $50k–150k
- IoT unit: $20–200
- Calibration: 6–12 months
- Compliance: GDP/FDA/CFDA
Labor and gig networks
- Peak-season shortages → higher overtime premiums
- Automation & training reduce turnover
- Scheduling algorithms cut labor inefficiency
- Policy changes on gig work raise fixed costs
Supplier power tight: real estate, fleet, hardware, labor — mitigated by scale, 1,400+ warehouses
Vehicle/fuel, real estate, tech vendors and labor exert concentrated supplier power; JD offsets with scale purchasing, 1,400+ self-built warehouses, in‑house R&D and automation. Vacancy in tier‑1/2 urban nodes <5% in 2024 and 154.4bn parcels in 2023 keep cost pressure. Specialized kit (reefer $50k–150k; IoT $20–200) and 6–12m calibration cycles sustain dependence; chip shortages in 2024 delayed rollouts.
| Supplier | Key metric (2023/24) | JD mitigant |
|---|---|---|
| Real estate | Vacancy <5% (2024) | 1,400+ self-built, long leases |
| Fleet/fuel | Parcels 154.4bn (2023) | Scale buying, alt-energy fleets |
| Tech/hardware | Reefer $50k–150k; IoT $20–200 | In-house R&D, multi-sourcing |
| Labor | Peak shortages, gig policy risk | Automation, training, scheduling |
What is included in the product
Detailed Word Document
Concise Porter's Five Forces assessment of JD Logistics, revealing competitive intensity, buyer and supplier power, substitutes and entry barriers, and highlighting disruptive threats and strategic levers that influence its pricing, margins, and market positioning.
Customizable Excel Spreadsheet
A concise one-sheet Porter’s Five Forces for JD Logistics that visualizes competitive pressures with an editable spider chart for rapid strategic decisions; customize inputs, scenarios, and labels without macros to plug directly into decks, dashboards, or boardroom reports.
Customers Bargaining Power
Large enterprise shippers
Large enterprise shippers — major e-commerce platforms, 3C, FMCG and apparel clients — exert strong bargaining power in 2024, using volume to press for rate discounts, tighter SLAs and bundled value-adds. JD defends margins via tiered pricing, integrated end-to-end solutions that increase stickiness and multi-year contract tenures. Persistent annual RFP re-bids keep pricing pressure elevated.
Multi-sourcing options
Customers can split volumes across SF, ZTO, YTO, STO, Cainiao partners and regional carriers, leveraging China's parcel network that handled about 120 billion parcels in 2023, creating credible outside options and raising buyer power. JD Logistics counters with end-to-end integration and nationwide coverage to reduce switching appeal. Real-time performance dashboards and contractual penalties further anchor retention.
Price transparency
Price transparency from digital freight platforms and benchmarking in 2024 lets buyers compare rates across carriers in real time, driving negotiation power and compressing margins; industry reports show benchmarking-driven rate pressure of around 10–15% for standard lanes. JD must justify any premium through demonstrable reliability, faster SLAs and tech-enabled visibility, while using dynamic pricing and cost-to-serve analytics to protect margins.
Integration switching costs
Integration switching costs for customers are moderate-to-high as deep API/OMS/WMS links and customized SOPs, packaging and returns flows embed operations; by 2024 standardized interfaces are lowering onboarding time while JD Logistics raises exit friction through co-designed workflows and operational tie-ins.
- Integration depth: API/OMS/WMS
- Customization: SOPs, packaging, returns
- Trend 2024: rising standardization
- JD play: co-designed workflows to increase switching cost
Demand volatility
Demand volatility around Double 11 and 618 drives large, short-term shifts in buyer volumes and contract terms, with clients often requesting surge capacity without long-term commitments; JD Logistics offsets this via flexible capacity allocation and surge pricing to protect utilization. Forecast sharing and vendor-managed inventory programs align incentives, smoothing peaks and lowering spot-surge reliance.
- Seasonal spikes: Double 11, 618
- Client demand: surge capacity, no long-term commitment
- JD tools: flexible capacity, surge pricing
- Mitigation: forecast sharing, VMI
Enterprise shippers force 10-15% lane-rate cuts; China 120bn parcels create strong alternatives
Large enterprise shippers exert strong bargaining power in 2024, leveraging volume for discounts, tighter SLAs and bundled services. Rate transparency and benchmarking drive ~10–15% downward pressure on standard lanes; China handled about 120 billion parcels in 2023, creating credible outside options. JD defends margins with tiered pricing, end-to-end integration, contract tenures and surge pricing for peak events.
| Metric | 2023/2024 | Impact on JD |
|---|---|---|
| China parcel volume | ~120bn (2023) | more buyer options |
| Benchmark rate pressure | ~10–15% (2024) | compresses margins |
| Peak events | Double 11, 618 | surge demand, spot pricing |
Full Version Awaits
JD Logistics Porter's Five Forces Analysis
This preview shows the exact Porter’s Five Forces analysis of JD Logistics you’ll receive upon purchase—fully written, formatted, and ready to download. It covers competitive rivalry, supplier and buyer power, entry threats, and substitution risk. No placeholders or samples—this is the final deliverable.
Original: $10.00
-65%$10.00
$3.50Description
Elevate Your Analysis with the Complete Porter's Five Forces Analysis
This snapshot highlights JD Logistics’ competitive intensity—strong supplier relationships, rising buyer sophistication, moderate barriers to entry, and growing substitute and rivalry pressures; it’s a concise view of industry tensions and strategic levers. Unlock the full Porter’s Five Forces Analysis to access force-by-force ratings, visuals, and actionable insights tailored to JD Logistics. Purchase the complete report for a consultant-grade, ready-to-use breakdown.
Suppliers Bargaining Power
Fleet and fuel vendors
Vehicle OEMs, leasing firms and fuel suppliers can shift costs via pricing cycles and availability; JD Logistics counters with scale purchasing, multi-sourcing and growing alternative-energy fleets, plus long-term contracts and hedging to damp volatility. Sudden spikes in oil prices or battery material inputs can still compress margins rapidly, and structural dependence on external fleet and fuel markets remains.
Warehouse landlords
Land scarcity in tier-1/2 cities gives industrial park owners leverage on rents and renewals, with vacancy in prime urban logistics nodes under 5% in 2024, keeping upward pressure on fees. JD’s network of over 1,400 self-built warehouses and long-term leases cushions this supplier power and limits immediate exposure. Relocation risks raise switching costs and operational disruption, while real estate cycles can quickly ease or tighten landlord leverage.
Automation and tech suppliers
Robotics, WMS and AI vendors supply critical systems with few best-in-class alternatives, concentrating supplier power and raising prices and delivery leverage. Vendor lock-in and integration complexity increase switching costs, especially for large-scale hubs. JD’s in-house R&D in 2024 reduces dependence but still requires specialized hardware and components. Global chip and sensor supply constraints in 2024 can delay rollouts and extend timelines.
Cold-chain equipment providers
Cold-chain equipment providers — reefer trucks ($50,000–150,000), IoT sensors ($20–200) and temperature-control units — are specialized and costly; certification and compliance (GDP, FDA/CFDA standards) narrow supplier options. JD Logistics’ scale improves bargaining but routine maintenance/calibration (typically every 6–12 months) sustains supplier dependence and failures risk SLA breaches in pharma and fresh categories.
- CapEx: reefer $50k–150k
- IoT unit: $20–200
- Calibration: 6–12 months
- Compliance: GDP/FDA/CFDA
Labor and gig networks
- Peak-season shortages → higher overtime premiums
- Automation & training reduce turnover
- Scheduling algorithms cut labor inefficiency
- Policy changes on gig work raise fixed costs
Supplier power tight: real estate, fleet, hardware, labor — mitigated by scale, 1,400+ warehouses
Vehicle/fuel, real estate, tech vendors and labor exert concentrated supplier power; JD offsets with scale purchasing, 1,400+ self-built warehouses, in‑house R&D and automation. Vacancy in tier‑1/2 urban nodes <5% in 2024 and 154.4bn parcels in 2023 keep cost pressure. Specialized kit (reefer $50k–150k; IoT $20–200) and 6–12m calibration cycles sustain dependence; chip shortages in 2024 delayed rollouts.
| Supplier | Key metric (2023/24) | JD mitigant |
|---|---|---|
| Real estate | Vacancy <5% (2024) | 1,400+ self-built, long leases |
| Fleet/fuel | Parcels 154.4bn (2023) | Scale buying, alt-energy fleets |
| Tech/hardware | Reefer $50k–150k; IoT $20–200 | In-house R&D, multi-sourcing |
| Labor | Peak shortages, gig policy risk | Automation, training, scheduling |
What is included in the product
Detailed Word Document
Concise Porter's Five Forces assessment of JD Logistics, revealing competitive intensity, buyer and supplier power, substitutes and entry barriers, and highlighting disruptive threats and strategic levers that influence its pricing, margins, and market positioning.
Customizable Excel Spreadsheet
A concise one-sheet Porter’s Five Forces for JD Logistics that visualizes competitive pressures with an editable spider chart for rapid strategic decisions; customize inputs, scenarios, and labels without macros to plug directly into decks, dashboards, or boardroom reports.
Customers Bargaining Power
Large enterprise shippers
Large enterprise shippers — major e-commerce platforms, 3C, FMCG and apparel clients — exert strong bargaining power in 2024, using volume to press for rate discounts, tighter SLAs and bundled value-adds. JD defends margins via tiered pricing, integrated end-to-end solutions that increase stickiness and multi-year contract tenures. Persistent annual RFP re-bids keep pricing pressure elevated.
Multi-sourcing options
Customers can split volumes across SF, ZTO, YTO, STO, Cainiao partners and regional carriers, leveraging China's parcel network that handled about 120 billion parcels in 2023, creating credible outside options and raising buyer power. JD Logistics counters with end-to-end integration and nationwide coverage to reduce switching appeal. Real-time performance dashboards and contractual penalties further anchor retention.
Price transparency
Price transparency from digital freight platforms and benchmarking in 2024 lets buyers compare rates across carriers in real time, driving negotiation power and compressing margins; industry reports show benchmarking-driven rate pressure of around 10–15% for standard lanes. JD must justify any premium through demonstrable reliability, faster SLAs and tech-enabled visibility, while using dynamic pricing and cost-to-serve analytics to protect margins.
Integration switching costs
Integration switching costs for customers are moderate-to-high as deep API/OMS/WMS links and customized SOPs, packaging and returns flows embed operations; by 2024 standardized interfaces are lowering onboarding time while JD Logistics raises exit friction through co-designed workflows and operational tie-ins.
- Integration depth: API/OMS/WMS
- Customization: SOPs, packaging, returns
- Trend 2024: rising standardization
- JD play: co-designed workflows to increase switching cost
Demand volatility
Demand volatility around Double 11 and 618 drives large, short-term shifts in buyer volumes and contract terms, with clients often requesting surge capacity without long-term commitments; JD Logistics offsets this via flexible capacity allocation and surge pricing to protect utilization. Forecast sharing and vendor-managed inventory programs align incentives, smoothing peaks and lowering spot-surge reliance.
- Seasonal spikes: Double 11, 618
- Client demand: surge capacity, no long-term commitment
- JD tools: flexible capacity, surge pricing
- Mitigation: forecast sharing, VMI
Enterprise shippers force 10-15% lane-rate cuts; China 120bn parcels create strong alternatives
Large enterprise shippers exert strong bargaining power in 2024, leveraging volume for discounts, tighter SLAs and bundled services. Rate transparency and benchmarking drive ~10–15% downward pressure on standard lanes; China handled about 120 billion parcels in 2023, creating credible outside options. JD defends margins with tiered pricing, end-to-end integration, contract tenures and surge pricing for peak events.
| Metric | 2023/2024 | Impact on JD |
|---|---|---|
| China parcel volume | ~120bn (2023) | more buyer options |
| Benchmark rate pressure | ~10–15% (2024) | compresses margins |
| Peak events | Double 11, 618 | surge demand, spot pricing |
Full Version Awaits
JD Logistics Porter's Five Forces Analysis
This preview shows the exact Porter’s Five Forces analysis of JD Logistics you’ll receive upon purchase—fully written, formatted, and ready to download. It covers competitive rivalry, supplier and buyer power, entry threats, and substitution risk. No placeholders or samples—this is the final deliverable.











