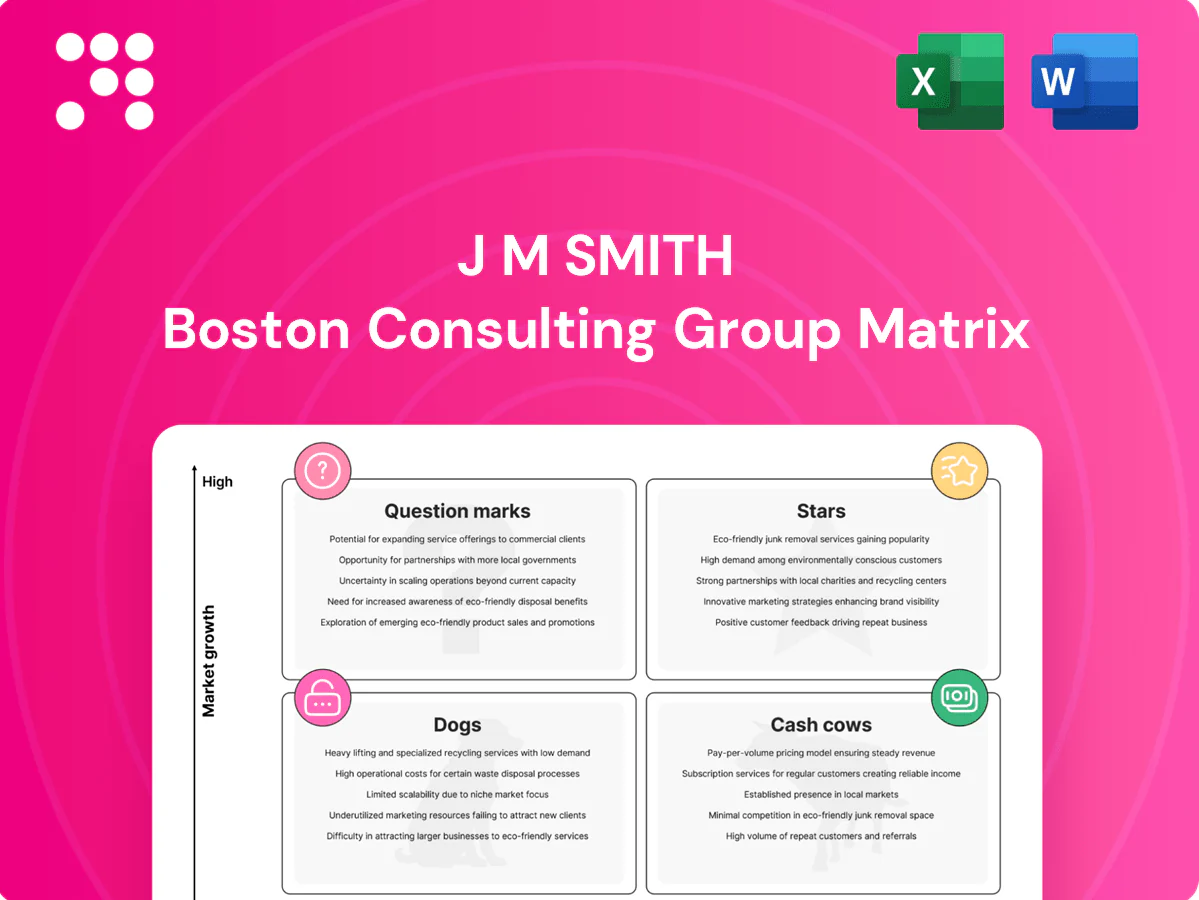
J M Smith Boston Consulting Group Matrix

Visual. Strategic. Downloadable.
J M Smith’s quick BCG snapshot shows where your products sit in the market — some are pulling in cash, others need questions answered, and a couple might be draining resources. Want the full picture with quadrant-by-quadrant placement, clear strategic moves, and data you can act on? Purchase the complete BCG Matrix for a detailed Word report plus an editable Excel summary and get ready-to-use recommendations to guide investment and product decisions. Buy now and skip the guesswork.
Stars

Cloud-native pharmacy management platform
Cloud-native pharmacy management sits in a high-growth market as pharmacies modernize workflows and compliance—global pharmacy management market CAGR about 9% (2024–2030) with 2024 adoption spikes in automation and e-prescribing. J M Smith’s integrated stack secures strong share among existing customers and creates tight switching costs through data, supply and billing integrations. Heavy reinvestment in integrations and uptime is required, but that investment underpins durable leadership; sustaining product velocity now is critical before the market plateaus.
LTC pharmacy software (enterprise + eMAR)
LTC pharmacy software (enterprise + eMAR) is a Star as long-term care and closed-door pharmacies digitize rapidly to serve roughly 1.3 million U.S. nursing home residents (2024); J M Smith’s workflows and facility interfaces make it default in many regions. Rapid growth consumes cash—certifications, eMAR/EMR interfaces and scaled support drive capex and Opex. Invest to lock facility networks and convert incumbents; successful scale can mature into a Cash Cow.

Interoperability & ePrescribing rails
Federal mandates from the 21st Century Cures Act and CMS interoperability rules have accelerated clinical data exchange, making HL7/FHIR the de facto standard by 2024. Owning eRx, PDMP (implemented across all 50 states) and routing rails creates market share and pricing leverage for J M Smith. With U.S. prescription fills exceeding 4 billion annually, volume growth drives sustained reliability and security spend—double down to be the easiest provider/payer on-ramp to pharmacy.

Specialty and adherence programs
Specialty therapies grew about 9% in 2024 versus overall pharma growth near 3%, driving complex workflows that favor J M Smith’s prior-auth, hub links, and adherence tooling which win accounts needing speed-to-therapy; these services demand capital for integrations but enable premium per-script fees and higher retention.
- Scale: standardize playbooks
- Expand: deepen payer partnerships
- Benefit: higher ARPU from specialty scripts
Data services for pharmacy performance
Stars: Data services for pharmacy performance sit in the high-growth quadrant in 2024 as payers and chains demand actionable insights now. With visibility across dispensing, claims, and outcomes the firm can package high-value analytics and real-time alerts to drive retention and margin. Rapid expansion requires continued investment in data engineering and governance to widen the moat with benchmark datasets and live monitoring.
- Actionable insights: cross-dispensing, claims, outcomes
- Investment need: data engineering & governance
- Differentiator: benchmarks + real-time alerts
Cloud-native pharmacy + LTC: monetize 9% CAGR and 4B fills
Stars: Cloud-native pharmacy and LTC software sit in ~9% CAGR markets (2024–2030) with LTC serving ~1.3M residents (2024) and US fills >4B/year (2024). Specialty scripts +9% (2024) drive higher ARPU; data services scale retention. Continued heavy investment in integrations, data engineering and uptime is required to convert growth into cash flow.
| Star | 2024 metric | Investment |
|---|---|---|
| Cloud-native PM | 9% CAGR | Integrations, uptime |
| LTC software | 1.3M residents | eMAR/EMR certs |
| Data services | 4B fills/yr | Data eng & governance |
What is included in the product
 Detailed Word Document
BCG Matrix review of J M Smith's portfolio, detailing Stars, Cash Cows, Question Marks and Dogs with strategic recommendations.

 Customizable Excel Spreadsheet
One-page J M Smith BCG Matrix mapping units to quadrants for instant portfolio clarity - print-ready and presentation-polished.
Cash Cows

Wholesale drug distribution (regional)
Regional wholesale drug distribution sits in a mature market with stable demand and predictable volume, as US prescription drug spend reached about $600B in 2024 (IQVIA), supporting steady throughput. Established buyer relationships and logistics density protect margins, enabling low single-digit operating margin stability. The business needs incremental efficiency capex rather than heavy marketing, and can milk steady cash to fund software expansion and selective M&A.
Maintenance and support on installed pharmacy systems
For J M Smith this large installed base delivers recurring maintenance fees—industry-standard annual maintenance rates are ~18–22% of license value—providing predictable revenue. Low churn (~3–5% annually) and standardized SLAs keep service costs contained and uptime targets at 99.9%. Minimal promotion required; focus is on renewals and availability. Optimizing tooling and self-service can boost contribution margin by 5–10 percentage points.

Claims switching and transaction fees
High share in a mature, price-disciplined niche makes claims switching and transaction fees a classic cash cow for J M Smith, with volume staying sticky once integrated into pharmacy workflows. Margins scale as adjudication automates, lowering per-claim costs and boosting operating leverage. Focus on reliability and negotiating carrier rates preserves cash generation; let this line print steady cash for reinvestment.

Hardware and peripherals lifecycle (scanners, labelers)
Hardware and peripherals (scanners, labelers) act as cash cows for J M Smith with predictable 3–5 year replacement cycles and bundled procurement driving steady revenue; once embedded with software, competition drops and recurring sales rise. Low marketing intensity shifts margin drivers to procurement and service efficiency, with typical gross margins around 20–35% in 2024.
- Replace cycle: 3–5 years
- Bundled procurement → recurring revenue
- Embedded software reduces competition
- Margins driven by procurement/service (≈20–35% in 2024)
- Standardize SKUs & streamline RMA to sustain cash flow
Training and certification programs
Training and certification programs generate recurring cohorts from new hires and mandatory compliance refreshers, tapping a 2024 global corporate training market ~USD 400B and steady demand. Content amortizes across cohorts, driving high contribution margins; sales are pull-driven via renewals and onboarding funnels. Keeping content current and automating scheduling preserves profitability.
- Recurring cohorts
- Content amortization
- High margins
- Renewal-driven sales
- Automate scheduling
Cash cows tap $600B Rx, maintenance 18–22%
J M Smith cash cows deliver steady free cash: wholesale distribution taps a ~$600B US Rx market (2024), software maintenance yields ~18–22% ARR, churn 3–5%; claims/transaction fees scale with automation; hardware margins ~20–35% on 3–5yr replace cycles; training leverages a ~$400B 2024 market with high contribution margins.
| Line | Key 2024 metrics |
|---|---|
| Wholesale | $600B market |
| Maintenance | 18–22% ARR, churn 3–5% |
| Hardware | 20–35% margin, 3–5yr cycle |
| Training | $400B market |
Delivered as Shown
J M Smith BCG Matrix
The file you're previewing is the exact J M Smith BCG Matrix you'll receive after purchase. No watermarks, no placeholders—just the fully formatted, presentation-ready report. It's crafted for clear strategic insight and immediate use. Buy once, download instantly, and start editing or presenting to your team right away.

Visual. Strategic. Downloadable.
J M Smith’s quick BCG snapshot shows where your products sit in the market — some are pulling in cash, others need questions answered, and a couple might be draining resources. Want the full picture with quadrant-by-quadrant placement, clear strategic moves, and data you can act on? Purchase the complete BCG Matrix for a detailed Word report plus an editable Excel summary and get ready-to-use recommendations to guide investment and product decisions. Buy now and skip the guesswork.
Stars
Cloud-native pharmacy management platform
Cloud-native pharmacy management sits in a high-growth market as pharmacies modernize workflows and compliance—global pharmacy management market CAGR about 9% (2024–2030) with 2024 adoption spikes in automation and e-prescribing. J M Smith’s integrated stack secures strong share among existing customers and creates tight switching costs through data, supply and billing integrations. Heavy reinvestment in integrations and uptime is required, but that investment underpins durable leadership; sustaining product velocity now is critical before the market plateaus.
LTC pharmacy software (enterprise + eMAR)
LTC pharmacy software (enterprise + eMAR) is a Star as long-term care and closed-door pharmacies digitize rapidly to serve roughly 1.3 million U.S. nursing home residents (2024); J M Smith’s workflows and facility interfaces make it default in many regions. Rapid growth consumes cash—certifications, eMAR/EMR interfaces and scaled support drive capex and Opex. Invest to lock facility networks and convert incumbents; successful scale can mature into a Cash Cow.
Interoperability & ePrescribing rails
Federal mandates from the 21st Century Cures Act and CMS interoperability rules have accelerated clinical data exchange, making HL7/FHIR the de facto standard by 2024. Owning eRx, PDMP (implemented across all 50 states) and routing rails creates market share and pricing leverage for J M Smith. With U.S. prescription fills exceeding 4 billion annually, volume growth drives sustained reliability and security spend—double down to be the easiest provider/payer on-ramp to pharmacy.
Specialty and adherence programs
Specialty therapies grew about 9% in 2024 versus overall pharma growth near 3%, driving complex workflows that favor J M Smith’s prior-auth, hub links, and adherence tooling which win accounts needing speed-to-therapy; these services demand capital for integrations but enable premium per-script fees and higher retention.
- Scale: standardize playbooks
- Expand: deepen payer partnerships
- Benefit: higher ARPU from specialty scripts
Data services for pharmacy performance
Stars: Data services for pharmacy performance sit in the high-growth quadrant in 2024 as payers and chains demand actionable insights now. With visibility across dispensing, claims, and outcomes the firm can package high-value analytics and real-time alerts to drive retention and margin. Rapid expansion requires continued investment in data engineering and governance to widen the moat with benchmark datasets and live monitoring.
- Actionable insights: cross-dispensing, claims, outcomes
- Investment need: data engineering & governance
- Differentiator: benchmarks + real-time alerts
Cloud-native pharmacy + LTC: monetize 9% CAGR and 4B fills
Stars: Cloud-native pharmacy and LTC software sit in ~9% CAGR markets (2024–2030) with LTC serving ~1.3M residents (2024) and US fills >4B/year (2024). Specialty scripts +9% (2024) drive higher ARPU; data services scale retention. Continued heavy investment in integrations, data engineering and uptime is required to convert growth into cash flow.
| Star | 2024 metric | Investment |
|---|---|---|
| Cloud-native PM | 9% CAGR | Integrations, uptime |
| LTC software | 1.3M residents | eMAR/EMR certs |
| Data services | 4B fills/yr | Data eng & governance |
What is included in the product
Detailed Word Document
BCG Matrix review of J M Smith's portfolio, detailing Stars, Cash Cows, Question Marks and Dogs with strategic recommendations.
Customizable Excel Spreadsheet
One-page J M Smith BCG Matrix mapping units to quadrants for instant portfolio clarity - print-ready and presentation-polished.
Cash Cows
Wholesale drug distribution (regional)
Regional wholesale drug distribution sits in a mature market with stable demand and predictable volume, as US prescription drug spend reached about $600B in 2024 (IQVIA), supporting steady throughput. Established buyer relationships and logistics density protect margins, enabling low single-digit operating margin stability. The business needs incremental efficiency capex rather than heavy marketing, and can milk steady cash to fund software expansion and selective M&A.
Maintenance and support on installed pharmacy systems
For J M Smith this large installed base delivers recurring maintenance fees—industry-standard annual maintenance rates are ~18–22% of license value—providing predictable revenue. Low churn (~3–5% annually) and standardized SLAs keep service costs contained and uptime targets at 99.9%. Minimal promotion required; focus is on renewals and availability. Optimizing tooling and self-service can boost contribution margin by 5–10 percentage points.
Claims switching and transaction fees
High share in a mature, price-disciplined niche makes claims switching and transaction fees a classic cash cow for J M Smith, with volume staying sticky once integrated into pharmacy workflows. Margins scale as adjudication automates, lowering per-claim costs and boosting operating leverage. Focus on reliability and negotiating carrier rates preserves cash generation; let this line print steady cash for reinvestment.
Hardware and peripherals lifecycle (scanners, labelers)
Hardware and peripherals (scanners, labelers) act as cash cows for J M Smith with predictable 3–5 year replacement cycles and bundled procurement driving steady revenue; once embedded with software, competition drops and recurring sales rise. Low marketing intensity shifts margin drivers to procurement and service efficiency, with typical gross margins around 20–35% in 2024.
- Replace cycle: 3–5 years
- Bundled procurement → recurring revenue
- Embedded software reduces competition
- Margins driven by procurement/service (≈20–35% in 2024)
- Standardize SKUs & streamline RMA to sustain cash flow
Training and certification programs
Training and certification programs generate recurring cohorts from new hires and mandatory compliance refreshers, tapping a 2024 global corporate training market ~USD 400B and steady demand. Content amortizes across cohorts, driving high contribution margins; sales are pull-driven via renewals and onboarding funnels. Keeping content current and automating scheduling preserves profitability.
- Recurring cohorts
- Content amortization
- High margins
- Renewal-driven sales
- Automate scheduling
Cash cows tap $600B Rx, maintenance 18–22%
J M Smith cash cows deliver steady free cash: wholesale distribution taps a ~$600B US Rx market (2024), software maintenance yields ~18–22% ARR, churn 3–5%; claims/transaction fees scale with automation; hardware margins ~20–35% on 3–5yr replace cycles; training leverages a ~$400B 2024 market with high contribution margins.
| Line | Key 2024 metrics |
|---|---|
| Wholesale | $600B market |
| Maintenance | 18–22% ARR, churn 3–5% |
| Hardware | 20–35% margin, 3–5yr cycle |
| Training | $400B market |
Delivered as Shown
J M Smith BCG Matrix
The file you're previewing is the exact J M Smith BCG Matrix you'll receive after purchase. No watermarks, no placeholders—just the fully formatted, presentation-ready report. It's crafted for clear strategic insight and immediate use. Buy once, download instantly, and start editing or presenting to your team right away.
Description
Visual. Strategic. Downloadable.
J M Smith’s quick BCG snapshot shows where your products sit in the market — some are pulling in cash, others need questions answered, and a couple might be draining resources. Want the full picture with quadrant-by-quadrant placement, clear strategic moves, and data you can act on? Purchase the complete BCG Matrix for a detailed Word report plus an editable Excel summary and get ready-to-use recommendations to guide investment and product decisions. Buy now and skip the guesswork.
Stars
Cloud-native pharmacy management platform
Cloud-native pharmacy management sits in a high-growth market as pharmacies modernize workflows and compliance—global pharmacy management market CAGR about 9% (2024–2030) with 2024 adoption spikes in automation and e-prescribing. J M Smith’s integrated stack secures strong share among existing customers and creates tight switching costs through data, supply and billing integrations. Heavy reinvestment in integrations and uptime is required, but that investment underpins durable leadership; sustaining product velocity now is critical before the market plateaus.
LTC pharmacy software (enterprise + eMAR)
LTC pharmacy software (enterprise + eMAR) is a Star as long-term care and closed-door pharmacies digitize rapidly to serve roughly 1.3 million U.S. nursing home residents (2024); J M Smith’s workflows and facility interfaces make it default in many regions. Rapid growth consumes cash—certifications, eMAR/EMR interfaces and scaled support drive capex and Opex. Invest to lock facility networks and convert incumbents; successful scale can mature into a Cash Cow.
Interoperability & ePrescribing rails
Federal mandates from the 21st Century Cures Act and CMS interoperability rules have accelerated clinical data exchange, making HL7/FHIR the de facto standard by 2024. Owning eRx, PDMP (implemented across all 50 states) and routing rails creates market share and pricing leverage for J M Smith. With U.S. prescription fills exceeding 4 billion annually, volume growth drives sustained reliability and security spend—double down to be the easiest provider/payer on-ramp to pharmacy.
Specialty and adherence programs
Specialty therapies grew about 9% in 2024 versus overall pharma growth near 3%, driving complex workflows that favor J M Smith’s prior-auth, hub links, and adherence tooling which win accounts needing speed-to-therapy; these services demand capital for integrations but enable premium per-script fees and higher retention.
- Scale: standardize playbooks
- Expand: deepen payer partnerships
- Benefit: higher ARPU from specialty scripts
Data services for pharmacy performance
Stars: Data services for pharmacy performance sit in the high-growth quadrant in 2024 as payers and chains demand actionable insights now. With visibility across dispensing, claims, and outcomes the firm can package high-value analytics and real-time alerts to drive retention and margin. Rapid expansion requires continued investment in data engineering and governance to widen the moat with benchmark datasets and live monitoring.
- Actionable insights: cross-dispensing, claims, outcomes
- Investment need: data engineering & governance
- Differentiator: benchmarks + real-time alerts
Cloud-native pharmacy + LTC: monetize 9% CAGR and 4B fills
Stars: Cloud-native pharmacy and LTC software sit in ~9% CAGR markets (2024–2030) with LTC serving ~1.3M residents (2024) and US fills >4B/year (2024). Specialty scripts +9% (2024) drive higher ARPU; data services scale retention. Continued heavy investment in integrations, data engineering and uptime is required to convert growth into cash flow.
| Star | 2024 metric | Investment |
|---|---|---|
| Cloud-native PM | 9% CAGR | Integrations, uptime |
| LTC software | 1.3M residents | eMAR/EMR certs |
| Data services | 4B fills/yr | Data eng & governance |
What is included in the product
Detailed Word Document
BCG Matrix review of J M Smith's portfolio, detailing Stars, Cash Cows, Question Marks and Dogs with strategic recommendations.
Customizable Excel Spreadsheet
One-page J M Smith BCG Matrix mapping units to quadrants for instant portfolio clarity - print-ready and presentation-polished.
Cash Cows
Wholesale drug distribution (regional)
Regional wholesale drug distribution sits in a mature market with stable demand and predictable volume, as US prescription drug spend reached about $600B in 2024 (IQVIA), supporting steady throughput. Established buyer relationships and logistics density protect margins, enabling low single-digit operating margin stability. The business needs incremental efficiency capex rather than heavy marketing, and can milk steady cash to fund software expansion and selective M&A.
Maintenance and support on installed pharmacy systems
For J M Smith this large installed base delivers recurring maintenance fees—industry-standard annual maintenance rates are ~18–22% of license value—providing predictable revenue. Low churn (~3–5% annually) and standardized SLAs keep service costs contained and uptime targets at 99.9%. Minimal promotion required; focus is on renewals and availability. Optimizing tooling and self-service can boost contribution margin by 5–10 percentage points.
Claims switching and transaction fees
High share in a mature, price-disciplined niche makes claims switching and transaction fees a classic cash cow for J M Smith, with volume staying sticky once integrated into pharmacy workflows. Margins scale as adjudication automates, lowering per-claim costs and boosting operating leverage. Focus on reliability and negotiating carrier rates preserves cash generation; let this line print steady cash for reinvestment.
Hardware and peripherals lifecycle (scanners, labelers)
Hardware and peripherals (scanners, labelers) act as cash cows for J M Smith with predictable 3–5 year replacement cycles and bundled procurement driving steady revenue; once embedded with software, competition drops and recurring sales rise. Low marketing intensity shifts margin drivers to procurement and service efficiency, with typical gross margins around 20–35% in 2024.
- Replace cycle: 3–5 years
- Bundled procurement → recurring revenue
- Embedded software reduces competition
- Margins driven by procurement/service (≈20–35% in 2024)
- Standardize SKUs & streamline RMA to sustain cash flow
Training and certification programs
Training and certification programs generate recurring cohorts from new hires and mandatory compliance refreshers, tapping a 2024 global corporate training market ~USD 400B and steady demand. Content amortizes across cohorts, driving high contribution margins; sales are pull-driven via renewals and onboarding funnels. Keeping content current and automating scheduling preserves profitability.
- Recurring cohorts
- Content amortization
- High margins
- Renewal-driven sales
- Automate scheduling
Cash cows tap $600B Rx, maintenance 18–22%
J M Smith cash cows deliver steady free cash: wholesale distribution taps a ~$600B US Rx market (2024), software maintenance yields ~18–22% ARR, churn 3–5%; claims/transaction fees scale with automation; hardware margins ~20–35% on 3–5yr replace cycles; training leverages a ~$400B 2024 market with high contribution margins.
| Line | Key 2024 metrics |
|---|---|
| Wholesale | $600B market |
| Maintenance | 18–22% ARR, churn 3–5% |
| Hardware | 20–35% margin, 3–5yr cycle |
| Training | $400B market |
Delivered as Shown
J M Smith BCG Matrix
The file you're previewing is the exact J M Smith BCG Matrix you'll receive after purchase. No watermarks, no placeholders—just the fully formatted, presentation-ready report. It's crafted for clear strategic insight and immediate use. Buy once, download instantly, and start editing or presenting to your team right away.











