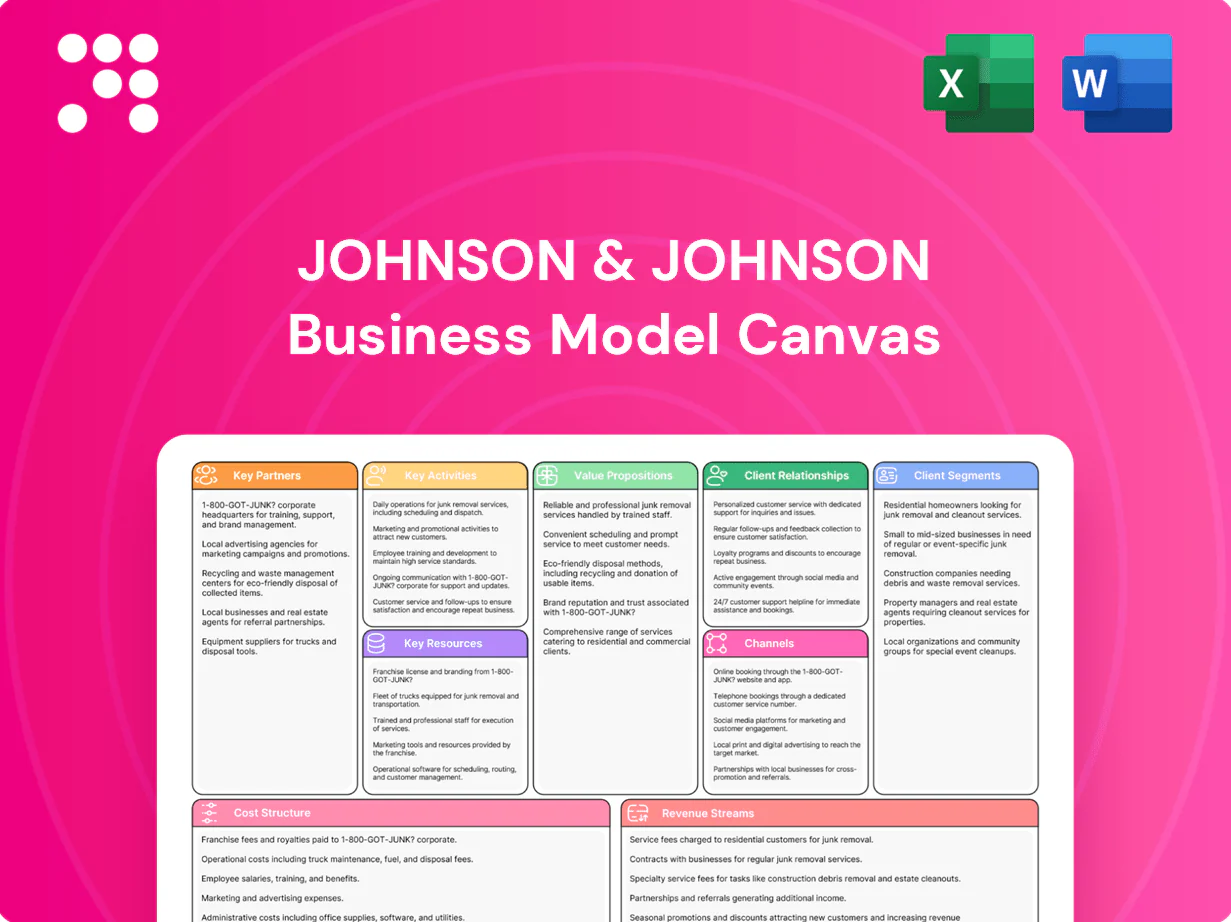
Johnson & Johnson Business Model Canvas

Business Model Canvas for a diversified healthcare leader: pharma, medtech, consumer health
Unlock Johnson & Johnson’s strategic blueprint with a concise Business Model Canvas that maps its value propositions, key partners, and revenue engines across pharmaceuticals, medtech, and consumer health. Ideal for investors, consultants, and founders seeking actionable, company-specific insights—download the full Word/Excel canvas to benchmark and apply proven growth levers.
Partnerships

Academic and biotech R&D alliances
Collaborations with universities and biotech firms accelerate discovery and de-risk early science, with J&J leveraging co-development and option-to-license deals alongside incubators such as JLABS (launched 2012) that have supported over 1,000 startups globally. These alliances expand the pipeline—across oncology, immunology, neuroscience and cardiovascular—by adding novel modalities and platform technologies. J&J sustains multi-billion-dollar annual R&D investment to co-fund and scale external innovation.
Hospitals, surgeons, and clinical networks
Johnson & Johnson MedTech relies on surgical KOLs and integrated delivery networks for co-design, training and evidence generation, with >200 hospital partnerships supporting device iterations and surgeon proctoring. Clinical networks enable multi-center trials (dozens–100+ sites) and real-world data capture to drive regulatory and reimbursement claims. ERAS adoption and procedure standardization cut LOS by ~2 days and complications by 30–50%, accelerating device uptake.

Regulators and health technology assessment bodies
Early scientific advice from FDA (PDUFA target 10 months, 6 months for priority review) and EMA (centralised review target 210 days) helps J&J align trial design with regulatory expectations. Engagements with HTA bodies like NICE (QALY thresholds ~£20,000–30,000) and payer partners shape value dossiers and economic models. These partnerships accelerate approvals, optimize market access and coordinate post‑market commitments for label expansion and safety monitoring.

Manufacturing, component, and CDMO partners
Complex biologics and advanced devices demand resilient supply chains and specialized inputs; Johnson & Johnson leverages API suppliers, contract manufacturers and precision component makers across its global network, operating in more than 60 countries (2024). Dual-sourcing, binding quality agreements and GMP audits reduce disruption risk, while strategic CDMO capacity is scaled during launches and commercial scale-ups to meet demand.
- API suppliers
- CMOs/CDMOs
- Precision component makers
- Dual-sourcing & quality agreements
Distribution, specialty pharmacy, and GPO partnerships
Pharmaceuticals flow through specialty distributors and pharmacies to hospitals and clinics, with specialty drugs accounting for about 50% of US drug spend in 2023 (IQVIA); J&J leverages these channels for access and patient support. MedTech benefits from GPO contracts that cover roughly 70% of US hospital purchasing and regional distributors for last-mile delivery, streamlining tendering, inventory and cold-chain logistics to broaden reach across mature and emerging markets.
- Specialty distribution: channels to hospitals, clinics, patient hub support
- Specialty pharmacy: adherence, infusion, cold-chain handling
- GPOs: aggregated purchasing, price negotiation (~70% hospital coverage)
- Regional distributors: last-mile, inventory, tenders—expand market reach
De-risking early science: >1,000 startups, 60+ countries
J&J partners with universities, biotech and JLABS (>1,000 startups) to de-risk early science and expand pipelines, backed by multi-billion-dollar annual R&D. MedTech co-design with >200 hospital partners and surgical KOLs accelerates adoption. Global supply/CDMO and distributors span 60+ countries (2024); specialty drugs ~50% US drug spend (2023); GPOs ~70% hospital coverage.
| Partner | Role | Metric |
|---|---|---|
| JLABS/startups | Early innovation | >1,000 startups |
| Hospitals/KOLs | Co-design/trials | >200 partners |
| Supply/CDMO | Manufacture/scale | 60+ countries (2024) |
| Channels | Access | Specialty drugs 50% (2023); GPOs ~70% |
What is included in the product
 Detailed Word Document
A comprehensive Business Model Canvas for Johnson & Johnson mapping customer segments, channels, value propositions, key resources, partners, activities, cost structure and revenue streams with strategic insights. Designed for presentations and investor discussions, it links competitive advantages and SWOT analysis to each BMC block for actionable decision-making.

 Customizable Excel Spreadsheet
High-level view of Johnson & Johnson’s business model with editable cells to condense its complex healthcare, pharmaceutical, and consumer segments into a single-page strategic snapshot, saving hours of formatting and simplifying boardroom or team discussions.
Activities

Target discovery and clinical development
Rigorous translational research feeds a diversified pipeline leveraged by J&J’s 138-year legacy (founded 1886); global Phase I–III trials run across 60+ countries with embedded biomarker strategies. Adaptive designs and decentralized elements accelerate enrollment and real-world insights. Evidence packages are assembled to satisfy regulators, payers and clinicians.
Regulatory, quality, and compliance management
End-to-end QA/QC ensures safety across Johnson & Johnson medicines and devices, with integrated testing and batch release protocols. In 2024 regulatory teams managed submissions, inspections, and continuous vigilance reporting to regulators. ISO and GMP standards anchor manufacturing and post-market surveillance, and robust compliance programs lower recall and legal risk.

Advanced manufacturing and supply operations
Advanced manufacturing at Johnson & Johnson leverages bioreactors, aseptic fill-finish, and additive manufacturing across 250+ global manufacturing sites to support complex biologics and device portfolios in 175+ countries. Network planning optimizes cost, resilience and service levels through regional capacity balancing. Digital twins and serialization improve traceability and yield. Continuous improvement programs reduce COGS while preserving quality.

Market access, pricing, and health economics
Value dossiers and cost-effectiveness models underpin reimbursement decisions, with health technology assessment used in over 50 countries in 2024; outcomes-based agreements and risk-sharing contracts align incentives and are increasingly used to secure access. Tender bid management optimizes volume and margin in centralized markets, where price erosion can exceed 20% on single-source tenders. Real-world evidence supports renewals and line extensions by demonstrating effectiveness and safety post-launch.
Surgeon education and customer support
Surgeon proctoring, simulation labs and in-the-OR support enable safe adoption of J&J technologies by reinforcing skills and reducing procedural variability; field service teams sustain device uptime and instrument readiness through preventive maintenance and rapid repairs. Patient support programs improve adherence and access, while closed-loop feedback from clinicians and patients informs product iterations and targeted training content.
- Proctoring and simulation
- In-OR technical support
- Field service & maintenance
- Patient adherence programs
- Feedback-driven R&D & training
Translational R&D: Trials in 60+ countries; supply to 175+ countries
Translational R&D fuels a diversified pipeline; global Phase I–III trials ran in 60+ countries (2024) with biomarker-led adaptive designs.
QA/QC and GMP across 250+ manufacturing sites ensure supply to 175+ countries; 2024 regulatory teams managed submissions and inspections.
HTA dossiers used in 50+ countries (2024); outcomes-based deals and tenders (up to >20% price erosion) drive access strategies.
| Activity | 2024 metric |
|---|---|
| Trials | 60+ countries |
| Manufacturing sites | 250+ |
| Countries served | 175+ |
| HTA use | 50+ countries |
Full Document Unlocks After Purchase
Business Model Canvas
The document you're previewing is the actual Johnson & Johnson Business Model Canvas you'll receive—it's not a mockup. Upon purchase you'll get this exact, fully editable file with all sections intact, formatted for presentation and analysis. No placeholders, no surprises—what you see is what you own.

Business Model Canvas for a diversified healthcare leader: pharma, medtech, consumer health
Unlock Johnson & Johnson’s strategic blueprint with a concise Business Model Canvas that maps its value propositions, key partners, and revenue engines across pharmaceuticals, medtech, and consumer health. Ideal for investors, consultants, and founders seeking actionable, company-specific insights—download the full Word/Excel canvas to benchmark and apply proven growth levers.
Partnerships
Academic and biotech R&D alliances
Collaborations with universities and biotech firms accelerate discovery and de-risk early science, with J&J leveraging co-development and option-to-license deals alongside incubators such as JLABS (launched 2012) that have supported over 1,000 startups globally. These alliances expand the pipeline—across oncology, immunology, neuroscience and cardiovascular—by adding novel modalities and platform technologies. J&J sustains multi-billion-dollar annual R&D investment to co-fund and scale external innovation.
Hospitals, surgeons, and clinical networks
Johnson & Johnson MedTech relies on surgical KOLs and integrated delivery networks for co-design, training and evidence generation, with >200 hospital partnerships supporting device iterations and surgeon proctoring. Clinical networks enable multi-center trials (dozens–100+ sites) and real-world data capture to drive regulatory and reimbursement claims. ERAS adoption and procedure standardization cut LOS by ~2 days and complications by 30–50%, accelerating device uptake.
Regulators and health technology assessment bodies
Early scientific advice from FDA (PDUFA target 10 months, 6 months for priority review) and EMA (centralised review target 210 days) helps J&J align trial design with regulatory expectations. Engagements with HTA bodies like NICE (QALY thresholds ~£20,000–30,000) and payer partners shape value dossiers and economic models. These partnerships accelerate approvals, optimize market access and coordinate post‑market commitments for label expansion and safety monitoring.
Manufacturing, component, and CDMO partners
Complex biologics and advanced devices demand resilient supply chains and specialized inputs; Johnson & Johnson leverages API suppliers, contract manufacturers and precision component makers across its global network, operating in more than 60 countries (2024). Dual-sourcing, binding quality agreements and GMP audits reduce disruption risk, while strategic CDMO capacity is scaled during launches and commercial scale-ups to meet demand.
- API suppliers
- CMOs/CDMOs
- Precision component makers
- Dual-sourcing & quality agreements
Distribution, specialty pharmacy, and GPO partnerships
Pharmaceuticals flow through specialty distributors and pharmacies to hospitals and clinics, with specialty drugs accounting for about 50% of US drug spend in 2023 (IQVIA); J&J leverages these channels for access and patient support. MedTech benefits from GPO contracts that cover roughly 70% of US hospital purchasing and regional distributors for last-mile delivery, streamlining tendering, inventory and cold-chain logistics to broaden reach across mature and emerging markets.
- Specialty distribution: channels to hospitals, clinics, patient hub support
- Specialty pharmacy: adherence, infusion, cold-chain handling
- GPOs: aggregated purchasing, price negotiation (~70% hospital coverage)
- Regional distributors: last-mile, inventory, tenders—expand market reach
De-risking early science: >1,000 startups, 60+ countries
J&J partners with universities, biotech and JLABS (>1,000 startups) to de-risk early science and expand pipelines, backed by multi-billion-dollar annual R&D. MedTech co-design with >200 hospital partners and surgical KOLs accelerates adoption. Global supply/CDMO and distributors span 60+ countries (2024); specialty drugs ~50% US drug spend (2023); GPOs ~70% hospital coverage.
| Partner | Role | Metric |
|---|---|---|
| JLABS/startups | Early innovation | >1,000 startups |
| Hospitals/KOLs | Co-design/trials | >200 partners |
| Supply/CDMO | Manufacture/scale | 60+ countries (2024) |
| Channels | Access | Specialty drugs 50% (2023); GPOs ~70% |
What is included in the product
Detailed Word Document
A comprehensive Business Model Canvas for Johnson & Johnson mapping customer segments, channels, value propositions, key resources, partners, activities, cost structure and revenue streams with strategic insights. Designed for presentations and investor discussions, it links competitive advantages and SWOT analysis to each BMC block for actionable decision-making.
Customizable Excel Spreadsheet
High-level view of Johnson & Johnson’s business model with editable cells to condense its complex healthcare, pharmaceutical, and consumer segments into a single-page strategic snapshot, saving hours of formatting and simplifying boardroom or team discussions.
Activities
Target discovery and clinical development
Rigorous translational research feeds a diversified pipeline leveraged by J&J’s 138-year legacy (founded 1886); global Phase I–III trials run across 60+ countries with embedded biomarker strategies. Adaptive designs and decentralized elements accelerate enrollment and real-world insights. Evidence packages are assembled to satisfy regulators, payers and clinicians.
Regulatory, quality, and compliance management
End-to-end QA/QC ensures safety across Johnson & Johnson medicines and devices, with integrated testing and batch release protocols. In 2024 regulatory teams managed submissions, inspections, and continuous vigilance reporting to regulators. ISO and GMP standards anchor manufacturing and post-market surveillance, and robust compliance programs lower recall and legal risk.
Advanced manufacturing and supply operations
Advanced manufacturing at Johnson & Johnson leverages bioreactors, aseptic fill-finish, and additive manufacturing across 250+ global manufacturing sites to support complex biologics and device portfolios in 175+ countries. Network planning optimizes cost, resilience and service levels through regional capacity balancing. Digital twins and serialization improve traceability and yield. Continuous improvement programs reduce COGS while preserving quality.
Market access, pricing, and health economics
Value dossiers and cost-effectiveness models underpin reimbursement decisions, with health technology assessment used in over 50 countries in 2024; outcomes-based agreements and risk-sharing contracts align incentives and are increasingly used to secure access. Tender bid management optimizes volume and margin in centralized markets, where price erosion can exceed 20% on single-source tenders. Real-world evidence supports renewals and line extensions by demonstrating effectiveness and safety post-launch.
Surgeon education and customer support
Surgeon proctoring, simulation labs and in-the-OR support enable safe adoption of J&J technologies by reinforcing skills and reducing procedural variability; field service teams sustain device uptime and instrument readiness through preventive maintenance and rapid repairs. Patient support programs improve adherence and access, while closed-loop feedback from clinicians and patients informs product iterations and targeted training content.
- Proctoring and simulation
- In-OR technical support
- Field service & maintenance
- Patient adherence programs
- Feedback-driven R&D & training
Translational R&D: Trials in 60+ countries; supply to 175+ countries
Translational R&D fuels a diversified pipeline; global Phase I–III trials ran in 60+ countries (2024) with biomarker-led adaptive designs.
QA/QC and GMP across 250+ manufacturing sites ensure supply to 175+ countries; 2024 regulatory teams managed submissions and inspections.
HTA dossiers used in 50+ countries (2024); outcomes-based deals and tenders (up to >20% price erosion) drive access strategies.
| Activity | 2024 metric |
|---|---|
| Trials | 60+ countries |
| Manufacturing sites | 250+ |
| Countries served | 175+ |
| HTA use | 50+ countries |
Full Document Unlocks After Purchase
Business Model Canvas
The document you're previewing is the actual Johnson & Johnson Business Model Canvas you'll receive—it's not a mockup. Upon purchase you'll get this exact, fully editable file with all sections intact, formatted for presentation and analysis. No placeholders, no surprises—what you see is what you own.
Original: $10.00
-65%$10.00
$3.50Description
Business Model Canvas for a diversified healthcare leader: pharma, medtech, consumer health
Unlock Johnson & Johnson’s strategic blueprint with a concise Business Model Canvas that maps its value propositions, key partners, and revenue engines across pharmaceuticals, medtech, and consumer health. Ideal for investors, consultants, and founders seeking actionable, company-specific insights—download the full Word/Excel canvas to benchmark and apply proven growth levers.
Partnerships
Academic and biotech R&D alliances
Collaborations with universities and biotech firms accelerate discovery and de-risk early science, with J&J leveraging co-development and option-to-license deals alongside incubators such as JLABS (launched 2012) that have supported over 1,000 startups globally. These alliances expand the pipeline—across oncology, immunology, neuroscience and cardiovascular—by adding novel modalities and platform technologies. J&J sustains multi-billion-dollar annual R&D investment to co-fund and scale external innovation.
Hospitals, surgeons, and clinical networks
Johnson & Johnson MedTech relies on surgical KOLs and integrated delivery networks for co-design, training and evidence generation, with >200 hospital partnerships supporting device iterations and surgeon proctoring. Clinical networks enable multi-center trials (dozens–100+ sites) and real-world data capture to drive regulatory and reimbursement claims. ERAS adoption and procedure standardization cut LOS by ~2 days and complications by 30–50%, accelerating device uptake.
Regulators and health technology assessment bodies
Early scientific advice from FDA (PDUFA target 10 months, 6 months for priority review) and EMA (centralised review target 210 days) helps J&J align trial design with regulatory expectations. Engagements with HTA bodies like NICE (QALY thresholds ~£20,000–30,000) and payer partners shape value dossiers and economic models. These partnerships accelerate approvals, optimize market access and coordinate post‑market commitments for label expansion and safety monitoring.
Manufacturing, component, and CDMO partners
Complex biologics and advanced devices demand resilient supply chains and specialized inputs; Johnson & Johnson leverages API suppliers, contract manufacturers and precision component makers across its global network, operating in more than 60 countries (2024). Dual-sourcing, binding quality agreements and GMP audits reduce disruption risk, while strategic CDMO capacity is scaled during launches and commercial scale-ups to meet demand.
- API suppliers
- CMOs/CDMOs
- Precision component makers
- Dual-sourcing & quality agreements
Distribution, specialty pharmacy, and GPO partnerships
Pharmaceuticals flow through specialty distributors and pharmacies to hospitals and clinics, with specialty drugs accounting for about 50% of US drug spend in 2023 (IQVIA); J&J leverages these channels for access and patient support. MedTech benefits from GPO contracts that cover roughly 70% of US hospital purchasing and regional distributors for last-mile delivery, streamlining tendering, inventory and cold-chain logistics to broaden reach across mature and emerging markets.
- Specialty distribution: channels to hospitals, clinics, patient hub support
- Specialty pharmacy: adherence, infusion, cold-chain handling
- GPOs: aggregated purchasing, price negotiation (~70% hospital coverage)
- Regional distributors: last-mile, inventory, tenders—expand market reach
De-risking early science: >1,000 startups, 60+ countries
J&J partners with universities, biotech and JLABS (>1,000 startups) to de-risk early science and expand pipelines, backed by multi-billion-dollar annual R&D. MedTech co-design with >200 hospital partners and surgical KOLs accelerates adoption. Global supply/CDMO and distributors span 60+ countries (2024); specialty drugs ~50% US drug spend (2023); GPOs ~70% hospital coverage.
| Partner | Role | Metric |
|---|---|---|
| JLABS/startups | Early innovation | >1,000 startups |
| Hospitals/KOLs | Co-design/trials | >200 partners |
| Supply/CDMO | Manufacture/scale | 60+ countries (2024) |
| Channels | Access | Specialty drugs 50% (2023); GPOs ~70% |
What is included in the product
Detailed Word Document
A comprehensive Business Model Canvas for Johnson & Johnson mapping customer segments, channels, value propositions, key resources, partners, activities, cost structure and revenue streams with strategic insights. Designed for presentations and investor discussions, it links competitive advantages and SWOT analysis to each BMC block for actionable decision-making.
Customizable Excel Spreadsheet
High-level view of Johnson & Johnson’s business model with editable cells to condense its complex healthcare, pharmaceutical, and consumer segments into a single-page strategic snapshot, saving hours of formatting and simplifying boardroom or team discussions.
Activities
Target discovery and clinical development
Rigorous translational research feeds a diversified pipeline leveraged by J&J’s 138-year legacy (founded 1886); global Phase I–III trials run across 60+ countries with embedded biomarker strategies. Adaptive designs and decentralized elements accelerate enrollment and real-world insights. Evidence packages are assembled to satisfy regulators, payers and clinicians.
Regulatory, quality, and compliance management
End-to-end QA/QC ensures safety across Johnson & Johnson medicines and devices, with integrated testing and batch release protocols. In 2024 regulatory teams managed submissions, inspections, and continuous vigilance reporting to regulators. ISO and GMP standards anchor manufacturing and post-market surveillance, and robust compliance programs lower recall and legal risk.
Advanced manufacturing and supply operations
Advanced manufacturing at Johnson & Johnson leverages bioreactors, aseptic fill-finish, and additive manufacturing across 250+ global manufacturing sites to support complex biologics and device portfolios in 175+ countries. Network planning optimizes cost, resilience and service levels through regional capacity balancing. Digital twins and serialization improve traceability and yield. Continuous improvement programs reduce COGS while preserving quality.
Market access, pricing, and health economics
Value dossiers and cost-effectiveness models underpin reimbursement decisions, with health technology assessment used in over 50 countries in 2024; outcomes-based agreements and risk-sharing contracts align incentives and are increasingly used to secure access. Tender bid management optimizes volume and margin in centralized markets, where price erosion can exceed 20% on single-source tenders. Real-world evidence supports renewals and line extensions by demonstrating effectiveness and safety post-launch.
Surgeon education and customer support
Surgeon proctoring, simulation labs and in-the-OR support enable safe adoption of J&J technologies by reinforcing skills and reducing procedural variability; field service teams sustain device uptime and instrument readiness through preventive maintenance and rapid repairs. Patient support programs improve adherence and access, while closed-loop feedback from clinicians and patients informs product iterations and targeted training content.
- Proctoring and simulation
- In-OR technical support
- Field service & maintenance
- Patient adherence programs
- Feedback-driven R&D & training
Translational R&D: Trials in 60+ countries; supply to 175+ countries
Translational R&D fuels a diversified pipeline; global Phase I–III trials ran in 60+ countries (2024) with biomarker-led adaptive designs.
QA/QC and GMP across 250+ manufacturing sites ensure supply to 175+ countries; 2024 regulatory teams managed submissions and inspections.
HTA dossiers used in 50+ countries (2024); outcomes-based deals and tenders (up to >20% price erosion) drive access strategies.
| Activity | 2024 metric |
|---|---|
| Trials | 60+ countries |
| Manufacturing sites | 250+ |
| Countries served | 175+ |
| HTA use | 50+ countries |
Full Document Unlocks After Purchase
Business Model Canvas
The document you're previewing is the actual Johnson & Johnson Business Model Canvas you'll receive—it's not a mockup. Upon purchase you'll get this exact, fully editable file with all sections intact, formatted for presentation and analysis. No placeholders, no surprises—what you see is what you own.











