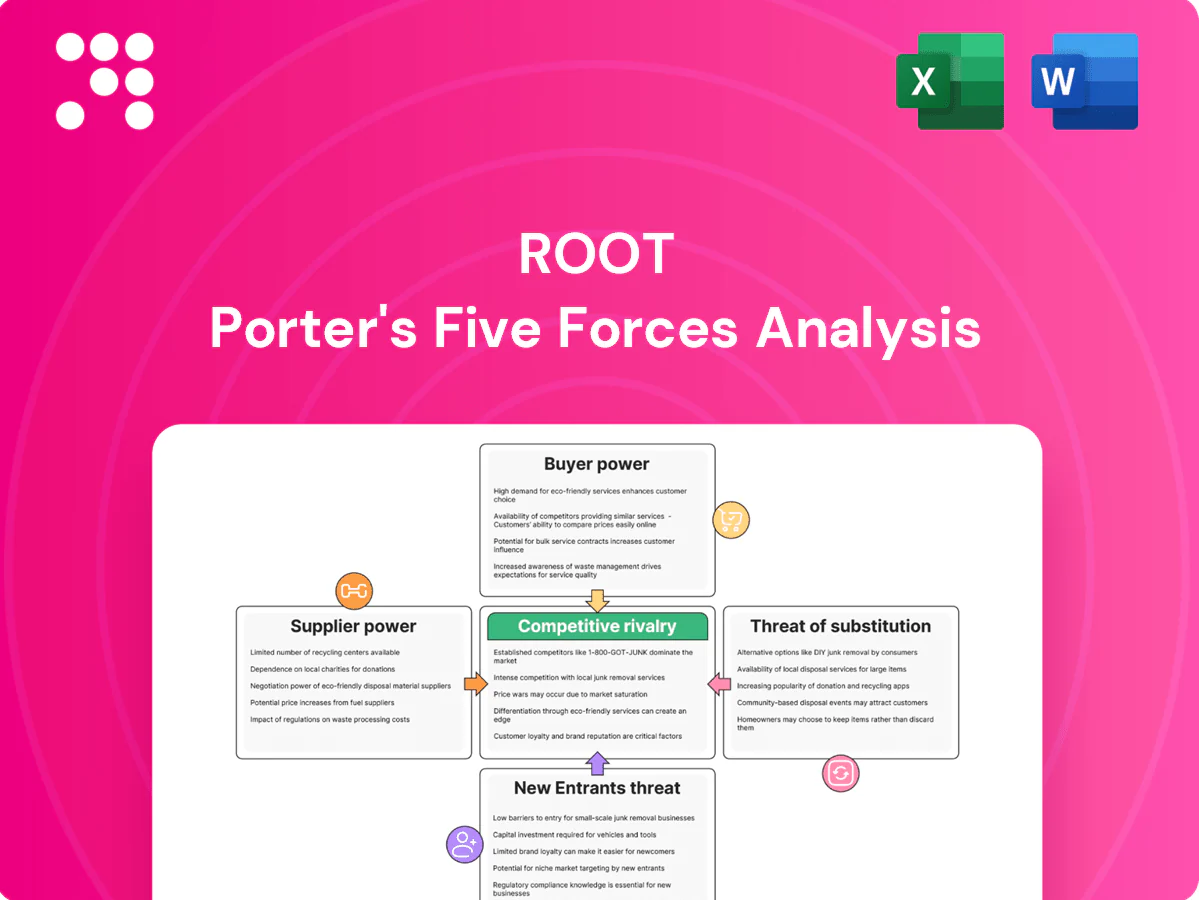
Root Porter's Five Forces Analysis

Go Beyond the Preview—Access the Full Strategic Report
Root's Porter's Five Forces snapshot highlights competitive intensity, buyer and supplier leverage, threat of substitutes, and entry barriers shaping its market position. This concise overview surfaces key pressures and strategic levers but only scratches the surface. Unlock the full Porter's Five Forces Analysis to explore force-by-force ratings, visuals, and actionable insights tailored to Root.
Suppliers Bargaining Power

Reinsurers and capital partners
Root depends on reinsurance to manage risk and scale premiums, giving reinsurers leverage over pricing and terms. A concentrated global reinsurance market (top five firms control roughly 55–60% of capacity) can tighten capacity in hard cycles, raising costs or retention. Strong long-term relationships and underwriting performance reduce this power, while diversifying panels and tapping alternative capital—the ILS market ~30bn in 2024—improves negotiating balance.
Cloud and data infrastructure
Cloud providers and data warehouses are mission-critical, with hyperscalers holding major share (2024: AWS ~32%, Microsoft Azure ~23%, Google Cloud ~12%), creating moderate switching costs and dependency. Migration risks and downtime—often costing firms hundreds of thousands per outage—give suppliers bargaining room. Committed-spend deals can cut unit costs up to ~60% but reduce flexibility. Hybrid and multi-cloud adoption (94% of enterprises in 2024) lowers lock-in.

Mobile OS and app stores
Apple and Google jointly control ~99.7% of global smartphone OS distribution (StatCounter 2024), with app-store commissions typically 15–30% and binding review/privacy rules; device-level APIs and permissions (e.g., background data, privacy prompts) can materially reduce telematics data yield. Policy or API shifts risk data quality and acquisition; building compliant SDKs and explicit consent flows preserves continuity and platform approval.

Third-party data providers
Third-party datasets—MVRs, credit, identity and claims—are core to underwriting and fraud control. US Big Three credit bureaus cover ~330 million consumers, concentrating supplier leverage. Contractual minimums and per-hit pricing squeeze unit economics. Proprietary signals and multi-vendor sourcing cut dependence.
- Vendor concentration: Big Three ~330M records
- Pricing pressure: contractual minimums raise fixed costs
- Mitigation: proprietary signals + multiple vendors
Claims and repair networks
Parts suppliers, repair shops, and adjuster networks materially affect claims cycle time and severity; in 2024 parts inflation (~9%) and labor shortages lengthened cycles and raised repair costs, increasing claim severity. Preferred networks and direct repair programs standardize pricing and quality, while digital claims workflows and negotiated rates helped contain costs and reduce cycle times (~12% faster where implemented).
- Parts inflation: 2024 ≈ 9%
- Cycle time reduction: digital claims ≈ 12%
- Preferred networks: standardize pricing/quality
- Tight labor markets: strengthen supplier bargaining
Reinsurance top5 55-60%, ILS $30bn; hyperscalers 32/23/12%
Reinsurance concentration (top 5 ≈55–60% capacity) and ILS ≈$30bn (2024) give reinsurers high leverage; diversified panels and strong loss history reduce it. Hyperscalers AWS 32%, Azure 23%, GCP 12% (2024) create moderate cloud dependency; multi/hybrid cloud (94% enterprises) lowers lock-in. Parts inflation ~9% (2024) and labor shortages raise claims costs; preferred networks and digital claims cut cycle ~12%.
| Supplier | 2024 metric |
|---|---|
| Reinsurance | Top5 55–60% / ILS $30bn |
| Cloud | AWS32%/Azure23%/GCP12% (94% multi-cloud) |
| Parts | Inflation ≈9% / digital cuts cycle ≈12% |
What is included in the product
 Detailed Word Document
Comprehensive Porter’s Five Forces analysis tailored for Root, uncovering competitive drivers, buyer and supplier power, threats from new entrants and substitutes, and strategic levers to protect market share; delivered in editable Word for use in investor materials, strategy decks, or academic projects.

 Customizable Excel Spreadsheet
Relieve the pain of slow, scattered competitive analysis with a compact Root Porter Five Forces one-sheet that visualizes pressure via an instant spider chart, lets you customize scores for any scenario, requires no macros, and is copy-ready for decks or dashboards.
Customers Bargaining Power

High price transparency
Consumers now compare quotes instantly via aggregators and carrier apps, substantially boosting bargaining power; in digital markets even 5–10% premium differences can trigger switching in commoditized segments. Root’s telematics pricing can attract price-sensitive safe drivers but must stay within that competitive band to retain them. Clear, quantified savings communication reduces friction and raises conversion.
Low switching costs
Auto insurance is non-contractual and typically renewed annually, so customers can switch at renewal with minimal penalty; industry retention in 2024 averaged about 85% (≈15% churn), and seamless digital onboarding further intensifies churn risk. Loyalty discounts and product bundling can raise perceived switching costs, while a superior claims experience substantially lowers customers’ incentive to leave.

Demand for seamless UX
Mobile-first buyers expect fast quotes, instant ID cards and efficient claims; Google found 53% of mobile visits are abandoned if pages take longer than 3 seconds. Poor app performance or lengthy onboarding drives churn, increasing customer bargaining power. Root’s digital claims and telematics insights can meet these demands. Continuous UX iteration is required to retain control and reduce attrition.

Sensitivity to claims handling
Customers prioritize fair, fast claim resolution over small premium differences after a loss; negative claims experiences rapidly drive complaints and policy shopping. Transparent communication and self-service status tracking measurably lower dissatisfaction and call volumes. Accurate telematics-based FNOL improves repair speed and fraud detection, boosting retention.
- Claims speed
- Transparency
- Self-service tracking
- Telematics FNOL
Segmented price elasticity
Riskier drivers and cash-constrained renters show high price elasticity, often switching plans for small discounts, boosting buyer power; McKinsey 2024 found personalized pricing can raise conversion roughly 15–20%, intensifying discount pressure. Safe drivers tolerate modest premium increases for superior service or perks, enabling upsell. Micro-segmentation lets carriers tailor offers to protect margins while improving conversion, but rate adequacy must be preserved to avoid loss-ratio deterioration.
Customers decisive: 85% retention, 53% mobile abandonment; personalized pricing +15-20% boost
Customers wield strong bargaining power: 2024 industry retention ≈85% (15% churn) and mobile abandonment 53% for >3s pages, making price and UX decisive. Telematics can retain safe drivers; McKinsey 2024 shows personalized pricing +15–20% conversion. Claims speed and transparency most reduce switching.
| Metric | 2024 Value |
|---|---|
| Retention | 85% |
| Churn | 15% |
| Mobile abandonment | 53% |
| Personalized pricing uplift | 15–20% |
Preview Before You Purchase
Root Porter's Five Forces Analysis
This Root Porter's Five Forces Analysis provides a comprehensive assessment of industry rivalry, buyer and supplier power, threat of entrants, and substitute pressures as they pertain to Root, with clear implications for strategy and valuation. This preview is the exact, fully formatted document you’ll receive instantly after purchase—no placeholders or samples. Downloadable and ready to use for decision-making, reporting, or presentation.

Go Beyond the Preview—Access the Full Strategic Report
Root's Porter's Five Forces snapshot highlights competitive intensity, buyer and supplier leverage, threat of substitutes, and entry barriers shaping its market position. This concise overview surfaces key pressures and strategic levers but only scratches the surface. Unlock the full Porter's Five Forces Analysis to explore force-by-force ratings, visuals, and actionable insights tailored to Root.
Suppliers Bargaining Power
Reinsurers and capital partners
Root depends on reinsurance to manage risk and scale premiums, giving reinsurers leverage over pricing and terms. A concentrated global reinsurance market (top five firms control roughly 55–60% of capacity) can tighten capacity in hard cycles, raising costs or retention. Strong long-term relationships and underwriting performance reduce this power, while diversifying panels and tapping alternative capital—the ILS market ~30bn in 2024—improves negotiating balance.
Cloud and data infrastructure
Cloud providers and data warehouses are mission-critical, with hyperscalers holding major share (2024: AWS ~32%, Microsoft Azure ~23%, Google Cloud ~12%), creating moderate switching costs and dependency. Migration risks and downtime—often costing firms hundreds of thousands per outage—give suppliers bargaining room. Committed-spend deals can cut unit costs up to ~60% but reduce flexibility. Hybrid and multi-cloud adoption (94% of enterprises in 2024) lowers lock-in.
Mobile OS and app stores
Apple and Google jointly control ~99.7% of global smartphone OS distribution (StatCounter 2024), with app-store commissions typically 15–30% and binding review/privacy rules; device-level APIs and permissions (e.g., background data, privacy prompts) can materially reduce telematics data yield. Policy or API shifts risk data quality and acquisition; building compliant SDKs and explicit consent flows preserves continuity and platform approval.
Third-party data providers
Third-party datasets—MVRs, credit, identity and claims—are core to underwriting and fraud control. US Big Three credit bureaus cover ~330 million consumers, concentrating supplier leverage. Contractual minimums and per-hit pricing squeeze unit economics. Proprietary signals and multi-vendor sourcing cut dependence.
- Vendor concentration: Big Three ~330M records
- Pricing pressure: contractual minimums raise fixed costs
- Mitigation: proprietary signals + multiple vendors
Claims and repair networks
Parts suppliers, repair shops, and adjuster networks materially affect claims cycle time and severity; in 2024 parts inflation (~9%) and labor shortages lengthened cycles and raised repair costs, increasing claim severity. Preferred networks and direct repair programs standardize pricing and quality, while digital claims workflows and negotiated rates helped contain costs and reduce cycle times (~12% faster where implemented).
- Parts inflation: 2024 ≈ 9%
- Cycle time reduction: digital claims ≈ 12%
- Preferred networks: standardize pricing/quality
- Tight labor markets: strengthen supplier bargaining
Reinsurance top5 55-60%, ILS $30bn; hyperscalers 32/23/12%
Reinsurance concentration (top 5 ≈55–60% capacity) and ILS ≈$30bn (2024) give reinsurers high leverage; diversified panels and strong loss history reduce it. Hyperscalers AWS 32%, Azure 23%, GCP 12% (2024) create moderate cloud dependency; multi/hybrid cloud (94% enterprises) lowers lock-in. Parts inflation ~9% (2024) and labor shortages raise claims costs; preferred networks and digital claims cut cycle ~12%.
| Supplier | 2024 metric |
|---|---|
| Reinsurance | Top5 55–60% / ILS $30bn |
| Cloud | AWS32%/Azure23%/GCP12% (94% multi-cloud) |
| Parts | Inflation ≈9% / digital cuts cycle ≈12% |
What is included in the product
Detailed Word Document
Comprehensive Porter’s Five Forces analysis tailored for Root, uncovering competitive drivers, buyer and supplier power, threats from new entrants and substitutes, and strategic levers to protect market share; delivered in editable Word for use in investor materials, strategy decks, or academic projects.
Customizable Excel Spreadsheet
Relieve the pain of slow, scattered competitive analysis with a compact Root Porter Five Forces one-sheet that visualizes pressure via an instant spider chart, lets you customize scores for any scenario, requires no macros, and is copy-ready for decks or dashboards.
Customers Bargaining Power
High price transparency
Consumers now compare quotes instantly via aggregators and carrier apps, substantially boosting bargaining power; in digital markets even 5–10% premium differences can trigger switching in commoditized segments. Root’s telematics pricing can attract price-sensitive safe drivers but must stay within that competitive band to retain them. Clear, quantified savings communication reduces friction and raises conversion.
Low switching costs
Auto insurance is non-contractual and typically renewed annually, so customers can switch at renewal with minimal penalty; industry retention in 2024 averaged about 85% (≈15% churn), and seamless digital onboarding further intensifies churn risk. Loyalty discounts and product bundling can raise perceived switching costs, while a superior claims experience substantially lowers customers’ incentive to leave.
Demand for seamless UX
Mobile-first buyers expect fast quotes, instant ID cards and efficient claims; Google found 53% of mobile visits are abandoned if pages take longer than 3 seconds. Poor app performance or lengthy onboarding drives churn, increasing customer bargaining power. Root’s digital claims and telematics insights can meet these demands. Continuous UX iteration is required to retain control and reduce attrition.
Sensitivity to claims handling
Customers prioritize fair, fast claim resolution over small premium differences after a loss; negative claims experiences rapidly drive complaints and policy shopping. Transparent communication and self-service status tracking measurably lower dissatisfaction and call volumes. Accurate telematics-based FNOL improves repair speed and fraud detection, boosting retention.
- Claims speed
- Transparency
- Self-service tracking
- Telematics FNOL
Segmented price elasticity
Riskier drivers and cash-constrained renters show high price elasticity, often switching plans for small discounts, boosting buyer power; McKinsey 2024 found personalized pricing can raise conversion roughly 15–20%, intensifying discount pressure. Safe drivers tolerate modest premium increases for superior service or perks, enabling upsell. Micro-segmentation lets carriers tailor offers to protect margins while improving conversion, but rate adequacy must be preserved to avoid loss-ratio deterioration.
Customers decisive: 85% retention, 53% mobile abandonment; personalized pricing +15-20% boost
Customers wield strong bargaining power: 2024 industry retention ≈85% (15% churn) and mobile abandonment 53% for >3s pages, making price and UX decisive. Telematics can retain safe drivers; McKinsey 2024 shows personalized pricing +15–20% conversion. Claims speed and transparency most reduce switching.
| Metric | 2024 Value |
|---|---|
| Retention | 85% |
| Churn | 15% |
| Mobile abandonment | 53% |
| Personalized pricing uplift | 15–20% |
Preview Before You Purchase
Root Porter's Five Forces Analysis
This Root Porter's Five Forces Analysis provides a comprehensive assessment of industry rivalry, buyer and supplier power, threat of entrants, and substitute pressures as they pertain to Root, with clear implications for strategy and valuation. This preview is the exact, fully formatted document you’ll receive instantly after purchase—no placeholders or samples. Downloadable and ready to use for decision-making, reporting, or presentation.
Description
Go Beyond the Preview—Access the Full Strategic Report
Root's Porter's Five Forces snapshot highlights competitive intensity, buyer and supplier leverage, threat of substitutes, and entry barriers shaping its market position. This concise overview surfaces key pressures and strategic levers but only scratches the surface. Unlock the full Porter's Five Forces Analysis to explore force-by-force ratings, visuals, and actionable insights tailored to Root.
Suppliers Bargaining Power
Reinsurers and capital partners
Root depends on reinsurance to manage risk and scale premiums, giving reinsurers leverage over pricing and terms. A concentrated global reinsurance market (top five firms control roughly 55–60% of capacity) can tighten capacity in hard cycles, raising costs or retention. Strong long-term relationships and underwriting performance reduce this power, while diversifying panels and tapping alternative capital—the ILS market ~30bn in 2024—improves negotiating balance.
Cloud and data infrastructure
Cloud providers and data warehouses are mission-critical, with hyperscalers holding major share (2024: AWS ~32%, Microsoft Azure ~23%, Google Cloud ~12%), creating moderate switching costs and dependency. Migration risks and downtime—often costing firms hundreds of thousands per outage—give suppliers bargaining room. Committed-spend deals can cut unit costs up to ~60% but reduce flexibility. Hybrid and multi-cloud adoption (94% of enterprises in 2024) lowers lock-in.
Mobile OS and app stores
Apple and Google jointly control ~99.7% of global smartphone OS distribution (StatCounter 2024), with app-store commissions typically 15–30% and binding review/privacy rules; device-level APIs and permissions (e.g., background data, privacy prompts) can materially reduce telematics data yield. Policy or API shifts risk data quality and acquisition; building compliant SDKs and explicit consent flows preserves continuity and platform approval.
Third-party data providers
Third-party datasets—MVRs, credit, identity and claims—are core to underwriting and fraud control. US Big Three credit bureaus cover ~330 million consumers, concentrating supplier leverage. Contractual minimums and per-hit pricing squeeze unit economics. Proprietary signals and multi-vendor sourcing cut dependence.
- Vendor concentration: Big Three ~330M records
- Pricing pressure: contractual minimums raise fixed costs
- Mitigation: proprietary signals + multiple vendors
Claims and repair networks
Parts suppliers, repair shops, and adjuster networks materially affect claims cycle time and severity; in 2024 parts inflation (~9%) and labor shortages lengthened cycles and raised repair costs, increasing claim severity. Preferred networks and direct repair programs standardize pricing and quality, while digital claims workflows and negotiated rates helped contain costs and reduce cycle times (~12% faster where implemented).
- Parts inflation: 2024 ≈ 9%
- Cycle time reduction: digital claims ≈ 12%
- Preferred networks: standardize pricing/quality
- Tight labor markets: strengthen supplier bargaining
Reinsurance top5 55-60%, ILS $30bn; hyperscalers 32/23/12%
Reinsurance concentration (top 5 ≈55–60% capacity) and ILS ≈$30bn (2024) give reinsurers high leverage; diversified panels and strong loss history reduce it. Hyperscalers AWS 32%, Azure 23%, GCP 12% (2024) create moderate cloud dependency; multi/hybrid cloud (94% enterprises) lowers lock-in. Parts inflation ~9% (2024) and labor shortages raise claims costs; preferred networks and digital claims cut cycle ~12%.
| Supplier | 2024 metric |
|---|---|
| Reinsurance | Top5 55–60% / ILS $30bn |
| Cloud | AWS32%/Azure23%/GCP12% (94% multi-cloud) |
| Parts | Inflation ≈9% / digital cuts cycle ≈12% |
What is included in the product
Detailed Word Document
Comprehensive Porter’s Five Forces analysis tailored for Root, uncovering competitive drivers, buyer and supplier power, threats from new entrants and substitutes, and strategic levers to protect market share; delivered in editable Word for use in investor materials, strategy decks, or academic projects.
Customizable Excel Spreadsheet
Relieve the pain of slow, scattered competitive analysis with a compact Root Porter Five Forces one-sheet that visualizes pressure via an instant spider chart, lets you customize scores for any scenario, requires no macros, and is copy-ready for decks or dashboards.
Customers Bargaining Power
High price transparency
Consumers now compare quotes instantly via aggregators and carrier apps, substantially boosting bargaining power; in digital markets even 5–10% premium differences can trigger switching in commoditized segments. Root’s telematics pricing can attract price-sensitive safe drivers but must stay within that competitive band to retain them. Clear, quantified savings communication reduces friction and raises conversion.
Low switching costs
Auto insurance is non-contractual and typically renewed annually, so customers can switch at renewal with minimal penalty; industry retention in 2024 averaged about 85% (≈15% churn), and seamless digital onboarding further intensifies churn risk. Loyalty discounts and product bundling can raise perceived switching costs, while a superior claims experience substantially lowers customers’ incentive to leave.
Demand for seamless UX
Mobile-first buyers expect fast quotes, instant ID cards and efficient claims; Google found 53% of mobile visits are abandoned if pages take longer than 3 seconds. Poor app performance or lengthy onboarding drives churn, increasing customer bargaining power. Root’s digital claims and telematics insights can meet these demands. Continuous UX iteration is required to retain control and reduce attrition.
Sensitivity to claims handling
Customers prioritize fair, fast claim resolution over small premium differences after a loss; negative claims experiences rapidly drive complaints and policy shopping. Transparent communication and self-service status tracking measurably lower dissatisfaction and call volumes. Accurate telematics-based FNOL improves repair speed and fraud detection, boosting retention.
- Claims speed
- Transparency
- Self-service tracking
- Telematics FNOL
Segmented price elasticity
Riskier drivers and cash-constrained renters show high price elasticity, often switching plans for small discounts, boosting buyer power; McKinsey 2024 found personalized pricing can raise conversion roughly 15–20%, intensifying discount pressure. Safe drivers tolerate modest premium increases for superior service or perks, enabling upsell. Micro-segmentation lets carriers tailor offers to protect margins while improving conversion, but rate adequacy must be preserved to avoid loss-ratio deterioration.
Customers decisive: 85% retention, 53% mobile abandonment; personalized pricing +15-20% boost
Customers wield strong bargaining power: 2024 industry retention ≈85% (15% churn) and mobile abandonment 53% for >3s pages, making price and UX decisive. Telematics can retain safe drivers; McKinsey 2024 shows personalized pricing +15–20% conversion. Claims speed and transparency most reduce switching.
| Metric | 2024 Value |
|---|---|
| Retention | 85% |
| Churn | 15% |
| Mobile abandonment | 53% |
| Personalized pricing uplift | 15–20% |
Preview Before You Purchase
Root Porter's Five Forces Analysis
This Root Porter's Five Forces Analysis provides a comprehensive assessment of industry rivalry, buyer and supplier power, threat of entrants, and substitute pressures as they pertain to Root, with clear implications for strategy and valuation. This preview is the exact, fully formatted document you’ll receive instantly after purchase—no placeholders or samples. Downloadable and ready to use for decision-making, reporting, or presentation.











