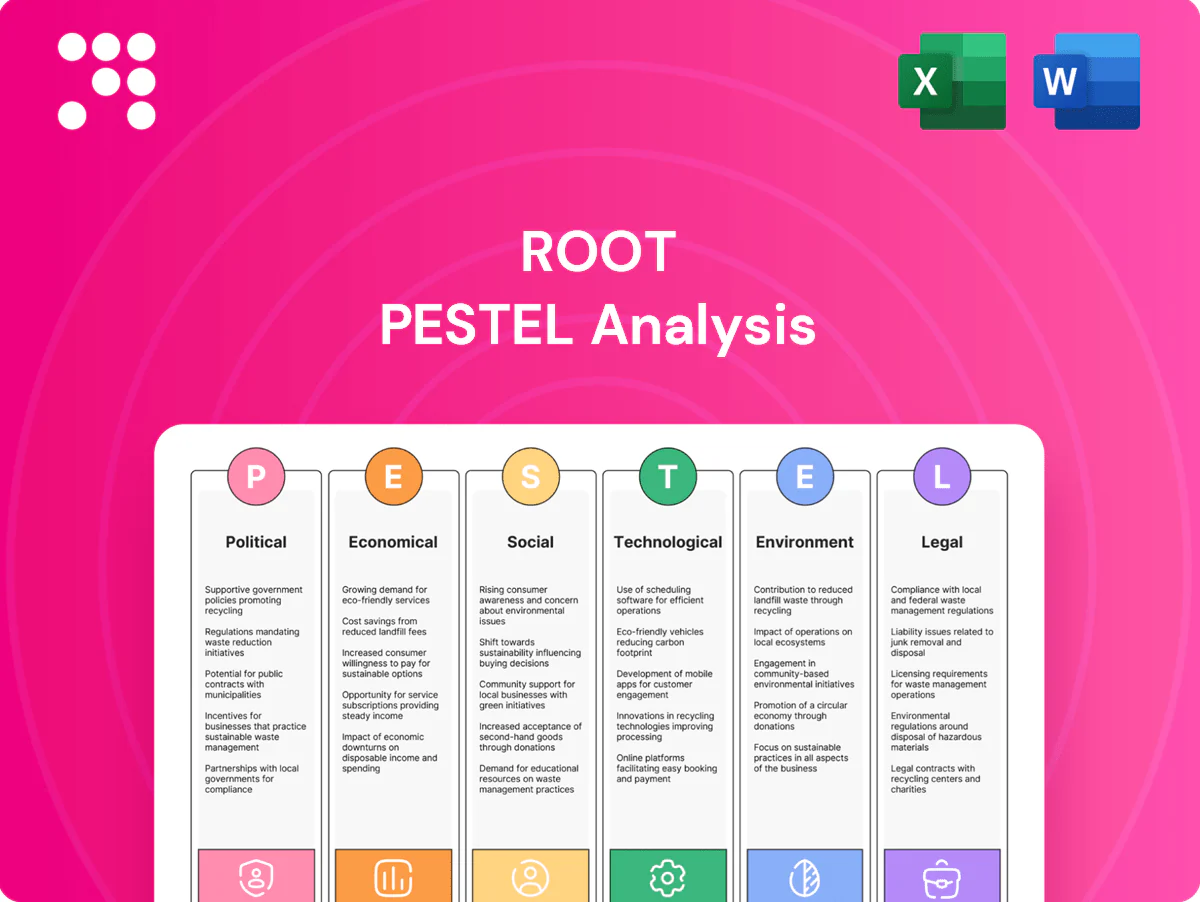
Root PESTLE Analysis

Your Shortcut to Market Insight Starts Here
Unlock strategic clarity with our Root PESTLE Analysis—three to five sentence insights into political, economic, social, technological, legal and environmental forces shaping the company’s future. Ideal for investors and strategists, this concise preview highlights key risks and growth levers. Purchase the full PESTLE to get the complete, editable report and actionable recommendations instantly.
Political factors

State-by-state insurance regulation variability
Root must secure approvals from 50 state DOIs for products, pricing and telematics rating factors, with UBI penetration reaching roughly 12% of new U.S. auto policies by 2024. Political turnover can swiftly reprioritize DOI agendas, delaying rate filings; state approval lags often span months and slow time-to-market. Coordination with NAIC models—referenced by about 30 states in 2024—adds compliance complexity and legal costs, and adverse rulings directly compress growth and worsen unit economics.
Government attitudes toward telematics and road safety
Policymakers encouraging safer driving and Vision Zero initiatives can favor telematics-based pricing, given WHO estimates ~1.3 million road deaths annually. Incentives for distracted-driving reduction (US NHTSA recorded 3,522 deaths in 2021) and teen programs (GDL cuts crash risk 20–40%) align with Root’s behavior-centric model. Conversely, surveillance backlash could spur restrictive rules, while public partnerships boost legitimacy and data-sharing.

Digital infrastructure and broadband policy
Public investment such as the US BEAD program's $42.45 billion boosts 5G and rural broadband, expanding reliable app usage and data capture. Coverage gaps still leave about 14.5 million Americans without fixed broadband, hindering continuous telematics and customer experience. Political commitments to nationwide connectivity reduce friction for mobile-first insurers, while any rollback or underfunding could slow adoption in underserved markets.

Transportation and urban policy shifts
Policies that affect vehicle miles traveled, from congestion pricing pilots (NYC/CA moves in 2024) to micromobility permits, shift exposure patterns; US VMT was about 3.3 trillion miles in 2023 while remote-work rates near 20% in 2024, reducing commute miles and premium volumes. Infrastructure funding (US Bipartisan Infrastructure Law ~110B for roads/bridges) and safer-road projects can lower loss frequency over time, so Root must adapt pricing, underwriting and marketing to evolving mobility regimes.
- VMT: ~3.3T miles (2023)
- Remote work: ~20% (2024)
- Infrastructure: ~$110B roads/bridges
- Action: adjust pricing, telemetry, distribution
Trade, supply chain, and automotive industrial policy
Tariffs and EV/semiconductor policies materially affect vehicle pricing and repair costs: the CHIPS Act provides about 52 billion USD for domestic chips and the US Inflation Reduction Act allocates roughly 369 billion USD for clean energy, both reshaping component costs and supply resilience; semiconductor shortages cut auto production by an estimated 7.7 million vehicles in 2021, raising parts scarcity and severity.
- Tariffs raise imported parts costs, increasing claim severity
- Domestic incentives (CHIPS/IRA) improve parts availability and shorten claim timelines
- EV adoption (14% of new car sales in 2023 per IEA) shifts vehicle mix and repair cost structure affecting Root pricing
Insurer faces 50-state DOI approvals, UBI ~12% and EV-driven cost shifts
Root faces multi-state DOI approvals (50 states) and NAIC model alignment (~30 states), with UBI ~12% of new U.S. auto policies (2024) slowing filings and time-to-market. Federal programs (BEAD $42.45B, CHIPS $52B, IRA ~$369B) and infrastructure funding (~$110B) change connectivity, parts supply and repair severity. VMT ~3.3T miles (2023) and remote work ~20% (2024) shift exposure; EVs 14% of new sales (2023) alter cost mix.
| Metric | Value |
|---|---|
| State DOIs | 50 |
| UBI penetration (2024) | ~12% |
| NAIC reference | ~30 states |
| BEAD | $42.45B |
| CHIPS | $52B |
| IRA (clean energy) | ~$369B |
| VMT (2023) | ~3.3T miles |
| Remote work (2024) | ~20% |
| EV share (2023) | ~14% |
What is included in the product
 Detailed Word Document
Explores how macro-environmental factors uniquely affect the Root across Political, Economic, Social, Technological, Environmental and Legal dimensions, with data-backed trends and forward-looking insights to help executives, consultants and entrepreneurs identify threats, opportunities and strategy-ready recommendations for planning, funding and competitive positioning.

 Customizable Excel Spreadsheet
A concise, visually segmented Root PESTLE summary that's editable and shareable, enabling quick alignment across teams, easy insertion into presentations, and faster discussion of external risks and market positioning during planning sessions.
Economic factors

Inflation and repair cost escalation
Parts and labor inflation — parts and labor costs rose about 8% year-over-year in 2024, while the Manheim used-vehicle index showed roughly a 6% increase in wholesale used-car prices, increasing claim severity and average payouts. Longer repair cycle times have pushed rental and loss-adjustment costs up (rental rates climbed ~12% in 2023–24), pressuring combined ratios unless premiums reset quickly. Root’s data-driven pricing must track these real-time cost trends to preserve margins.
Interest rates and investment income
Higher yields—with the fed funds rate near 5.25–5.50% and the US 10‑year around 4.3%—boost investment income on float, partially offsetting underwriting losses. Rapid rate shifts compress or expand discount rates and force reallocations between bonds and equities, affecting capital costs. Prolonged lower‑rate periods compress total returns and heighten reliance on underwriting discipline. Precise asset‑liability matching remains critical for balance‑sheet stability.

Employment, VMT, and macro cycles
Rising employment and economic growth lift VMT and exposure—US VMT recovered to about 3.28 trillion miles in 2023 (FHWA), correlating with higher accident frequency and claim severity. Economic downturns can cut VMT sharply (2020 fell ~13% vs 2019) while raising fraud and lapse risk as policyholders churn. National pump price averaged near $3.50/gal in 2024 (EIA), shifting vehicle mix and risk. Root must rebalance acquisition and pricing to match cyclical demand.

Reinsurance costs and catastrophe trends
Rising reinsurance rates after active CAT seasons elevate Root’s cost of risk transfer, with global insured catastrophe losses at about US$120bn in 2023 per Swiss Re, driving double-digit reinsurance rate increases in many 2024 renewals. Hail, flood and convective storms have heightened severity volatility in auto, forcing optimization of retentions and geographic mix as an economic imperative. Root’s capital efficiency is tightly linked to reinsurance market conditions and pricing.
- Reinsurance pricing: double-digit increases in 2024 renewals
- Cat loss benchmark: ~US$120bn insured losses in 2023
- Auto severity drivers: hail, flood, convective storms
- Strategic focus: higher retentions, geographic mix optimization
Competitive pricing pressure in insurtech and incumbents
Legacy carriers can cross-subsidize and withstand price cycles, keeping pressure on insurtech margins; US auto industry combined ratio was about 103% in 2023 (NAIC), underscoring frequency/severity headwinds.
Customer acquisition costs track digital ad markets and remain volatile; profitability requires precise segmentation and retention, not just top-line growth.
Root’s telematics edge must convert to measurable loss-ratio improvement to sustain margins.
- Cross-subsidize: incumbents
- CAC volatility: digital ads
- Profit drivers: segmentation & retention
- Telematics → loss-ratio
Insurer faces 50-state DOI approvals, UBI ~12% and EV-driven cost shifts
Parts/labor inflation (~8% YoY 2024) and Manheim used-car +6% raised claim severity and rental costs (~+12% 2023–24), pressuring combined ratios. Higher yields (fed funds 5.25–5.50%, US 10yr ~4.3%) boost float but require asset‑liability matching. VMT ~3.28T miles (2023) lifts frequency; reinsurance stress (insured losses ~$120bn 2023) drove double-digit 2024 rate increases.
| Metric | Value/Year |
|---|---|
| Parts & labor inflation | ~8% YoY, 2024 |
| Manheim used-car | +6% YoY, 2024 |
| Rental rates | ~+12%, 2023–24 |
| Fed funds / 10yr | 5.25–5.50% / ~4.3% |
| VMT (US) | 3.28T miles, 2023 |
| Insured CAT losses | ~$120bn, 2023 |
| Reinsurance pricing | Double-digit increases, 2024 |
Same Document Delivered
Root PESTLE Analysis
The preview shown here is the exact Root PESTLE Analysis document you’ll receive after purchase—fully formatted and ready to use. This is the real, finished file with complete content, structure, and visuals. After checkout you’ll download this identical, professionally prepared report.

Your Shortcut to Market Insight Starts Here
Unlock strategic clarity with our Root PESTLE Analysis—three to five sentence insights into political, economic, social, technological, legal and environmental forces shaping the company’s future. Ideal for investors and strategists, this concise preview highlights key risks and growth levers. Purchase the full PESTLE to get the complete, editable report and actionable recommendations instantly.
Political factors
State-by-state insurance regulation variability
Root must secure approvals from 50 state DOIs for products, pricing and telematics rating factors, with UBI penetration reaching roughly 12% of new U.S. auto policies by 2024. Political turnover can swiftly reprioritize DOI agendas, delaying rate filings; state approval lags often span months and slow time-to-market. Coordination with NAIC models—referenced by about 30 states in 2024—adds compliance complexity and legal costs, and adverse rulings directly compress growth and worsen unit economics.
Government attitudes toward telematics and road safety
Policymakers encouraging safer driving and Vision Zero initiatives can favor telematics-based pricing, given WHO estimates ~1.3 million road deaths annually. Incentives for distracted-driving reduction (US NHTSA recorded 3,522 deaths in 2021) and teen programs (GDL cuts crash risk 20–40%) align with Root’s behavior-centric model. Conversely, surveillance backlash could spur restrictive rules, while public partnerships boost legitimacy and data-sharing.
Digital infrastructure and broadband policy
Public investment such as the US BEAD program's $42.45 billion boosts 5G and rural broadband, expanding reliable app usage and data capture. Coverage gaps still leave about 14.5 million Americans without fixed broadband, hindering continuous telematics and customer experience. Political commitments to nationwide connectivity reduce friction for mobile-first insurers, while any rollback or underfunding could slow adoption in underserved markets.
Transportation and urban policy shifts
Policies that affect vehicle miles traveled, from congestion pricing pilots (NYC/CA moves in 2024) to micromobility permits, shift exposure patterns; US VMT was about 3.3 trillion miles in 2023 while remote-work rates near 20% in 2024, reducing commute miles and premium volumes. Infrastructure funding (US Bipartisan Infrastructure Law ~110B for roads/bridges) and safer-road projects can lower loss frequency over time, so Root must adapt pricing, underwriting and marketing to evolving mobility regimes.
- VMT: ~3.3T miles (2023)
- Remote work: ~20% (2024)
- Infrastructure: ~$110B roads/bridges
- Action: adjust pricing, telemetry, distribution
Trade, supply chain, and automotive industrial policy
Tariffs and EV/semiconductor policies materially affect vehicle pricing and repair costs: the CHIPS Act provides about 52 billion USD for domestic chips and the US Inflation Reduction Act allocates roughly 369 billion USD for clean energy, both reshaping component costs and supply resilience; semiconductor shortages cut auto production by an estimated 7.7 million vehicles in 2021, raising parts scarcity and severity.
- Tariffs raise imported parts costs, increasing claim severity
- Domestic incentives (CHIPS/IRA) improve parts availability and shorten claim timelines
- EV adoption (14% of new car sales in 2023 per IEA) shifts vehicle mix and repair cost structure affecting Root pricing
Insurer faces 50-state DOI approvals, UBI ~12% and EV-driven cost shifts
Root faces multi-state DOI approvals (50 states) and NAIC model alignment (~30 states), with UBI ~12% of new U.S. auto policies (2024) slowing filings and time-to-market. Federal programs (BEAD $42.45B, CHIPS $52B, IRA ~$369B) and infrastructure funding (~$110B) change connectivity, parts supply and repair severity. VMT ~3.3T miles (2023) and remote work ~20% (2024) shift exposure; EVs 14% of new sales (2023) alter cost mix.
| Metric | Value |
|---|---|
| State DOIs | 50 |
| UBI penetration (2024) | ~12% |
| NAIC reference | ~30 states |
| BEAD | $42.45B |
| CHIPS | $52B |
| IRA (clean energy) | ~$369B |
| VMT (2023) | ~3.3T miles |
| Remote work (2024) | ~20% |
| EV share (2023) | ~14% |
What is included in the product
Detailed Word Document
Explores how macro-environmental factors uniquely affect the Root across Political, Economic, Social, Technological, Environmental and Legal dimensions, with data-backed trends and forward-looking insights to help executives, consultants and entrepreneurs identify threats, opportunities and strategy-ready recommendations for planning, funding and competitive positioning.
Customizable Excel Spreadsheet
A concise, visually segmented Root PESTLE summary that's editable and shareable, enabling quick alignment across teams, easy insertion into presentations, and faster discussion of external risks and market positioning during planning sessions.
Economic factors
Inflation and repair cost escalation
Parts and labor inflation — parts and labor costs rose about 8% year-over-year in 2024, while the Manheim used-vehicle index showed roughly a 6% increase in wholesale used-car prices, increasing claim severity and average payouts. Longer repair cycle times have pushed rental and loss-adjustment costs up (rental rates climbed ~12% in 2023–24), pressuring combined ratios unless premiums reset quickly. Root’s data-driven pricing must track these real-time cost trends to preserve margins.
Interest rates and investment income
Higher yields—with the fed funds rate near 5.25–5.50% and the US 10‑year around 4.3%—boost investment income on float, partially offsetting underwriting losses. Rapid rate shifts compress or expand discount rates and force reallocations between bonds and equities, affecting capital costs. Prolonged lower‑rate periods compress total returns and heighten reliance on underwriting discipline. Precise asset‑liability matching remains critical for balance‑sheet stability.
Employment, VMT, and macro cycles
Rising employment and economic growth lift VMT and exposure—US VMT recovered to about 3.28 trillion miles in 2023 (FHWA), correlating with higher accident frequency and claim severity. Economic downturns can cut VMT sharply (2020 fell ~13% vs 2019) while raising fraud and lapse risk as policyholders churn. National pump price averaged near $3.50/gal in 2024 (EIA), shifting vehicle mix and risk. Root must rebalance acquisition and pricing to match cyclical demand.
Reinsurance costs and catastrophe trends
Rising reinsurance rates after active CAT seasons elevate Root’s cost of risk transfer, with global insured catastrophe losses at about US$120bn in 2023 per Swiss Re, driving double-digit reinsurance rate increases in many 2024 renewals. Hail, flood and convective storms have heightened severity volatility in auto, forcing optimization of retentions and geographic mix as an economic imperative. Root’s capital efficiency is tightly linked to reinsurance market conditions and pricing.
- Reinsurance pricing: double-digit increases in 2024 renewals
- Cat loss benchmark: ~US$120bn insured losses in 2023
- Auto severity drivers: hail, flood, convective storms
- Strategic focus: higher retentions, geographic mix optimization
Competitive pricing pressure in insurtech and incumbents
Legacy carriers can cross-subsidize and withstand price cycles, keeping pressure on insurtech margins; US auto industry combined ratio was about 103% in 2023 (NAIC), underscoring frequency/severity headwinds.
Customer acquisition costs track digital ad markets and remain volatile; profitability requires precise segmentation and retention, not just top-line growth.
Root’s telematics edge must convert to measurable loss-ratio improvement to sustain margins.
- Cross-subsidize: incumbents
- CAC volatility: digital ads
- Profit drivers: segmentation & retention
- Telematics → loss-ratio
Insurer faces 50-state DOI approvals, UBI ~12% and EV-driven cost shifts
Parts/labor inflation (~8% YoY 2024) and Manheim used-car +6% raised claim severity and rental costs (~+12% 2023–24), pressuring combined ratios. Higher yields (fed funds 5.25–5.50%, US 10yr ~4.3%) boost float but require asset‑liability matching. VMT ~3.28T miles (2023) lifts frequency; reinsurance stress (insured losses ~$120bn 2023) drove double-digit 2024 rate increases.
| Metric | Value/Year |
|---|---|
| Parts & labor inflation | ~8% YoY, 2024 |
| Manheim used-car | +6% YoY, 2024 |
| Rental rates | ~+12%, 2023–24 |
| Fed funds / 10yr | 5.25–5.50% / ~4.3% |
| VMT (US) | 3.28T miles, 2023 |
| Insured CAT losses | ~$120bn, 2023 |
| Reinsurance pricing | Double-digit increases, 2024 |
Same Document Delivered
Root PESTLE Analysis
The preview shown here is the exact Root PESTLE Analysis document you’ll receive after purchase—fully formatted and ready to use. This is the real, finished file with complete content, structure, and visuals. After checkout you’ll download this identical, professionally prepared report.
Original: $10.00
-65%$10.00
$3.50Description
Your Shortcut to Market Insight Starts Here
Unlock strategic clarity with our Root PESTLE Analysis—three to five sentence insights into political, economic, social, technological, legal and environmental forces shaping the company’s future. Ideal for investors and strategists, this concise preview highlights key risks and growth levers. Purchase the full PESTLE to get the complete, editable report and actionable recommendations instantly.
Political factors
State-by-state insurance regulation variability
Root must secure approvals from 50 state DOIs for products, pricing and telematics rating factors, with UBI penetration reaching roughly 12% of new U.S. auto policies by 2024. Political turnover can swiftly reprioritize DOI agendas, delaying rate filings; state approval lags often span months and slow time-to-market. Coordination with NAIC models—referenced by about 30 states in 2024—adds compliance complexity and legal costs, and adverse rulings directly compress growth and worsen unit economics.
Government attitudes toward telematics and road safety
Policymakers encouraging safer driving and Vision Zero initiatives can favor telematics-based pricing, given WHO estimates ~1.3 million road deaths annually. Incentives for distracted-driving reduction (US NHTSA recorded 3,522 deaths in 2021) and teen programs (GDL cuts crash risk 20–40%) align with Root’s behavior-centric model. Conversely, surveillance backlash could spur restrictive rules, while public partnerships boost legitimacy and data-sharing.
Digital infrastructure and broadband policy
Public investment such as the US BEAD program's $42.45 billion boosts 5G and rural broadband, expanding reliable app usage and data capture. Coverage gaps still leave about 14.5 million Americans without fixed broadband, hindering continuous telematics and customer experience. Political commitments to nationwide connectivity reduce friction for mobile-first insurers, while any rollback or underfunding could slow adoption in underserved markets.
Transportation and urban policy shifts
Policies that affect vehicle miles traveled, from congestion pricing pilots (NYC/CA moves in 2024) to micromobility permits, shift exposure patterns; US VMT was about 3.3 trillion miles in 2023 while remote-work rates near 20% in 2024, reducing commute miles and premium volumes. Infrastructure funding (US Bipartisan Infrastructure Law ~110B for roads/bridges) and safer-road projects can lower loss frequency over time, so Root must adapt pricing, underwriting and marketing to evolving mobility regimes.
- VMT: ~3.3T miles (2023)
- Remote work: ~20% (2024)
- Infrastructure: ~$110B roads/bridges
- Action: adjust pricing, telemetry, distribution
Trade, supply chain, and automotive industrial policy
Tariffs and EV/semiconductor policies materially affect vehicle pricing and repair costs: the CHIPS Act provides about 52 billion USD for domestic chips and the US Inflation Reduction Act allocates roughly 369 billion USD for clean energy, both reshaping component costs and supply resilience; semiconductor shortages cut auto production by an estimated 7.7 million vehicles in 2021, raising parts scarcity and severity.
- Tariffs raise imported parts costs, increasing claim severity
- Domestic incentives (CHIPS/IRA) improve parts availability and shorten claim timelines
- EV adoption (14% of new car sales in 2023 per IEA) shifts vehicle mix and repair cost structure affecting Root pricing
Insurer faces 50-state DOI approvals, UBI ~12% and EV-driven cost shifts
Root faces multi-state DOI approvals (50 states) and NAIC model alignment (~30 states), with UBI ~12% of new U.S. auto policies (2024) slowing filings and time-to-market. Federal programs (BEAD $42.45B, CHIPS $52B, IRA ~$369B) and infrastructure funding (~$110B) change connectivity, parts supply and repair severity. VMT ~3.3T miles (2023) and remote work ~20% (2024) shift exposure; EVs 14% of new sales (2023) alter cost mix.
| Metric | Value |
|---|---|
| State DOIs | 50 |
| UBI penetration (2024) | ~12% |
| NAIC reference | ~30 states |
| BEAD | $42.45B |
| CHIPS | $52B |
| IRA (clean energy) | ~$369B |
| VMT (2023) | ~3.3T miles |
| Remote work (2024) | ~20% |
| EV share (2023) | ~14% |
What is included in the product
Detailed Word Document
Explores how macro-environmental factors uniquely affect the Root across Political, Economic, Social, Technological, Environmental and Legal dimensions, with data-backed trends and forward-looking insights to help executives, consultants and entrepreneurs identify threats, opportunities and strategy-ready recommendations for planning, funding and competitive positioning.
Customizable Excel Spreadsheet
A concise, visually segmented Root PESTLE summary that's editable and shareable, enabling quick alignment across teams, easy insertion into presentations, and faster discussion of external risks and market positioning during planning sessions.
Economic factors
Inflation and repair cost escalation
Parts and labor inflation — parts and labor costs rose about 8% year-over-year in 2024, while the Manheim used-vehicle index showed roughly a 6% increase in wholesale used-car prices, increasing claim severity and average payouts. Longer repair cycle times have pushed rental and loss-adjustment costs up (rental rates climbed ~12% in 2023–24), pressuring combined ratios unless premiums reset quickly. Root’s data-driven pricing must track these real-time cost trends to preserve margins.
Interest rates and investment income
Higher yields—with the fed funds rate near 5.25–5.50% and the US 10‑year around 4.3%—boost investment income on float, partially offsetting underwriting losses. Rapid rate shifts compress or expand discount rates and force reallocations between bonds and equities, affecting capital costs. Prolonged lower‑rate periods compress total returns and heighten reliance on underwriting discipline. Precise asset‑liability matching remains critical for balance‑sheet stability.
Employment, VMT, and macro cycles
Rising employment and economic growth lift VMT and exposure—US VMT recovered to about 3.28 trillion miles in 2023 (FHWA), correlating with higher accident frequency and claim severity. Economic downturns can cut VMT sharply (2020 fell ~13% vs 2019) while raising fraud and lapse risk as policyholders churn. National pump price averaged near $3.50/gal in 2024 (EIA), shifting vehicle mix and risk. Root must rebalance acquisition and pricing to match cyclical demand.
Reinsurance costs and catastrophe trends
Rising reinsurance rates after active CAT seasons elevate Root’s cost of risk transfer, with global insured catastrophe losses at about US$120bn in 2023 per Swiss Re, driving double-digit reinsurance rate increases in many 2024 renewals. Hail, flood and convective storms have heightened severity volatility in auto, forcing optimization of retentions and geographic mix as an economic imperative. Root’s capital efficiency is tightly linked to reinsurance market conditions and pricing.
- Reinsurance pricing: double-digit increases in 2024 renewals
- Cat loss benchmark: ~US$120bn insured losses in 2023
- Auto severity drivers: hail, flood, convective storms
- Strategic focus: higher retentions, geographic mix optimization
Competitive pricing pressure in insurtech and incumbents
Legacy carriers can cross-subsidize and withstand price cycles, keeping pressure on insurtech margins; US auto industry combined ratio was about 103% in 2023 (NAIC), underscoring frequency/severity headwinds.
Customer acquisition costs track digital ad markets and remain volatile; profitability requires precise segmentation and retention, not just top-line growth.
Root’s telematics edge must convert to measurable loss-ratio improvement to sustain margins.
- Cross-subsidize: incumbents
- CAC volatility: digital ads
- Profit drivers: segmentation & retention
- Telematics → loss-ratio
Insurer faces 50-state DOI approvals, UBI ~12% and EV-driven cost shifts
Parts/labor inflation (~8% YoY 2024) and Manheim used-car +6% raised claim severity and rental costs (~+12% 2023–24), pressuring combined ratios. Higher yields (fed funds 5.25–5.50%, US 10yr ~4.3%) boost float but require asset‑liability matching. VMT ~3.28T miles (2023) lifts frequency; reinsurance stress (insured losses ~$120bn 2023) drove double-digit 2024 rate increases.
| Metric | Value/Year |
|---|---|
| Parts & labor inflation | ~8% YoY, 2024 |
| Manheim used-car | +6% YoY, 2024 |
| Rental rates | ~+12%, 2023–24 |
| Fed funds / 10yr | 5.25–5.50% / ~4.3% |
| VMT (US) | 3.28T miles, 2023 |
| Insured CAT losses | ~$120bn, 2023 |
| Reinsurance pricing | Double-digit increases, 2024 |
Same Document Delivered
Root PESTLE Analysis
The preview shown here is the exact Root PESTLE Analysis document you’ll receive after purchase—fully formatted and ready to use. This is the real, finished file with complete content, structure, and visuals. After checkout you’ll download this identical, professionally prepared report.











