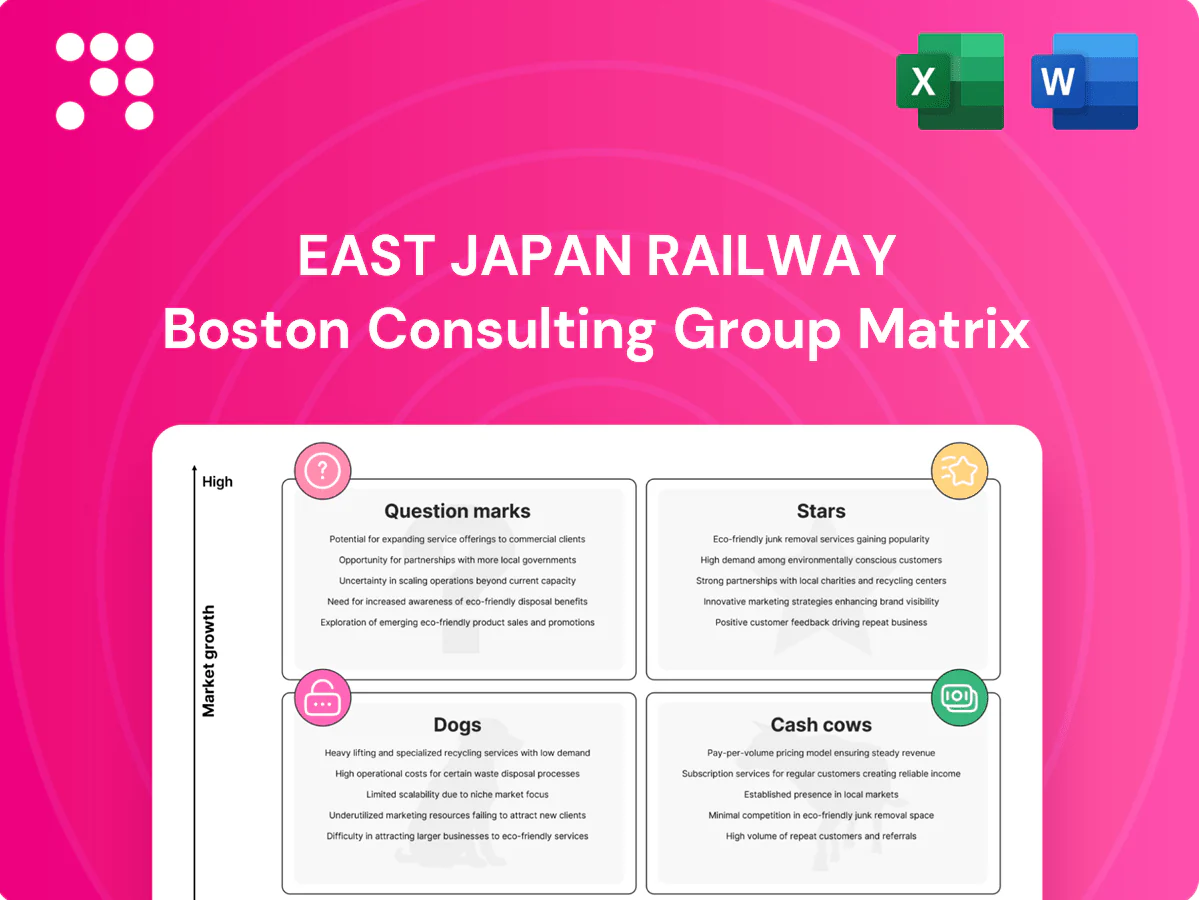
East Japan Railway Boston Consulting Group Matrix

Actionable Strategy Starts Here
Curious how East Japan Railway’s services and units stack up as Stars, Cash Cows, Dogs, or Question Marks? This preview highlights key trends—ridership hotspots, capital-intensive lines, and emerging segments—but the full BCG Matrix gives you quadrant-by-quadrant placement and strategic moves. Purchase the complete report for data-backed recommendations, a Word narrative, and an Excel summary you can use in presentations. Get instant access and start making smarter allocation and investment decisions today.
Stars

Tohoku & Joetsu Shinkansen corridors
Tohoku and Joetsu Shinkansen are JR East flagship high-speed corridors (E5 series up to 320 km/h) with dominant modal share and resurgent demand from business and inbound travel (Japan saw about 32 million visitors in 2023). They cannibalize air and express-bus traffic and set JR East’s brand tempo. Heavy capex and promotions remain needed to raise frequency, comfort and yield; defend share now to mature into major cash engines.
Mobile Suica and IC payment ecosystem
Mobile Suica and the IC payment ecosystem are near-ubiquitous across JR East’s territory, with Suica circulation reported at over 70 million cards and growing mobile adoption and open-loop partnerships in 2024. Network effects strengthen as merchants inside and outside stations expand acceptance, raising daily transaction volumes and merchant utility. High usage drives significant float and data monetization potential, but requires ongoing tech investment and security spend. Invest to cement leadership while digital wallets consolidate.

Inbound tourism passes and experiences
JR East inbound rail passes, curated routes and station-led tourism are riding Japan’s visitor boom—JNTO reported 31.88 million international arrivals in 2023. The group controls key corridors and touchpoints across its ~7,500 km network to package door-to-door journeys. Marketing and service upgrades still soak cash—guides, multilingual UX, baggage logistics and station retail. Hold share now and the flywheel spins faster.

Major station redevelopment megaprojects
Major station redevelopment megaprojects at Tokyo, Shinjuku and Sendai convert scale hubs into multi-use cities—offices, retail and hospitality—leveraging captive footfall (Shinjuku ~3.5m daily, Tokyo ~420k, Sendai ~120k) as modernized spaces lift visit duration and spend. Upfront capex is heavy, but 2024 leasing momentum and rising asset values push these sites into the network’s premium tier; maintaining leasing velocity is critical.
- Hubs: multi-use city model
- Footfall: captive and rising
- Risk/return: high capex, strong leasing & value upside
MaaS and integrated mobility apps
MaaS and integrated mobility apps aim to own the daily journey—ticketing, routing, payments and services—leveraging JR East’s pre‑COVID ~17 million daily riders and Suica transaction data to personalize travel. Features and data depth are growing but remain subscale vs super‑apps, so sustained marketing and product spend is required. Winning the daily habit would lock lifetime value across transit, retail and real estate.
- Scale: pre‑COVID ~17 million daily riders
- Strength: deep Suica/transaction data for personalization
- Weakness: subscale vs super‑apps, needs marketing/product fuel
- Opportunity: capture lifetime value across businesses
Scale transit cards, high-speed rail, tourism and stations to lock long-term cash engines
JR East stars—Shinkansen, Suica/MaaS, inbound tourism and station redevelopments—combine high market share and above‑market growth but require heavy capex to secure long‑term cash engines. 2024 metrics: Suica circulation >70M, pre‑COVID daily riders ~17M (recovery underway), 2023 inbound 31.88M; flagship hubs show strong leasing momentum. Defend share, scale monetization.
| Business | 2024 metric | Strategic role |
|---|---|---|
| Shinkansen | Dominant modal share, high demand | Brand & revenue engine |
| Suica/MaaS | >70M cards; rising mobile use | Network effects, data monetization |
| Inbound & tourism | 31.88M arrivals (2023) | Traffic & yield upside |
| Station redevelop. | High footfall, strong leasing | Asset value & retail income |
What is included in the product
 Detailed Word Document
BCG Matrix analysis of East Japan Railway: identifies Stars, Cash Cows, Question Marks, and Dogs with investment and divestment guidance.

 Customizable Excel Spreadsheet
One-page BCG matrix for East Japan Railway—maps units into quadrants to spot investment and divestment pain points fast.
Cash Cows

Tokyo metropolitan commuter network
Tokyo metropolitan commuter network delivers massive, habitual ridership—about 17 million boardings daily and retaining over 70% rail market share across the Kanto commuter belt—providing unmatched fare density. Timetables and operations are optimized to a science, keeping unit operating costs low and driving an operating cash flow in FY2024 of roughly ¥520 billion. Disciplined, incremental CAPEX targets capacity smoothing and reliability, allowing excess cash to fund growth bets across JR East.
Station retail: atre, ecute, NewDays
Station retail—atre, ecute, NewDays—leverages prime micro-locations with captive flows across JR East’s network (over 10 million daily passengers in 2024), light marketing and landlord-favorable rent economics. Proven formats (F&B, convenience, daily needs) and modest marketing spend lift basket size via mix tweaks; NewDays exceeds 1,300 stores (2024). Stable gross margins and predictable cash generation make them Cash Cows.

Station media and advertising
Station media offers high-visibility inventory with attention guaranteed—Shinjuku handles about 3.5 million daily passengers, Ikebukuro ~2.7 million and Tokyo ~437,000, concentrating reach. Yield management and growing digital screens support premium CPMs and occupancy. Sales cycles are efficient with high repeat-client rates. Low incremental cost per impression yields steady contribution to JR East operations.

Transit-oriented real estate leases
Transit-oriented real estate leases concentrate offices, shops, and services stacked above and around key stations in JR East’s network of 1,702 stations, capturing dense footfall and commuter demand.
These assets show mature occupancy with long leases and stable NOI, delivering predictable cash flows that require only modest capex refreshes to sustain rents.
They function as a quiet backbone cash source that smooths the group’s revenue cycle and underpins resilience through downturns.
- offices
- shops
- services
- mature occupancy
- long leases
- stable NOI
- modest capex
- cycle smoothing
Commuter passes and subscription ticketing
Commuter passes and subscription ticketing form a cash cow for JR East, delivering locked-in revenue from workers and students even as hybrid work trims peak ridership; JR East reported group revenue around ¥2.9 trillion for FY2023 (Apr 2023–Mar 2024), underpinning operations. Suica streamlines billing and issuance, allowing price revisions to flow through with limited churn. This dependable base funds service and digital experiments.
- Locked-in commuter revenue
- Suica-enabled low churn billing
- Price revisions pass-through
- Funds innovation and pilots
Tokyo network: ≈17M daily riders, ¥520bn cash flow
Tokyo commuter network (≈17 million boardings/day; >70% Kanto rail share) drives low unit costs and ~¥520bn operating cash flow in FY2024. Station retail (NewDays >1,300 stores in 2024) and station media yield stable margins and high-repeat sales. Transit real estate (1,702 stations) and commuter passes underpin predictable NOI and group revenue ~¥2.9tn (FY2023).
| Metric | Value |
|---|---|
| Daily boardings | ≈17,000,000 |
| FY2024 operating cash flow | ≈¥520bn |
| Group revenue (FY2023) | ≈¥2.9tn |
| Stations | 1,702 |
| NewDays stores (2024) | >1,300 |
What You’re Viewing Is Included
East Japan Railway BCG Matrix
The file you're previewing is the exact East Japan Railway BCG Matrix you'll receive after purchase. No watermarks or demo content—just the fully formatted, analysis-ready report. It's crafted for strategic clarity and immediately downloadable to edit, print, or present. Buy once and get the final, professional document delivered straight to your inbox.

Actionable Strategy Starts Here
Curious how East Japan Railway’s services and units stack up as Stars, Cash Cows, Dogs, or Question Marks? This preview highlights key trends—ridership hotspots, capital-intensive lines, and emerging segments—but the full BCG Matrix gives you quadrant-by-quadrant placement and strategic moves. Purchase the complete report for data-backed recommendations, a Word narrative, and an Excel summary you can use in presentations. Get instant access and start making smarter allocation and investment decisions today.
Stars
Tohoku & Joetsu Shinkansen corridors
Tohoku and Joetsu Shinkansen are JR East flagship high-speed corridors (E5 series up to 320 km/h) with dominant modal share and resurgent demand from business and inbound travel (Japan saw about 32 million visitors in 2023). They cannibalize air and express-bus traffic and set JR East’s brand tempo. Heavy capex and promotions remain needed to raise frequency, comfort and yield; defend share now to mature into major cash engines.
Mobile Suica and IC payment ecosystem
Mobile Suica and the IC payment ecosystem are near-ubiquitous across JR East’s territory, with Suica circulation reported at over 70 million cards and growing mobile adoption and open-loop partnerships in 2024. Network effects strengthen as merchants inside and outside stations expand acceptance, raising daily transaction volumes and merchant utility. High usage drives significant float and data monetization potential, but requires ongoing tech investment and security spend. Invest to cement leadership while digital wallets consolidate.
Inbound tourism passes and experiences
JR East inbound rail passes, curated routes and station-led tourism are riding Japan’s visitor boom—JNTO reported 31.88 million international arrivals in 2023. The group controls key corridors and touchpoints across its ~7,500 km network to package door-to-door journeys. Marketing and service upgrades still soak cash—guides, multilingual UX, baggage logistics and station retail. Hold share now and the flywheel spins faster.
Major station redevelopment megaprojects
Major station redevelopment megaprojects at Tokyo, Shinjuku and Sendai convert scale hubs into multi-use cities—offices, retail and hospitality—leveraging captive footfall (Shinjuku ~3.5m daily, Tokyo ~420k, Sendai ~120k) as modernized spaces lift visit duration and spend. Upfront capex is heavy, but 2024 leasing momentum and rising asset values push these sites into the network’s premium tier; maintaining leasing velocity is critical.
- Hubs: multi-use city model
- Footfall: captive and rising
- Risk/return: high capex, strong leasing & value upside
MaaS and integrated mobility apps
MaaS and integrated mobility apps aim to own the daily journey—ticketing, routing, payments and services—leveraging JR East’s pre‑COVID ~17 million daily riders and Suica transaction data to personalize travel. Features and data depth are growing but remain subscale vs super‑apps, so sustained marketing and product spend is required. Winning the daily habit would lock lifetime value across transit, retail and real estate.
- Scale: pre‑COVID ~17 million daily riders
- Strength: deep Suica/transaction data for personalization
- Weakness: subscale vs super‑apps, needs marketing/product fuel
- Opportunity: capture lifetime value across businesses
Scale transit cards, high-speed rail, tourism and stations to lock long-term cash engines
JR East stars—Shinkansen, Suica/MaaS, inbound tourism and station redevelopments—combine high market share and above‑market growth but require heavy capex to secure long‑term cash engines. 2024 metrics: Suica circulation >70M, pre‑COVID daily riders ~17M (recovery underway), 2023 inbound 31.88M; flagship hubs show strong leasing momentum. Defend share, scale monetization.
| Business | 2024 metric | Strategic role |
|---|---|---|
| Shinkansen | Dominant modal share, high demand | Brand & revenue engine |
| Suica/MaaS | >70M cards; rising mobile use | Network effects, data monetization |
| Inbound & tourism | 31.88M arrivals (2023) | Traffic & yield upside |
| Station redevelop. | High footfall, strong leasing | Asset value & retail income |
What is included in the product
Detailed Word Document
BCG Matrix analysis of East Japan Railway: identifies Stars, Cash Cows, Question Marks, and Dogs with investment and divestment guidance.
Customizable Excel Spreadsheet
One-page BCG matrix for East Japan Railway—maps units into quadrants to spot investment and divestment pain points fast.
Cash Cows
Tokyo metropolitan commuter network
Tokyo metropolitan commuter network delivers massive, habitual ridership—about 17 million boardings daily and retaining over 70% rail market share across the Kanto commuter belt—providing unmatched fare density. Timetables and operations are optimized to a science, keeping unit operating costs low and driving an operating cash flow in FY2024 of roughly ¥520 billion. Disciplined, incremental CAPEX targets capacity smoothing and reliability, allowing excess cash to fund growth bets across JR East.
Station retail: atre, ecute, NewDays
Station retail—atre, ecute, NewDays—leverages prime micro-locations with captive flows across JR East’s network (over 10 million daily passengers in 2024), light marketing and landlord-favorable rent economics. Proven formats (F&B, convenience, daily needs) and modest marketing spend lift basket size via mix tweaks; NewDays exceeds 1,300 stores (2024). Stable gross margins and predictable cash generation make them Cash Cows.
Station media and advertising
Station media offers high-visibility inventory with attention guaranteed—Shinjuku handles about 3.5 million daily passengers, Ikebukuro ~2.7 million and Tokyo ~437,000, concentrating reach. Yield management and growing digital screens support premium CPMs and occupancy. Sales cycles are efficient with high repeat-client rates. Low incremental cost per impression yields steady contribution to JR East operations.
Transit-oriented real estate leases
Transit-oriented real estate leases concentrate offices, shops, and services stacked above and around key stations in JR East’s network of 1,702 stations, capturing dense footfall and commuter demand.
These assets show mature occupancy with long leases and stable NOI, delivering predictable cash flows that require only modest capex refreshes to sustain rents.
They function as a quiet backbone cash source that smooths the group’s revenue cycle and underpins resilience through downturns.
- offices
- shops
- services
- mature occupancy
- long leases
- stable NOI
- modest capex
- cycle smoothing
Commuter passes and subscription ticketing
Commuter passes and subscription ticketing form a cash cow for JR East, delivering locked-in revenue from workers and students even as hybrid work trims peak ridership; JR East reported group revenue around ¥2.9 trillion for FY2023 (Apr 2023–Mar 2024), underpinning operations. Suica streamlines billing and issuance, allowing price revisions to flow through with limited churn. This dependable base funds service and digital experiments.
- Locked-in commuter revenue
- Suica-enabled low churn billing
- Price revisions pass-through
- Funds innovation and pilots
Tokyo network: ≈17M daily riders, ¥520bn cash flow
Tokyo commuter network (≈17 million boardings/day; >70% Kanto rail share) drives low unit costs and ~¥520bn operating cash flow in FY2024. Station retail (NewDays >1,300 stores in 2024) and station media yield stable margins and high-repeat sales. Transit real estate (1,702 stations) and commuter passes underpin predictable NOI and group revenue ~¥2.9tn (FY2023).
| Metric | Value |
|---|---|
| Daily boardings | ≈17,000,000 |
| FY2024 operating cash flow | ≈¥520bn |
| Group revenue (FY2023) | ≈¥2.9tn |
| Stations | 1,702 |
| NewDays stores (2024) | >1,300 |
What You’re Viewing Is Included
East Japan Railway BCG Matrix
The file you're previewing is the exact East Japan Railway BCG Matrix you'll receive after purchase. No watermarks or demo content—just the fully formatted, analysis-ready report. It's crafted for strategic clarity and immediately downloadable to edit, print, or present. Buy once and get the final, professional document delivered straight to your inbox.
Original: $10.00
-65%$10.00
$3.50Description
Actionable Strategy Starts Here
Curious how East Japan Railway’s services and units stack up as Stars, Cash Cows, Dogs, or Question Marks? This preview highlights key trends—ridership hotspots, capital-intensive lines, and emerging segments—but the full BCG Matrix gives you quadrant-by-quadrant placement and strategic moves. Purchase the complete report for data-backed recommendations, a Word narrative, and an Excel summary you can use in presentations. Get instant access and start making smarter allocation and investment decisions today.
Stars
Tohoku & Joetsu Shinkansen corridors
Tohoku and Joetsu Shinkansen are JR East flagship high-speed corridors (E5 series up to 320 km/h) with dominant modal share and resurgent demand from business and inbound travel (Japan saw about 32 million visitors in 2023). They cannibalize air and express-bus traffic and set JR East’s brand tempo. Heavy capex and promotions remain needed to raise frequency, comfort and yield; defend share now to mature into major cash engines.
Mobile Suica and IC payment ecosystem
Mobile Suica and the IC payment ecosystem are near-ubiquitous across JR East’s territory, with Suica circulation reported at over 70 million cards and growing mobile adoption and open-loop partnerships in 2024. Network effects strengthen as merchants inside and outside stations expand acceptance, raising daily transaction volumes and merchant utility. High usage drives significant float and data monetization potential, but requires ongoing tech investment and security spend. Invest to cement leadership while digital wallets consolidate.
Inbound tourism passes and experiences
JR East inbound rail passes, curated routes and station-led tourism are riding Japan’s visitor boom—JNTO reported 31.88 million international arrivals in 2023. The group controls key corridors and touchpoints across its ~7,500 km network to package door-to-door journeys. Marketing and service upgrades still soak cash—guides, multilingual UX, baggage logistics and station retail. Hold share now and the flywheel spins faster.
Major station redevelopment megaprojects
Major station redevelopment megaprojects at Tokyo, Shinjuku and Sendai convert scale hubs into multi-use cities—offices, retail and hospitality—leveraging captive footfall (Shinjuku ~3.5m daily, Tokyo ~420k, Sendai ~120k) as modernized spaces lift visit duration and spend. Upfront capex is heavy, but 2024 leasing momentum and rising asset values push these sites into the network’s premium tier; maintaining leasing velocity is critical.
- Hubs: multi-use city model
- Footfall: captive and rising
- Risk/return: high capex, strong leasing & value upside
MaaS and integrated mobility apps
MaaS and integrated mobility apps aim to own the daily journey—ticketing, routing, payments and services—leveraging JR East’s pre‑COVID ~17 million daily riders and Suica transaction data to personalize travel. Features and data depth are growing but remain subscale vs super‑apps, so sustained marketing and product spend is required. Winning the daily habit would lock lifetime value across transit, retail and real estate.
- Scale: pre‑COVID ~17 million daily riders
- Strength: deep Suica/transaction data for personalization
- Weakness: subscale vs super‑apps, needs marketing/product fuel
- Opportunity: capture lifetime value across businesses
Scale transit cards, high-speed rail, tourism and stations to lock long-term cash engines
JR East stars—Shinkansen, Suica/MaaS, inbound tourism and station redevelopments—combine high market share and above‑market growth but require heavy capex to secure long‑term cash engines. 2024 metrics: Suica circulation >70M, pre‑COVID daily riders ~17M (recovery underway), 2023 inbound 31.88M; flagship hubs show strong leasing momentum. Defend share, scale monetization.
| Business | 2024 metric | Strategic role |
|---|---|---|
| Shinkansen | Dominant modal share, high demand | Brand & revenue engine |
| Suica/MaaS | >70M cards; rising mobile use | Network effects, data monetization |
| Inbound & tourism | 31.88M arrivals (2023) | Traffic & yield upside |
| Station redevelop. | High footfall, strong leasing | Asset value & retail income |
What is included in the product
Detailed Word Document
BCG Matrix analysis of East Japan Railway: identifies Stars, Cash Cows, Question Marks, and Dogs with investment and divestment guidance.
Customizable Excel Spreadsheet
One-page BCG matrix for East Japan Railway—maps units into quadrants to spot investment and divestment pain points fast.
Cash Cows
Tokyo metropolitan commuter network
Tokyo metropolitan commuter network delivers massive, habitual ridership—about 17 million boardings daily and retaining over 70% rail market share across the Kanto commuter belt—providing unmatched fare density. Timetables and operations are optimized to a science, keeping unit operating costs low and driving an operating cash flow in FY2024 of roughly ¥520 billion. Disciplined, incremental CAPEX targets capacity smoothing and reliability, allowing excess cash to fund growth bets across JR East.
Station retail: atre, ecute, NewDays
Station retail—atre, ecute, NewDays—leverages prime micro-locations with captive flows across JR East’s network (over 10 million daily passengers in 2024), light marketing and landlord-favorable rent economics. Proven formats (F&B, convenience, daily needs) and modest marketing spend lift basket size via mix tweaks; NewDays exceeds 1,300 stores (2024). Stable gross margins and predictable cash generation make them Cash Cows.
Station media and advertising
Station media offers high-visibility inventory with attention guaranteed—Shinjuku handles about 3.5 million daily passengers, Ikebukuro ~2.7 million and Tokyo ~437,000, concentrating reach. Yield management and growing digital screens support premium CPMs and occupancy. Sales cycles are efficient with high repeat-client rates. Low incremental cost per impression yields steady contribution to JR East operations.
Transit-oriented real estate leases
Transit-oriented real estate leases concentrate offices, shops, and services stacked above and around key stations in JR East’s network of 1,702 stations, capturing dense footfall and commuter demand.
These assets show mature occupancy with long leases and stable NOI, delivering predictable cash flows that require only modest capex refreshes to sustain rents.
They function as a quiet backbone cash source that smooths the group’s revenue cycle and underpins resilience through downturns.
- offices
- shops
- services
- mature occupancy
- long leases
- stable NOI
- modest capex
- cycle smoothing
Commuter passes and subscription ticketing
Commuter passes and subscription ticketing form a cash cow for JR East, delivering locked-in revenue from workers and students even as hybrid work trims peak ridership; JR East reported group revenue around ¥2.9 trillion for FY2023 (Apr 2023–Mar 2024), underpinning operations. Suica streamlines billing and issuance, allowing price revisions to flow through with limited churn. This dependable base funds service and digital experiments.
- Locked-in commuter revenue
- Suica-enabled low churn billing
- Price revisions pass-through
- Funds innovation and pilots
Tokyo network: ≈17M daily riders, ¥520bn cash flow
Tokyo commuter network (≈17 million boardings/day; >70% Kanto rail share) drives low unit costs and ~¥520bn operating cash flow in FY2024. Station retail (NewDays >1,300 stores in 2024) and station media yield stable margins and high-repeat sales. Transit real estate (1,702 stations) and commuter passes underpin predictable NOI and group revenue ~¥2.9tn (FY2023).
| Metric | Value |
|---|---|
| Daily boardings | ≈17,000,000 |
| FY2024 operating cash flow | ≈¥520bn |
| Group revenue (FY2023) | ≈¥2.9tn |
| Stations | 1,702 |
| NewDays stores (2024) | >1,300 |
What You’re Viewing Is Included
East Japan Railway BCG Matrix
The file you're previewing is the exact East Japan Railway BCG Matrix you'll receive after purchase. No watermarks or demo content—just the fully formatted, analysis-ready report. It's crafted for strategic clarity and immediately downloadable to edit, print, or present. Buy once and get the final, professional document delivered straight to your inbox.











