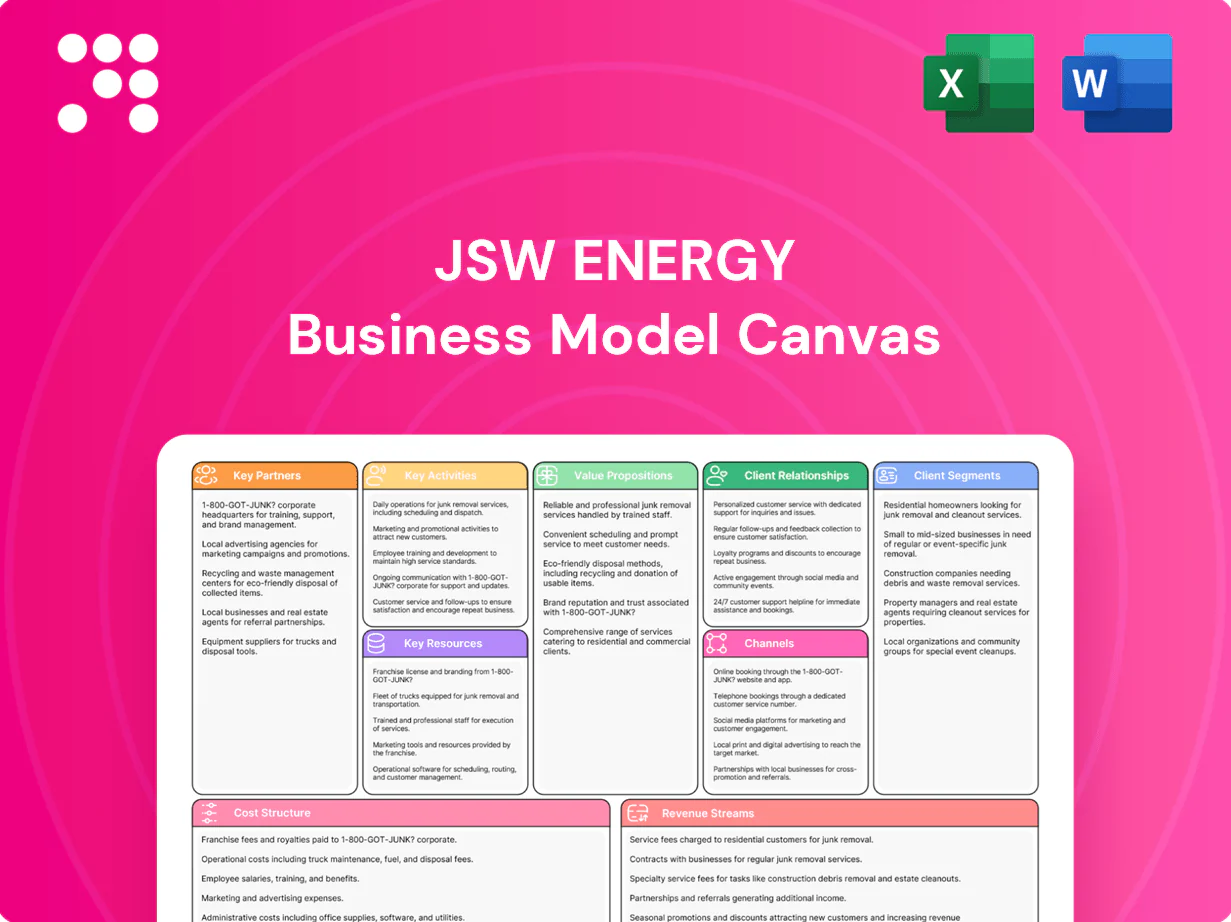
JSW Energy Business Model Canvas

Business Model Canvas for Integrated Power & Renewables: Strategic & Financial Blueprint
Unlock the full strategic blueprint behind JSW Energy’s Business Model Canvas and discover how it converts asset-scale, integrated power generation, and renewables into sustainable margin and market share. This concise, actionable canvas maps customer segments, revenue streams, key partnerships and financial levers—ideal for investors, consultants, and strategists. Download the complete Word & Excel files to benchmark, adapt, and drive decisions with confidence.
Partnerships

DISCOMs and state utilities
Long-term PPAs with DISCOMs anchor demand visibility and bankability for JSW Energy, which had about 5,725 MW capacity in 2024; typical PPA tenors of 15–25 years secure cash flows for lenders. Close collaboration ensures scheduling, metering and settlements run smoothly and joint planning aligns generation with grid constraints and peak demand. Regular utility interfaces enable coordinated responses to policy and tariff changes impacting revenues.
Fuel suppliers and logistics providers
Thermal assets depend on coal, gas and biomass suppliers plus rail, road and port logistics; secure long‑term contracts and tolling agreements reduce supply risk and price volatility. Blending strategies and linkage allocations optimize heat rates and fuel cost per MWh. Close coordination with logistics partners improves inventory turns and plant load factors, raising operational availability and reducing forced outages.

OEMs, EPCs, and technology vendors
OEMs for turbines, boilers, inverters and BOP deliver performance upgrades that can improve plant heat-rate and availability (field upgrades often yield up to 5% efficiency gains) while EPC partners compress greenfield and brownfield timelines—supporting JSW Energy’s 2030 growth target of 20 GW—by accelerating execution and de‑risking capex. Digital vendors enable predictive maintenance that cuts unplanned downtime 20–50% (2024 studies) and smooths grid integration; LTSA/AMC frameworks tie payments to uptime and efficiency outcomes, aligning incentives across assets and service providers.

Financial institutions and infrastructure investors
Banks, NBFCs and bond investors provided funding for JSW Energy’s capex and refinancing, supporting over Rs 10,000 crore of investments in FY2024 and medium-term refinancing needs.
Green and sustainability-linked instruments lowered cost of capital by roughly 50 basis points in 2024, improving project IRRs and enabling cheaper debt for renewables and hydro assets.
Partnerships with infrastructure funds enabled platform growth and asset recycling, while treasury collaboration optimized hedging and liquidity management.
- Banks/NBFCs/bond investors: Rs 10,000 crore FY2024 funding
- Green/SLL impact: ~50 bps lower cost of capital in 2024
- Infra funds: platform growth + asset recycling
- Treasury: improved hedging and liquidity
Government bodies and renewable developers
Government central and state agencies enable permits, incentives and transmission access, aligning with India’s 500 GW non-fossil capacity target by 2030. JV/M&A with renewable developers accelerates capacity addition; SECI and NTPC partnerships secure auction access and offtake certainty. Compliance partners manage ESG, safety and environmental standards.
- Permits/incentives: government agencies
- Growth: JV/M&A for fast capacity add
- Auction/offtake: SECI/NTPC access
- Compliance: ESG, safety, environment
DISCOM PPAs secure 5,725 MW, Rs 10,000 cr funding, -50 bps
Long‑term PPAs with DISCOMs secure demand for JSW Energy (5,725 MW capacity in 2024) and bankable tenors. Lenders and bond markets funded ~Rs 10,000 crore in FY2024 while green/SLL deals cut cost of capital ~50 bps. OEMs, EPCs and infra partners accelerate the 2030 20 GW growth plan and boost efficiency and availability.
| Partner | Role | 2024 metric |
|---|---|---|
| DISCOMs | PPA/offtake | 5,725 MW |
| Banks/NBFCs | Funding | Rs 10,000 cr |
| Green/SLL | Lower CoC | -50 bps |
What is included in the product
 Detailed Word Document
A concise, pre-built Business Model Canvas tailored to JSW Energy’s strategy, mapping customer segments, channels, value propositions and revenue drivers across the 9 BMC blocks. Designed for presentations and investor discussions, it mirrors real operations, highlights competitive advantages and includes linked SWOT insights for decision-making.

 Customizable Excel Spreadsheet
High-level view of JSW Energy’s business model with editable cells to quickly identify generation, transmission, and renewables strategies and streamline strategic decisions.
Activities

Power generation operations
Operate thermal, hydro and renewable assets to meet day-ahead and real-time dispatch schedules, leveraging an approximately 4.4 GW operational portfolio in 2024 to serve industrial and open-market demand. Focus on optimizing plant load factors and heat rates to improve fuel efficiency and margins while enforcing strict safety and O&M protocols. Balance hydro storage with wind/solar intermittency through portfolio scheduling and short-term market bids. Coordinate continuously with SLDCs and RLDCs for frequency response and grid stability.
O&M and performance optimization
Execute preventive and predictive maintenance to maximize plant availability — JSW Energy, with ~5,539 MW consolidated capacity as of Mar 31, 2024, targets >92% availability through condition-based scheduling. Use analytics for continuous condition monitoring and root-cause analysis to cut unplanned downtime. Implement retrofits for efficiency, emissions reduction and life extension, while tightly managing spares, outages and contractor performance.

Project development and execution
Identify sites, secure land, and obtain statutory clearances to support JSW Energy's ~5.5 GW portfolio (2024), prioritizing regions with transmission headroom. Close PPAs, transmission connectivity and project financing to lock revenue streams and debt coverages. Oversee EPC contracts, rigorous quality control and commissioning milestones. Post-COD, execute ramp-up and stabilization to meet contractual performance and availability targets.

Power trading and portfolio management
Power trading and portfolio management for JSW Energy balances sales via PPAs, exchanges and bilateral contracts, leveraging an operational fleet of ~4.35 GW in 2024 to match demand and revenue targets.
Hedging across time blocks and seasons, optimizing scheduling, deviations and imbalance settlements, and monetizing green attributes and RE bundling enhance merchant returns and risk control.
- PPAs / exchanges / bilateral sales
- Time-block & seasonal hedges
- Scheduling & imbalance optimization
- Green attribute monetization
Regulatory, ESG, and risk management
JSW Energy engages regulators on tariffs, open access and market design to secure remunerative power offtake and grid access while adapting to CERC/State tariff reforms; the company operates about 5.75 GW installed capacity (FY24) which shapes its regulatory dialogue. It drives decarbonization through renewables scale-up and disclosures aligned with TCFD/SEBI expectations, manages fuel, interest-rate and counterparty risks via hedging and diversified fuel mix, and enforces safety and environmental compliance across plants.
- Regulatory engagement: tariffs, open access, market design
- Decarbonization: renewables scale-up, TCFD/SEBI disclosures
- Risk management: fuel hedging, interest-rate swaps, counterparty limits
- Compliance: safety protocols, environmental norms
Dispatch 5.75 GW, aim >92% avail via predictive analytics
Operate and dispatch a 5.75 GW (FY24) thermal, hydro and renewables portfolio to meet day-ahead/real-time markets and industrial PPAs. Target >92% availability via preventive/predictive maintenance and analytics. Secure land, clearances, PPAs and financing; manage trading, hedges and regulatory engagement to optimize revenues and control risks.
| Metric | FY24 |
|---|---|
| Installed capacity | 5.75 GW |
| Operational fleet (2024) | ≈4.35–4.4 GW |
| Target availability | >92% |
| Consolidated cap (Mar 31, 2024) | ≈5.539 GW |
Preview Before You Purchase
Business Model Canvas
The JSW Energy Business Model Canvas previewed here is the exact document you will receive after purchase — not a mockup or sample. When you complete your order you’ll get the full, ready-to-use file in Word and Excel formats, structured and formatted exactly as shown. It’s editable, complete, and ready for presentation or analysis with no hidden content.

Business Model Canvas for Integrated Power & Renewables: Strategic & Financial Blueprint
Unlock the full strategic blueprint behind JSW Energy’s Business Model Canvas and discover how it converts asset-scale, integrated power generation, and renewables into sustainable margin and market share. This concise, actionable canvas maps customer segments, revenue streams, key partnerships and financial levers—ideal for investors, consultants, and strategists. Download the complete Word & Excel files to benchmark, adapt, and drive decisions with confidence.
Partnerships
DISCOMs and state utilities
Long-term PPAs with DISCOMs anchor demand visibility and bankability for JSW Energy, which had about 5,725 MW capacity in 2024; typical PPA tenors of 15–25 years secure cash flows for lenders. Close collaboration ensures scheduling, metering and settlements run smoothly and joint planning aligns generation with grid constraints and peak demand. Regular utility interfaces enable coordinated responses to policy and tariff changes impacting revenues.
Fuel suppliers and logistics providers
Thermal assets depend on coal, gas and biomass suppliers plus rail, road and port logistics; secure long‑term contracts and tolling agreements reduce supply risk and price volatility. Blending strategies and linkage allocations optimize heat rates and fuel cost per MWh. Close coordination with logistics partners improves inventory turns and plant load factors, raising operational availability and reducing forced outages.
OEMs, EPCs, and technology vendors
OEMs for turbines, boilers, inverters and BOP deliver performance upgrades that can improve plant heat-rate and availability (field upgrades often yield up to 5% efficiency gains) while EPC partners compress greenfield and brownfield timelines—supporting JSW Energy’s 2030 growth target of 20 GW—by accelerating execution and de‑risking capex. Digital vendors enable predictive maintenance that cuts unplanned downtime 20–50% (2024 studies) and smooths grid integration; LTSA/AMC frameworks tie payments to uptime and efficiency outcomes, aligning incentives across assets and service providers.
Financial institutions and infrastructure investors
Banks, NBFCs and bond investors provided funding for JSW Energy’s capex and refinancing, supporting over Rs 10,000 crore of investments in FY2024 and medium-term refinancing needs.
Green and sustainability-linked instruments lowered cost of capital by roughly 50 basis points in 2024, improving project IRRs and enabling cheaper debt for renewables and hydro assets.
Partnerships with infrastructure funds enabled platform growth and asset recycling, while treasury collaboration optimized hedging and liquidity management.
- Banks/NBFCs/bond investors: Rs 10,000 crore FY2024 funding
- Green/SLL impact: ~50 bps lower cost of capital in 2024
- Infra funds: platform growth + asset recycling
- Treasury: improved hedging and liquidity
Government bodies and renewable developers
Government central and state agencies enable permits, incentives and transmission access, aligning with India’s 500 GW non-fossil capacity target by 2030. JV/M&A with renewable developers accelerates capacity addition; SECI and NTPC partnerships secure auction access and offtake certainty. Compliance partners manage ESG, safety and environmental standards.
- Permits/incentives: government agencies
- Growth: JV/M&A for fast capacity add
- Auction/offtake: SECI/NTPC access
- Compliance: ESG, safety, environment
DISCOM PPAs secure 5,725 MW, Rs 10,000 cr funding, -50 bps
Long‑term PPAs with DISCOMs secure demand for JSW Energy (5,725 MW capacity in 2024) and bankable tenors. Lenders and bond markets funded ~Rs 10,000 crore in FY2024 while green/SLL deals cut cost of capital ~50 bps. OEMs, EPCs and infra partners accelerate the 2030 20 GW growth plan and boost efficiency and availability.
| Partner | Role | 2024 metric |
|---|---|---|
| DISCOMs | PPA/offtake | 5,725 MW |
| Banks/NBFCs | Funding | Rs 10,000 cr |
| Green/SLL | Lower CoC | -50 bps |
What is included in the product
Detailed Word Document
A concise, pre-built Business Model Canvas tailored to JSW Energy’s strategy, mapping customer segments, channels, value propositions and revenue drivers across the 9 BMC blocks. Designed for presentations and investor discussions, it mirrors real operations, highlights competitive advantages and includes linked SWOT insights for decision-making.
Customizable Excel Spreadsheet
High-level view of JSW Energy’s business model with editable cells to quickly identify generation, transmission, and renewables strategies and streamline strategic decisions.
Activities
Power generation operations
Operate thermal, hydro and renewable assets to meet day-ahead and real-time dispatch schedules, leveraging an approximately 4.4 GW operational portfolio in 2024 to serve industrial and open-market demand. Focus on optimizing plant load factors and heat rates to improve fuel efficiency and margins while enforcing strict safety and O&M protocols. Balance hydro storage with wind/solar intermittency through portfolio scheduling and short-term market bids. Coordinate continuously with SLDCs and RLDCs for frequency response and grid stability.
O&M and performance optimization
Execute preventive and predictive maintenance to maximize plant availability — JSW Energy, with ~5,539 MW consolidated capacity as of Mar 31, 2024, targets >92% availability through condition-based scheduling. Use analytics for continuous condition monitoring and root-cause analysis to cut unplanned downtime. Implement retrofits for efficiency, emissions reduction and life extension, while tightly managing spares, outages and contractor performance.
Project development and execution
Identify sites, secure land, and obtain statutory clearances to support JSW Energy's ~5.5 GW portfolio (2024), prioritizing regions with transmission headroom. Close PPAs, transmission connectivity and project financing to lock revenue streams and debt coverages. Oversee EPC contracts, rigorous quality control and commissioning milestones. Post-COD, execute ramp-up and stabilization to meet contractual performance and availability targets.
Power trading and portfolio management
Power trading and portfolio management for JSW Energy balances sales via PPAs, exchanges and bilateral contracts, leveraging an operational fleet of ~4.35 GW in 2024 to match demand and revenue targets.
Hedging across time blocks and seasons, optimizing scheduling, deviations and imbalance settlements, and monetizing green attributes and RE bundling enhance merchant returns and risk control.
- PPAs / exchanges / bilateral sales
- Time-block & seasonal hedges
- Scheduling & imbalance optimization
- Green attribute monetization
Regulatory, ESG, and risk management
JSW Energy engages regulators on tariffs, open access and market design to secure remunerative power offtake and grid access while adapting to CERC/State tariff reforms; the company operates about 5.75 GW installed capacity (FY24) which shapes its regulatory dialogue. It drives decarbonization through renewables scale-up and disclosures aligned with TCFD/SEBI expectations, manages fuel, interest-rate and counterparty risks via hedging and diversified fuel mix, and enforces safety and environmental compliance across plants.
- Regulatory engagement: tariffs, open access, market design
- Decarbonization: renewables scale-up, TCFD/SEBI disclosures
- Risk management: fuel hedging, interest-rate swaps, counterparty limits
- Compliance: safety protocols, environmental norms
Dispatch 5.75 GW, aim >92% avail via predictive analytics
Operate and dispatch a 5.75 GW (FY24) thermal, hydro and renewables portfolio to meet day-ahead/real-time markets and industrial PPAs. Target >92% availability via preventive/predictive maintenance and analytics. Secure land, clearances, PPAs and financing; manage trading, hedges and regulatory engagement to optimize revenues and control risks.
| Metric | FY24 |
|---|---|
| Installed capacity | 5.75 GW |
| Operational fleet (2024) | ≈4.35–4.4 GW |
| Target availability | >92% |
| Consolidated cap (Mar 31, 2024) | ≈5.539 GW |
Preview Before You Purchase
Business Model Canvas
The JSW Energy Business Model Canvas previewed here is the exact document you will receive after purchase — not a mockup or sample. When you complete your order you’ll get the full, ready-to-use file in Word and Excel formats, structured and formatted exactly as shown. It’s editable, complete, and ready for presentation or analysis with no hidden content.
Description
Business Model Canvas for Integrated Power & Renewables: Strategic & Financial Blueprint
Unlock the full strategic blueprint behind JSW Energy’s Business Model Canvas and discover how it converts asset-scale, integrated power generation, and renewables into sustainable margin and market share. This concise, actionable canvas maps customer segments, revenue streams, key partnerships and financial levers—ideal for investors, consultants, and strategists. Download the complete Word & Excel files to benchmark, adapt, and drive decisions with confidence.
Partnerships
DISCOMs and state utilities
Long-term PPAs with DISCOMs anchor demand visibility and bankability for JSW Energy, which had about 5,725 MW capacity in 2024; typical PPA tenors of 15–25 years secure cash flows for lenders. Close collaboration ensures scheduling, metering and settlements run smoothly and joint planning aligns generation with grid constraints and peak demand. Regular utility interfaces enable coordinated responses to policy and tariff changes impacting revenues.
Fuel suppliers and logistics providers
Thermal assets depend on coal, gas and biomass suppliers plus rail, road and port logistics; secure long‑term contracts and tolling agreements reduce supply risk and price volatility. Blending strategies and linkage allocations optimize heat rates and fuel cost per MWh. Close coordination with logistics partners improves inventory turns and plant load factors, raising operational availability and reducing forced outages.
OEMs, EPCs, and technology vendors
OEMs for turbines, boilers, inverters and BOP deliver performance upgrades that can improve plant heat-rate and availability (field upgrades often yield up to 5% efficiency gains) while EPC partners compress greenfield and brownfield timelines—supporting JSW Energy’s 2030 growth target of 20 GW—by accelerating execution and de‑risking capex. Digital vendors enable predictive maintenance that cuts unplanned downtime 20–50% (2024 studies) and smooths grid integration; LTSA/AMC frameworks tie payments to uptime and efficiency outcomes, aligning incentives across assets and service providers.
Financial institutions and infrastructure investors
Banks, NBFCs and bond investors provided funding for JSW Energy’s capex and refinancing, supporting over Rs 10,000 crore of investments in FY2024 and medium-term refinancing needs.
Green and sustainability-linked instruments lowered cost of capital by roughly 50 basis points in 2024, improving project IRRs and enabling cheaper debt for renewables and hydro assets.
Partnerships with infrastructure funds enabled platform growth and asset recycling, while treasury collaboration optimized hedging and liquidity management.
- Banks/NBFCs/bond investors: Rs 10,000 crore FY2024 funding
- Green/SLL impact: ~50 bps lower cost of capital in 2024
- Infra funds: platform growth + asset recycling
- Treasury: improved hedging and liquidity
Government bodies and renewable developers
Government central and state agencies enable permits, incentives and transmission access, aligning with India’s 500 GW non-fossil capacity target by 2030. JV/M&A with renewable developers accelerates capacity addition; SECI and NTPC partnerships secure auction access and offtake certainty. Compliance partners manage ESG, safety and environmental standards.
- Permits/incentives: government agencies
- Growth: JV/M&A for fast capacity add
- Auction/offtake: SECI/NTPC access
- Compliance: ESG, safety, environment
DISCOM PPAs secure 5,725 MW, Rs 10,000 cr funding, -50 bps
Long‑term PPAs with DISCOMs secure demand for JSW Energy (5,725 MW capacity in 2024) and bankable tenors. Lenders and bond markets funded ~Rs 10,000 crore in FY2024 while green/SLL deals cut cost of capital ~50 bps. OEMs, EPCs and infra partners accelerate the 2030 20 GW growth plan and boost efficiency and availability.
| Partner | Role | 2024 metric |
|---|---|---|
| DISCOMs | PPA/offtake | 5,725 MW |
| Banks/NBFCs | Funding | Rs 10,000 cr |
| Green/SLL | Lower CoC | -50 bps |
What is included in the product
Detailed Word Document
A concise, pre-built Business Model Canvas tailored to JSW Energy’s strategy, mapping customer segments, channels, value propositions and revenue drivers across the 9 BMC blocks. Designed for presentations and investor discussions, it mirrors real operations, highlights competitive advantages and includes linked SWOT insights for decision-making.
Customizable Excel Spreadsheet
High-level view of JSW Energy’s business model with editable cells to quickly identify generation, transmission, and renewables strategies and streamline strategic decisions.
Activities
Power generation operations
Operate thermal, hydro and renewable assets to meet day-ahead and real-time dispatch schedules, leveraging an approximately 4.4 GW operational portfolio in 2024 to serve industrial and open-market demand. Focus on optimizing plant load factors and heat rates to improve fuel efficiency and margins while enforcing strict safety and O&M protocols. Balance hydro storage with wind/solar intermittency through portfolio scheduling and short-term market bids. Coordinate continuously with SLDCs and RLDCs for frequency response and grid stability.
O&M and performance optimization
Execute preventive and predictive maintenance to maximize plant availability — JSW Energy, with ~5,539 MW consolidated capacity as of Mar 31, 2024, targets >92% availability through condition-based scheduling. Use analytics for continuous condition monitoring and root-cause analysis to cut unplanned downtime. Implement retrofits for efficiency, emissions reduction and life extension, while tightly managing spares, outages and contractor performance.
Project development and execution
Identify sites, secure land, and obtain statutory clearances to support JSW Energy's ~5.5 GW portfolio (2024), prioritizing regions with transmission headroom. Close PPAs, transmission connectivity and project financing to lock revenue streams and debt coverages. Oversee EPC contracts, rigorous quality control and commissioning milestones. Post-COD, execute ramp-up and stabilization to meet contractual performance and availability targets.
Power trading and portfolio management
Power trading and portfolio management for JSW Energy balances sales via PPAs, exchanges and bilateral contracts, leveraging an operational fleet of ~4.35 GW in 2024 to match demand and revenue targets.
Hedging across time blocks and seasons, optimizing scheduling, deviations and imbalance settlements, and monetizing green attributes and RE bundling enhance merchant returns and risk control.
- PPAs / exchanges / bilateral sales
- Time-block & seasonal hedges
- Scheduling & imbalance optimization
- Green attribute monetization
Regulatory, ESG, and risk management
JSW Energy engages regulators on tariffs, open access and market design to secure remunerative power offtake and grid access while adapting to CERC/State tariff reforms; the company operates about 5.75 GW installed capacity (FY24) which shapes its regulatory dialogue. It drives decarbonization through renewables scale-up and disclosures aligned with TCFD/SEBI expectations, manages fuel, interest-rate and counterparty risks via hedging and diversified fuel mix, and enforces safety and environmental compliance across plants.
- Regulatory engagement: tariffs, open access, market design
- Decarbonization: renewables scale-up, TCFD/SEBI disclosures
- Risk management: fuel hedging, interest-rate swaps, counterparty limits
- Compliance: safety protocols, environmental norms
Dispatch 5.75 GW, aim >92% avail via predictive analytics
Operate and dispatch a 5.75 GW (FY24) thermal, hydro and renewables portfolio to meet day-ahead/real-time markets and industrial PPAs. Target >92% availability via preventive/predictive maintenance and analytics. Secure land, clearances, PPAs and financing; manage trading, hedges and regulatory engagement to optimize revenues and control risks.
| Metric | FY24 |
|---|---|
| Installed capacity | 5.75 GW |
| Operational fleet (2024) | ≈4.35–4.4 GW |
| Target availability | >92% |
| Consolidated cap (Mar 31, 2024) | ≈5.539 GW |
Preview Before You Purchase
Business Model Canvas
The JSW Energy Business Model Canvas previewed here is the exact document you will receive after purchase — not a mockup or sample. When you complete your order you’ll get the full, ready-to-use file in Word and Excel formats, structured and formatted exactly as shown. It’s editable, complete, and ready for presentation or analysis with no hidden content.











