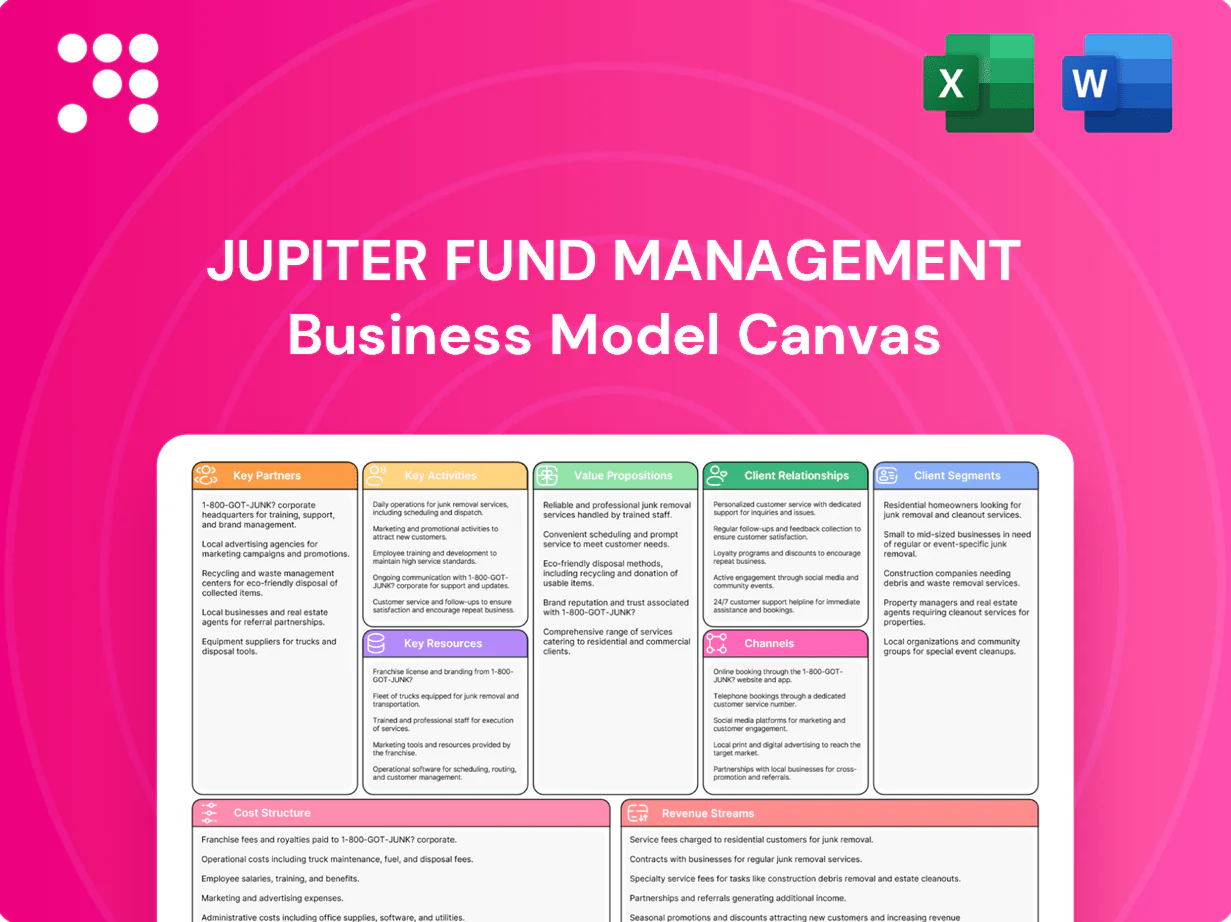
Jupiter Fund Management Business Model Canvas

Fund Manager Business Model Canvas — concise strategic blueprint for investors
Unlock Jupiter Fund Management’s strategic playbook with our concise Business Model Canvas—three to five sentences here sketch the value propositions, customer segments, and growth levers that underpin its market position. Dive into revenue streams, partnerships, and cost structure mapped for quick insight. Purchase the full Canvas to get an editable, section-by-section blueprint ready for analysis, benchmarking, or investor decks.
Partnerships

Global custodians and fund administrators
Global custodians and fund administrators safeguard client assets, process fund accounting and support NAV calculation across domiciles, with SLAs that target accuracy and same-day timeliness to meet regulatory requirements. Top custodians held over $100 trillion in assets as of 2024, enabling scalable operations as AUM and product complexity grow. Collaborative oversight between Jupiter and these partners reduces operational risk and enhances investor confidence.
Broker-dealers and liquidity providers
Execution quality directly impacts portfolio outcomes and trading costs for Jupiter, which manages circa £50bn AUM (2024). Relationships span equities, fixed income, FX and derivatives to support multi-asset mandates. Access to deep liquidity in volatile markets enables timely active positioning. Best-execution monitoring and client-specific CSA arrangements improve transparency and research access.

Research, data, and analytics vendors
Third-party research complements Jupiter’s internal sector, credit, and macro insights, supplying roughly 30% of external idea flow while broadening coverage. Data feeds, ESG ratings and alternative datasets—with the alternative data market valued at about $6.7bn in 2024—enhance idea generation and cross-asset signals. Risk and analytics tools enable factor, scenario and attribution analysis across portfolios. Vendor partnerships accelerate innovation and clarify build-versus-buy trade-offs.

Distribution platforms and financial intermediaries
Ties with IFAs, wealth managers and platforms expand Jupiter’s reach into UK retail and adviser channels; platform listings and model-portfolio placements boost visibility as platforms held c.£1.1tn of UK retail fund assets in 2024 (≈70% share). Joint marketing, due diligence and training improve product fit and uptake, while fee-sharing and compliant distribution agreements align incentives and retention.
- IFA & wealth-manager access
- Platform listings & model portfolios
- Joint marketing, due diligence, training
- Fee-sharing & compliant agreements
Regulatory, legal, and audit partners
Specialist counsel and Big Four auditors secure Jupiter Fund Management’s governance and disclosures, ensuring compliance with UCITS V (2014), AIFMD (2011) and MiFID II (2018).
Support covers cross-border regimes and independent assurance that underpins trust with institutional and retail clients.
Ongoing horizon scanning and regulatory intelligence pre-empt rule changes and adapt internal controls.
- Specialist counsel; Big Four auditors
- UCITS V (2014), AIFMD (2011), MiFID II (2018)
- Independent assurance → client trust
- Horizon scanning → proactive controls
Custodians >$100tn, fund £50bn and platforms £1.1tn power scalable custody
Global custodians, fund administrators and execution counterparties enable scalable custody, NAV, trading and best-execution for Jupiter (c.£50bn AUM in 2024), supported by custodians holding >$100tn (2024). Third-party research, data and analytics (alt-data market ~$6.7bn in 2024) supplement internal insights. IFAs/platforms (UK platforms c.£1.1tn retail assets in 2024) drive distribution and retention.
| Partner | Role | 2024 metric |
|---|---|---|
| Custodians | Safekeeping/NAV | >$100tn AUM |
| Execution | Trading access | Jupiter £50bn AUM |
| Platforms | Distribution | £1.1tn UK retail |
What is included in the product
 Detailed Word Document
A ready-to-use Business Model Canvas for Jupiter Fund Management detailing customer segments, channels, value propositions, revenue streams, key activities, partners, resources, cost structure and governance; includes competitive advantages, SWOT-linked insights and investor-ready presentation polish.

 Customizable Excel Spreadsheet
High-level view of Jupiter Fund Management’s business model with editable cells, relieving the pain of fragmented strategy and saving hours by consolidating investment processes, revenue streams, and client propositions into a single, shareable canvas.
Activities

Active portfolio management
Security selection, asset allocation and disciplined risk budgeting drive alpha, with managers typically targeting active share of 60–80% and tracking error of 2–4% to balance conviction and benchmark risk.
Conviction is calibrated against liquidity buffers of 2–5% and drawdown limits, with position sizes adjusted to limit portfolio-level downside.
Derivatives and cash management are used to optimize exposures and implementation costs, often representing up to 20% of notional exposure for hedging and efficient tilts.
Continuous monitoring—daily portfolio reviews and macro/micro signal feeds—ensures positions are adapted as market conditions change.
Investment research and idea generation
In 2024 Jupiter blends bottom-up fundamental work with top-down macro views to align stock selection with thematic and risk frameworks. Regular company engagements and site visits deepen conviction and support stewardship and active ownership. Quantitative screens and alternative data sources augment traditional analysis to surface mispricings and validate signals. Investment committees vet ideas to ensure consistency, risk controls and documented process adherence.

Distribution, marketing, and consultant relations
Institutional RFPs, databases and targeted consultant outreach drive Jupiter’s pipeline, supporting its >£50bn AUM (2024) institutional franchise; consultants influence over 50% of institutional allocations, making outreach high-impact. Sales enablement translates strategy edges into measurable outcomes for RFPs and pitches. Thought leadership and events—generating ~30% of institutional leads—position the brand with gatekeepers, while tight feedback loops refine product-market fit and pricing.

Client reporting, performance, and risk oversight
Timely factsheets, clear attribution, and open transparency sustain client trust and retention by evidencing performance and fees; bespoke reports address institutional mandates and regulatory requirements. Independent risk teams challenge portfolio assumptions, monitor limits, and escalate breaches, while structured post-mortems convert outcomes into repeatable process improvements.
- Timely factsheets
- Attribution & transparency
- Custom institutional reporting
- Independent risk oversight
- Post-mortem learning
Product development and governance
Product design covers UCITS, AIFs, SMAs and model portfolios with pricing, liquidity terms and benchmarks tailored to client use cases; Jupiter managed circa £50bn AUM in 2024 supporting scale and capacity planning. Cross-functional committees govern product lifecycles, capacity and closures, while ESG integration and labeling follow evolving EU/UK standards and SFDR alignment.
- Scope: UCITS/AIF/SMA/models
- Scale: circa £50bn AUM (2024)
- Governance: lifecycle, capacity, closures
- ESG: SFDR/UK-aligned labeling
Alpha via selection; active share 60-80%, TE 2-4%
Security selection, allocation and disciplined risk budgeting (active share 60–80%, TE 2–4%) drive alpha; derivatives and cash (up to 20% notional) manage exposure and costs. Daily monitoring, independent risk oversight and post-mortems enforce limits and learning. Institutional distribution (>£50bn AUM 2024; consultants >50% influence; events ≈30% leads) fuels mandates.
| Metric | Value |
|---|---|
| AUM (2024) | circa £50bn |
| Active share | 60–80% |
| Tracking error | 2–4% |
| Derivatives notional | up to 20% |
| Events leads | ≈30% |
| Consultant influence | >50% |
Delivered as Displayed
Business Model Canvas
The document you're previewing is the actual Jupiter Fund Management Business Model Canvas you'll receive after purchase. It's not a mockup—this is the same fully structured, editable file formatted for immediate use. Upon completing your order you'll download the complete Word and Excel deliverables exactly as shown, ready to present, edit, and share.

Fund Manager Business Model Canvas — concise strategic blueprint for investors
Unlock Jupiter Fund Management’s strategic playbook with our concise Business Model Canvas—three to five sentences here sketch the value propositions, customer segments, and growth levers that underpin its market position. Dive into revenue streams, partnerships, and cost structure mapped for quick insight. Purchase the full Canvas to get an editable, section-by-section blueprint ready for analysis, benchmarking, or investor decks.
Partnerships
Global custodians and fund administrators
Global custodians and fund administrators safeguard client assets, process fund accounting and support NAV calculation across domiciles, with SLAs that target accuracy and same-day timeliness to meet regulatory requirements. Top custodians held over $100 trillion in assets as of 2024, enabling scalable operations as AUM and product complexity grow. Collaborative oversight between Jupiter and these partners reduces operational risk and enhances investor confidence.
Broker-dealers and liquidity providers
Execution quality directly impacts portfolio outcomes and trading costs for Jupiter, which manages circa £50bn AUM (2024). Relationships span equities, fixed income, FX and derivatives to support multi-asset mandates. Access to deep liquidity in volatile markets enables timely active positioning. Best-execution monitoring and client-specific CSA arrangements improve transparency and research access.
Research, data, and analytics vendors
Third-party research complements Jupiter’s internal sector, credit, and macro insights, supplying roughly 30% of external idea flow while broadening coverage. Data feeds, ESG ratings and alternative datasets—with the alternative data market valued at about $6.7bn in 2024—enhance idea generation and cross-asset signals. Risk and analytics tools enable factor, scenario and attribution analysis across portfolios. Vendor partnerships accelerate innovation and clarify build-versus-buy trade-offs.
Distribution platforms and financial intermediaries
Ties with IFAs, wealth managers and platforms expand Jupiter’s reach into UK retail and adviser channels; platform listings and model-portfolio placements boost visibility as platforms held c.£1.1tn of UK retail fund assets in 2024 (≈70% share). Joint marketing, due diligence and training improve product fit and uptake, while fee-sharing and compliant distribution agreements align incentives and retention.
- IFA & wealth-manager access
- Platform listings & model portfolios
- Joint marketing, due diligence, training
- Fee-sharing & compliant agreements
Regulatory, legal, and audit partners
Specialist counsel and Big Four auditors secure Jupiter Fund Management’s governance and disclosures, ensuring compliance with UCITS V (2014), AIFMD (2011) and MiFID II (2018).
Support covers cross-border regimes and independent assurance that underpins trust with institutional and retail clients.
Ongoing horizon scanning and regulatory intelligence pre-empt rule changes and adapt internal controls.
- Specialist counsel; Big Four auditors
- UCITS V (2014), AIFMD (2011), MiFID II (2018)
- Independent assurance → client trust
- Horizon scanning → proactive controls
Custodians >$100tn, fund £50bn and platforms £1.1tn power scalable custody
Global custodians, fund administrators and execution counterparties enable scalable custody, NAV, trading and best-execution for Jupiter (c.£50bn AUM in 2024), supported by custodians holding >$100tn (2024). Third-party research, data and analytics (alt-data market ~$6.7bn in 2024) supplement internal insights. IFAs/platforms (UK platforms c.£1.1tn retail assets in 2024) drive distribution and retention.
| Partner | Role | 2024 metric |
|---|---|---|
| Custodians | Safekeeping/NAV | >$100tn AUM |
| Execution | Trading access | Jupiter £50bn AUM |
| Platforms | Distribution | £1.1tn UK retail |
What is included in the product
Detailed Word Document
A ready-to-use Business Model Canvas for Jupiter Fund Management detailing customer segments, channels, value propositions, revenue streams, key activities, partners, resources, cost structure and governance; includes competitive advantages, SWOT-linked insights and investor-ready presentation polish.
Customizable Excel Spreadsheet
High-level view of Jupiter Fund Management’s business model with editable cells, relieving the pain of fragmented strategy and saving hours by consolidating investment processes, revenue streams, and client propositions into a single, shareable canvas.
Activities
Active portfolio management
Security selection, asset allocation and disciplined risk budgeting drive alpha, with managers typically targeting active share of 60–80% and tracking error of 2–4% to balance conviction and benchmark risk.
Conviction is calibrated against liquidity buffers of 2–5% and drawdown limits, with position sizes adjusted to limit portfolio-level downside.
Derivatives and cash management are used to optimize exposures and implementation costs, often representing up to 20% of notional exposure for hedging and efficient tilts.
Continuous monitoring—daily portfolio reviews and macro/micro signal feeds—ensures positions are adapted as market conditions change.
Investment research and idea generation
In 2024 Jupiter blends bottom-up fundamental work with top-down macro views to align stock selection with thematic and risk frameworks. Regular company engagements and site visits deepen conviction and support stewardship and active ownership. Quantitative screens and alternative data sources augment traditional analysis to surface mispricings and validate signals. Investment committees vet ideas to ensure consistency, risk controls and documented process adherence.
Distribution, marketing, and consultant relations
Institutional RFPs, databases and targeted consultant outreach drive Jupiter’s pipeline, supporting its >£50bn AUM (2024) institutional franchise; consultants influence over 50% of institutional allocations, making outreach high-impact. Sales enablement translates strategy edges into measurable outcomes for RFPs and pitches. Thought leadership and events—generating ~30% of institutional leads—position the brand with gatekeepers, while tight feedback loops refine product-market fit and pricing.
Client reporting, performance, and risk oversight
Timely factsheets, clear attribution, and open transparency sustain client trust and retention by evidencing performance and fees; bespoke reports address institutional mandates and regulatory requirements. Independent risk teams challenge portfolio assumptions, monitor limits, and escalate breaches, while structured post-mortems convert outcomes into repeatable process improvements.
- Timely factsheets
- Attribution & transparency
- Custom institutional reporting
- Independent risk oversight
- Post-mortem learning
Product development and governance
Product design covers UCITS, AIFs, SMAs and model portfolios with pricing, liquidity terms and benchmarks tailored to client use cases; Jupiter managed circa £50bn AUM in 2024 supporting scale and capacity planning. Cross-functional committees govern product lifecycles, capacity and closures, while ESG integration and labeling follow evolving EU/UK standards and SFDR alignment.
- Scope: UCITS/AIF/SMA/models
- Scale: circa £50bn AUM (2024)
- Governance: lifecycle, capacity, closures
- ESG: SFDR/UK-aligned labeling
Alpha via selection; active share 60-80%, TE 2-4%
Security selection, allocation and disciplined risk budgeting (active share 60–80%, TE 2–4%) drive alpha; derivatives and cash (up to 20% notional) manage exposure and costs. Daily monitoring, independent risk oversight and post-mortems enforce limits and learning. Institutional distribution (>£50bn AUM 2024; consultants >50% influence; events ≈30% leads) fuels mandates.
| Metric | Value |
|---|---|
| AUM (2024) | circa £50bn |
| Active share | 60–80% |
| Tracking error | 2–4% |
| Derivatives notional | up to 20% |
| Events leads | ≈30% |
| Consultant influence | >50% |
Delivered as Displayed
Business Model Canvas
The document you're previewing is the actual Jupiter Fund Management Business Model Canvas you'll receive after purchase. It's not a mockup—this is the same fully structured, editable file formatted for immediate use. Upon completing your order you'll download the complete Word and Excel deliverables exactly as shown, ready to present, edit, and share.
Original: $10.00
-65%$10.00
$3.50Description
Fund Manager Business Model Canvas — concise strategic blueprint for investors
Unlock Jupiter Fund Management’s strategic playbook with our concise Business Model Canvas—three to five sentences here sketch the value propositions, customer segments, and growth levers that underpin its market position. Dive into revenue streams, partnerships, and cost structure mapped for quick insight. Purchase the full Canvas to get an editable, section-by-section blueprint ready for analysis, benchmarking, or investor decks.
Partnerships
Global custodians and fund administrators
Global custodians and fund administrators safeguard client assets, process fund accounting and support NAV calculation across domiciles, with SLAs that target accuracy and same-day timeliness to meet regulatory requirements. Top custodians held over $100 trillion in assets as of 2024, enabling scalable operations as AUM and product complexity grow. Collaborative oversight between Jupiter and these partners reduces operational risk and enhances investor confidence.
Broker-dealers and liquidity providers
Execution quality directly impacts portfolio outcomes and trading costs for Jupiter, which manages circa £50bn AUM (2024). Relationships span equities, fixed income, FX and derivatives to support multi-asset mandates. Access to deep liquidity in volatile markets enables timely active positioning. Best-execution monitoring and client-specific CSA arrangements improve transparency and research access.
Research, data, and analytics vendors
Third-party research complements Jupiter’s internal sector, credit, and macro insights, supplying roughly 30% of external idea flow while broadening coverage. Data feeds, ESG ratings and alternative datasets—with the alternative data market valued at about $6.7bn in 2024—enhance idea generation and cross-asset signals. Risk and analytics tools enable factor, scenario and attribution analysis across portfolios. Vendor partnerships accelerate innovation and clarify build-versus-buy trade-offs.
Distribution platforms and financial intermediaries
Ties with IFAs, wealth managers and platforms expand Jupiter’s reach into UK retail and adviser channels; platform listings and model-portfolio placements boost visibility as platforms held c.£1.1tn of UK retail fund assets in 2024 (≈70% share). Joint marketing, due diligence and training improve product fit and uptake, while fee-sharing and compliant distribution agreements align incentives and retention.
- IFA & wealth-manager access
- Platform listings & model portfolios
- Joint marketing, due diligence, training
- Fee-sharing & compliant agreements
Regulatory, legal, and audit partners
Specialist counsel and Big Four auditors secure Jupiter Fund Management’s governance and disclosures, ensuring compliance with UCITS V (2014), AIFMD (2011) and MiFID II (2018).
Support covers cross-border regimes and independent assurance that underpins trust with institutional and retail clients.
Ongoing horizon scanning and regulatory intelligence pre-empt rule changes and adapt internal controls.
- Specialist counsel; Big Four auditors
- UCITS V (2014), AIFMD (2011), MiFID II (2018)
- Independent assurance → client trust
- Horizon scanning → proactive controls
Custodians >$100tn, fund £50bn and platforms £1.1tn power scalable custody
Global custodians, fund administrators and execution counterparties enable scalable custody, NAV, trading and best-execution for Jupiter (c.£50bn AUM in 2024), supported by custodians holding >$100tn (2024). Third-party research, data and analytics (alt-data market ~$6.7bn in 2024) supplement internal insights. IFAs/platforms (UK platforms c.£1.1tn retail assets in 2024) drive distribution and retention.
| Partner | Role | 2024 metric |
|---|---|---|
| Custodians | Safekeeping/NAV | >$100tn AUM |
| Execution | Trading access | Jupiter £50bn AUM |
| Platforms | Distribution | £1.1tn UK retail |
What is included in the product
Detailed Word Document
A ready-to-use Business Model Canvas for Jupiter Fund Management detailing customer segments, channels, value propositions, revenue streams, key activities, partners, resources, cost structure and governance; includes competitive advantages, SWOT-linked insights and investor-ready presentation polish.
Customizable Excel Spreadsheet
High-level view of Jupiter Fund Management’s business model with editable cells, relieving the pain of fragmented strategy and saving hours by consolidating investment processes, revenue streams, and client propositions into a single, shareable canvas.
Activities
Active portfolio management
Security selection, asset allocation and disciplined risk budgeting drive alpha, with managers typically targeting active share of 60–80% and tracking error of 2–4% to balance conviction and benchmark risk.
Conviction is calibrated against liquidity buffers of 2–5% and drawdown limits, with position sizes adjusted to limit portfolio-level downside.
Derivatives and cash management are used to optimize exposures and implementation costs, often representing up to 20% of notional exposure for hedging and efficient tilts.
Continuous monitoring—daily portfolio reviews and macro/micro signal feeds—ensures positions are adapted as market conditions change.
Investment research and idea generation
In 2024 Jupiter blends bottom-up fundamental work with top-down macro views to align stock selection with thematic and risk frameworks. Regular company engagements and site visits deepen conviction and support stewardship and active ownership. Quantitative screens and alternative data sources augment traditional analysis to surface mispricings and validate signals. Investment committees vet ideas to ensure consistency, risk controls and documented process adherence.
Distribution, marketing, and consultant relations
Institutional RFPs, databases and targeted consultant outreach drive Jupiter’s pipeline, supporting its >£50bn AUM (2024) institutional franchise; consultants influence over 50% of institutional allocations, making outreach high-impact. Sales enablement translates strategy edges into measurable outcomes for RFPs and pitches. Thought leadership and events—generating ~30% of institutional leads—position the brand with gatekeepers, while tight feedback loops refine product-market fit and pricing.
Client reporting, performance, and risk oversight
Timely factsheets, clear attribution, and open transparency sustain client trust and retention by evidencing performance and fees; bespoke reports address institutional mandates and regulatory requirements. Independent risk teams challenge portfolio assumptions, monitor limits, and escalate breaches, while structured post-mortems convert outcomes into repeatable process improvements.
- Timely factsheets
- Attribution & transparency
- Custom institutional reporting
- Independent risk oversight
- Post-mortem learning
Product development and governance
Product design covers UCITS, AIFs, SMAs and model portfolios with pricing, liquidity terms and benchmarks tailored to client use cases; Jupiter managed circa £50bn AUM in 2024 supporting scale and capacity planning. Cross-functional committees govern product lifecycles, capacity and closures, while ESG integration and labeling follow evolving EU/UK standards and SFDR alignment.
- Scope: UCITS/AIF/SMA/models
- Scale: circa £50bn AUM (2024)
- Governance: lifecycle, capacity, closures
- ESG: SFDR/UK-aligned labeling
Alpha via selection; active share 60-80%, TE 2-4%
Security selection, allocation and disciplined risk budgeting (active share 60–80%, TE 2–4%) drive alpha; derivatives and cash (up to 20% notional) manage exposure and costs. Daily monitoring, independent risk oversight and post-mortems enforce limits and learning. Institutional distribution (>£50bn AUM 2024; consultants >50% influence; events ≈30% leads) fuels mandates.
| Metric | Value |
|---|---|
| AUM (2024) | circa £50bn |
| Active share | 60–80% |
| Tracking error | 2–4% |
| Derivatives notional | up to 20% |
| Events leads | ≈30% |
| Consultant influence | >50% |
Delivered as Displayed
Business Model Canvas
The document you're previewing is the actual Jupiter Fund Management Business Model Canvas you'll receive after purchase. It's not a mockup—this is the same fully structured, editable file formatted for immediate use. Upon completing your order you'll download the complete Word and Excel deliverables exactly as shown, ready to present, edit, and share.











