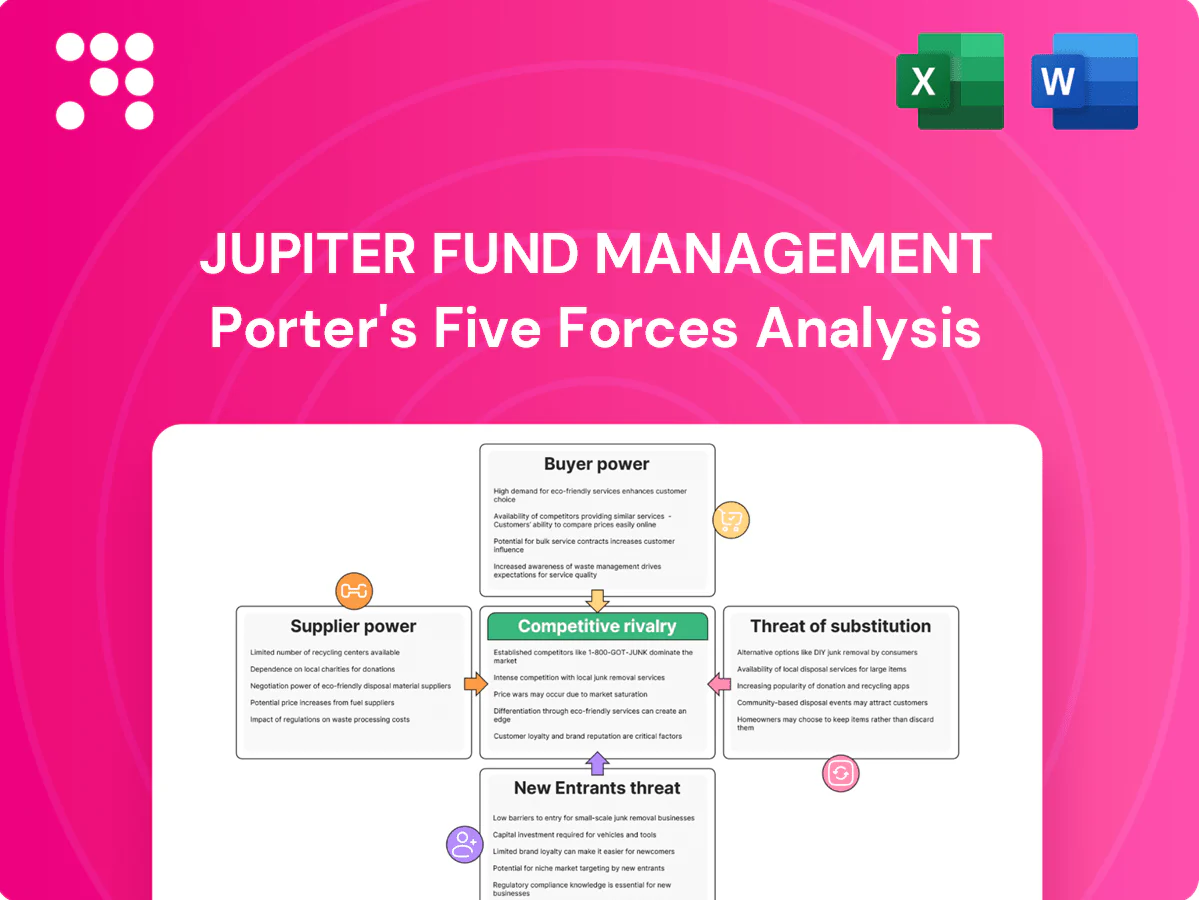
Jupiter Fund Management Porter's Five Forces Analysis

Elevate Your Analysis with the Complete Porter's Five Forces Analysis
Jupiter Fund Management faces moderate buyer power, concentrated distributor channels and high regulatory barriers that limit new entrants, while scale and brand reduce substitute threats—yet fee pressure and digital platforms intensify competitive dynamics. This brief snapshot only scratches the surface. Unlock the full Porter's Five Forces Analysis to explore Jupiter Fund Management’s competitive dynamics, market pressures, and strategic advantages in detail.
Suppliers Bargaining Power

Star talent and PMs hold leverage
Experienced portfolio managers and analysts are scarce and mobile, giving them leverage over pay and resources; their exits have historically driven meaningful asset outflows and performance drift at Jupiter. The firm must offer competitive compensation, autonomy and culture to retain key teams. Non-competes and team-based processes mitigate but cannot eliminate this supplier power.
Data, benchmarks, and analytics vendors
Essential providers—Bloomberg (≈325,000 terminals in 2023) and a handful of index licensors and ESG analytics firms—operate concentrated markets with sticky, multi‑year contracts that can compress margins. Licensing fees and restrictive terms have risen, forcing multi‑sourcing and tougher negotiations, but switching costs and integration complexity remain significant. Vendor outages or methodology changes can materially disrupt investment and reporting workflows.

Custodians, administrators, and platforms
Fund administration, custody and transfer agency are concentrated among a few global players (eg BNY Mellon, State Street, Northern Trust, SS&C/BNY/others), so procurement remains competitive but supplier concentration gives influence. Operational risk and migration costs—often exceeding $10m and taking 12–18 months—raise switching barriers. Heightened service-level and regulatory reporting demands (eg CSDR, SFDR updates in 2024) increase dependency. Long-term contracts lower short-term price pressure but create lock-in.

Execution brokers and liquidity providers
Execution across equities and fixed income depends on broker networks and market makers for liquidity and research access; MiFID II unbundling (effective 2018) reduced bundled research pricing power but high-quality niche coverage remains scarce. In stressed markets liquidity providers widen spreads and can prioritize flow, while algorithmic and multi-broker routing mitigate but do not remove dependence.
- MiFID II: unbundling since 2018
- Stressed markets: wider spreads, flow prioritization
- Alg routing: reduces but not eliminates broker reliance
Technology infrastructure and cloud
Portfolio systems, risk engines and cloud hosting underpin Jupiter's operations and regulatory compliance, with leading cloud vendors holding ~33% (AWS), ~23% (Azure) and ~11% (GCP) market share in 2024.
A small number of dominant cloud and software vendors limit bargaining flexibility, and bespoke integrations increase vendor lock‑in.
Cybersecurity needs raise switching costs—average breach cost in 2024 was $4.45M—so strategic partnerships and modular architectures are used to rebalance power.
- Vendor concentration: top 3 ≈67%
- Switching costs: high due to custom integrations
- Risk cost: $4.45M average breach 2024
Concentrated vendors raise fees and lock-in; migration costs often exceed $10M
Suppliers hold meaningful leverage: scarce portfolio talent causes retention-driven outflows; key vendors (Bloomberg ≈325,000 terminals 2023) and cloud providers (AWS 33% Azure 23% GCP 11% 2024) are concentrated, raising fees and lock‑in. Fund admin and brokers exert influence via high migration costs (> $10m, 12–18 months) and stressed-market liquidity risk; avg breach cost 2024 $4.45M.
| Supplier | Metric | Value |
|---|---|---|
| Bloomberg | Terminals (2023) | ≈325,000 |
| Cloud | Market share (2024) | AWS 33% / Azure 23% / GCP 11% |
| Migration | Cost / duration | > $10m / 12–18m |
| Cyber | Avg breach cost (2024) | $4.45M |
What is included in the product
 Detailed Word Document
Tailored Porter's Five Forces analysis for Jupiter Fund Management highlighting competitive intensity, buyer/supplier bargaining power, threat of new entrants and substitutes, and regulatory/innovation-driven disruptors shaping its profitability.

 Customizable Excel Spreadsheet
One-sheet Porter's Five Forces for Jupiter Fund Management—condenses competitive pressure into an executive-ready summary for faster investment decisions. Customize force levels, swap in your data, and drop the chart into decks or dashboards without macros for instant strategic clarity.
Customers Bargaining Power

Institutional clients demand fees down
Institutional clients such as pension funds, insurers and endowments run structured RFPs and negotiate aggressively on fees and mandates, often demanding separate-account customization and tighter oversight. They can reallocate rapidly after performance shortfalls, raising retention risk for managers. Rising passive penetration—about 51% of US mutual fund and ETF assets in 2024—sustains sustained fee compression on active strategies.
Platforms and IFAs aggregate flow
Platforms and IFAs control c.£1.2tn of UK retail AUA in 2024, so shelf-space decisions and due diligence materially shape fund accessibility and pricing for Jupiter. Volume-based rebates and platform fees commonly compress net margins by tens of basis points. Maintaining distribution relationships is critical to secure net inflows.

Performance-sensitive retail investors
Performance-sensitive retail investors exert strong bargaining power over Jupiter: clients are brand- and return-driven with low switching costs on open-architecture platforms, so Morningstar ratings and league-table positions rapidly amplify inflows and outflows; industry patterns in 2024 show top-quartile funds capturing disproportionate net flows while underperformers face swift redemption waves. Clear communication and robust risk management can damp churn, but sustained underperformance triggers rapid redemptions.

Demand for ESG and transparency
Clients increasingly demand credible ESG integration, impact reporting and stewardship proof points, with global sustainable assets at about $35.3 trillion (GSIA 2023) underscoring scale and scrutiny in 2024.
Data-backed transparency on holdings, climate and transition risks, and all-in fees is now standard; failure to evidence outcomes has led to mandate losses across institutional panels.
This specificity elevates buyer power as mandates are awarded only to managers meeting precise ESG and reporting KPIs.
- ESG scale: $35.3 trillion (GSIA 2023)
- Requirements: impact reporting, stewardship proof, holdings transparency
- Consequence: mandate loss if outcomes not evidenced
- Buyer power: increased via prescriptive KPIs
Preference for outcome-oriented products
Buyers increasingly demand income, capital preservation and inflation hedging over pure asset-class exposure, pushing Jupiter into negotiations for tailored benchmarks and fee-for-outcome structures; a 2024 industry survey found 58% of institutional clients prefer outcome-based mandates.
Providers must co-design mandates, accept tighter KPIs and offer bespoke reporting, which increases implementation complexity and operational cost for Jupiter while strengthening client leverage.
- Outcome-first demand: 58% (2024 survey)
- Negotiation shift: tailored benchmarks, fee-for-outcome
- Provider response: co-designed mandates, tighter KPIs
- Effect: greater client bargaining power
Passive ~51% and $35.3tn sustainable AUM raise ESG mandates; 58% prefer outcomes
Institutional and retail clients exert high bargaining power through fee pressure, rapid reallocation after underperformance and platform shelf control (passive penetration ~51% US 2024; UK platforms c.£1.2tn AUA 2024). ESG and outcome KPIs raise entry thresholds (GSIA $35.3tn 2023; 58% outcome-preference 2024), forcing bespoke mandates and tighter reporting that compress margins and raise operational costs.
| Metric | Value |
|---|---|
| US passive penetration (2024) | ~51% |
| UK platform AUA (2024) | c.£1.2tn |
| Global sustainable AUM (GSIA 2023) | $35.3tn |
| Institutions preferring outcome mandates (2024) | 58% |
Same Document Delivered
Jupiter Fund Management Porter's Five Forces Analysis
This Jupiter Fund Management Porter’s Five Forces Analysis preview is the exact, fully formatted document you’ll receive upon purchase—no placeholders or mockups. It contains the complete strategic assessment and supporting insights, ready for immediate download and use. Purchase grants instant access to this same file.

Elevate Your Analysis with the Complete Porter's Five Forces Analysis
Jupiter Fund Management faces moderate buyer power, concentrated distributor channels and high regulatory barriers that limit new entrants, while scale and brand reduce substitute threats—yet fee pressure and digital platforms intensify competitive dynamics. This brief snapshot only scratches the surface. Unlock the full Porter's Five Forces Analysis to explore Jupiter Fund Management’s competitive dynamics, market pressures, and strategic advantages in detail.
Suppliers Bargaining Power
Star talent and PMs hold leverage
Experienced portfolio managers and analysts are scarce and mobile, giving them leverage over pay and resources; their exits have historically driven meaningful asset outflows and performance drift at Jupiter. The firm must offer competitive compensation, autonomy and culture to retain key teams. Non-competes and team-based processes mitigate but cannot eliminate this supplier power.
Data, benchmarks, and analytics vendors
Essential providers—Bloomberg (≈325,000 terminals in 2023) and a handful of index licensors and ESG analytics firms—operate concentrated markets with sticky, multi‑year contracts that can compress margins. Licensing fees and restrictive terms have risen, forcing multi‑sourcing and tougher negotiations, but switching costs and integration complexity remain significant. Vendor outages or methodology changes can materially disrupt investment and reporting workflows.
Custodians, administrators, and platforms
Fund administration, custody and transfer agency are concentrated among a few global players (eg BNY Mellon, State Street, Northern Trust, SS&C/BNY/others), so procurement remains competitive but supplier concentration gives influence. Operational risk and migration costs—often exceeding $10m and taking 12–18 months—raise switching barriers. Heightened service-level and regulatory reporting demands (eg CSDR, SFDR updates in 2024) increase dependency. Long-term contracts lower short-term price pressure but create lock-in.
Execution brokers and liquidity providers
Execution across equities and fixed income depends on broker networks and market makers for liquidity and research access; MiFID II unbundling (effective 2018) reduced bundled research pricing power but high-quality niche coverage remains scarce. In stressed markets liquidity providers widen spreads and can prioritize flow, while algorithmic and multi-broker routing mitigate but do not remove dependence.
- MiFID II: unbundling since 2018
- Stressed markets: wider spreads, flow prioritization
- Alg routing: reduces but not eliminates broker reliance
Technology infrastructure and cloud
Portfolio systems, risk engines and cloud hosting underpin Jupiter's operations and regulatory compliance, with leading cloud vendors holding ~33% (AWS), ~23% (Azure) and ~11% (GCP) market share in 2024.
A small number of dominant cloud and software vendors limit bargaining flexibility, and bespoke integrations increase vendor lock‑in.
Cybersecurity needs raise switching costs—average breach cost in 2024 was $4.45M—so strategic partnerships and modular architectures are used to rebalance power.
- Vendor concentration: top 3 ≈67%
- Switching costs: high due to custom integrations
- Risk cost: $4.45M average breach 2024
Concentrated vendors raise fees and lock-in; migration costs often exceed $10M
Suppliers hold meaningful leverage: scarce portfolio talent causes retention-driven outflows; key vendors (Bloomberg ≈325,000 terminals 2023) and cloud providers (AWS 33% Azure 23% GCP 11% 2024) are concentrated, raising fees and lock‑in. Fund admin and brokers exert influence via high migration costs (> $10m, 12–18 months) and stressed-market liquidity risk; avg breach cost 2024 $4.45M.
| Supplier | Metric | Value |
|---|---|---|
| Bloomberg | Terminals (2023) | ≈325,000 |
| Cloud | Market share (2024) | AWS 33% / Azure 23% / GCP 11% |
| Migration | Cost / duration | > $10m / 12–18m |
| Cyber | Avg breach cost (2024) | $4.45M |
What is included in the product
Detailed Word Document
Tailored Porter's Five Forces analysis for Jupiter Fund Management highlighting competitive intensity, buyer/supplier bargaining power, threat of new entrants and substitutes, and regulatory/innovation-driven disruptors shaping its profitability.
Customizable Excel Spreadsheet
One-sheet Porter's Five Forces for Jupiter Fund Management—condenses competitive pressure into an executive-ready summary for faster investment decisions. Customize force levels, swap in your data, and drop the chart into decks or dashboards without macros for instant strategic clarity.
Customers Bargaining Power
Institutional clients demand fees down
Institutional clients such as pension funds, insurers and endowments run structured RFPs and negotiate aggressively on fees and mandates, often demanding separate-account customization and tighter oversight. They can reallocate rapidly after performance shortfalls, raising retention risk for managers. Rising passive penetration—about 51% of US mutual fund and ETF assets in 2024—sustains sustained fee compression on active strategies.
Platforms and IFAs aggregate flow
Platforms and IFAs control c.£1.2tn of UK retail AUA in 2024, so shelf-space decisions and due diligence materially shape fund accessibility and pricing for Jupiter. Volume-based rebates and platform fees commonly compress net margins by tens of basis points. Maintaining distribution relationships is critical to secure net inflows.
Performance-sensitive retail investors
Performance-sensitive retail investors exert strong bargaining power over Jupiter: clients are brand- and return-driven with low switching costs on open-architecture platforms, so Morningstar ratings and league-table positions rapidly amplify inflows and outflows; industry patterns in 2024 show top-quartile funds capturing disproportionate net flows while underperformers face swift redemption waves. Clear communication and robust risk management can damp churn, but sustained underperformance triggers rapid redemptions.
Demand for ESG and transparency
Clients increasingly demand credible ESG integration, impact reporting and stewardship proof points, with global sustainable assets at about $35.3 trillion (GSIA 2023) underscoring scale and scrutiny in 2024.
Data-backed transparency on holdings, climate and transition risks, and all-in fees is now standard; failure to evidence outcomes has led to mandate losses across institutional panels.
This specificity elevates buyer power as mandates are awarded only to managers meeting precise ESG and reporting KPIs.
- ESG scale: $35.3 trillion (GSIA 2023)
- Requirements: impact reporting, stewardship proof, holdings transparency
- Consequence: mandate loss if outcomes not evidenced
- Buyer power: increased via prescriptive KPIs
Preference for outcome-oriented products
Buyers increasingly demand income, capital preservation and inflation hedging over pure asset-class exposure, pushing Jupiter into negotiations for tailored benchmarks and fee-for-outcome structures; a 2024 industry survey found 58% of institutional clients prefer outcome-based mandates.
Providers must co-design mandates, accept tighter KPIs and offer bespoke reporting, which increases implementation complexity and operational cost for Jupiter while strengthening client leverage.
- Outcome-first demand: 58% (2024 survey)
- Negotiation shift: tailored benchmarks, fee-for-outcome
- Provider response: co-designed mandates, tighter KPIs
- Effect: greater client bargaining power
Passive ~51% and $35.3tn sustainable AUM raise ESG mandates; 58% prefer outcomes
Institutional and retail clients exert high bargaining power through fee pressure, rapid reallocation after underperformance and platform shelf control (passive penetration ~51% US 2024; UK platforms c.£1.2tn AUA 2024). ESG and outcome KPIs raise entry thresholds (GSIA $35.3tn 2023; 58% outcome-preference 2024), forcing bespoke mandates and tighter reporting that compress margins and raise operational costs.
| Metric | Value |
|---|---|
| US passive penetration (2024) | ~51% |
| UK platform AUA (2024) | c.£1.2tn |
| Global sustainable AUM (GSIA 2023) | $35.3tn |
| Institutions preferring outcome mandates (2024) | 58% |
Same Document Delivered
Jupiter Fund Management Porter's Five Forces Analysis
This Jupiter Fund Management Porter’s Five Forces Analysis preview is the exact, fully formatted document you’ll receive upon purchase—no placeholders or mockups. It contains the complete strategic assessment and supporting insights, ready for immediate download and use. Purchase grants instant access to this same file.
Original: $10.00
-65%$10.00
$3.50Description
Elevate Your Analysis with the Complete Porter's Five Forces Analysis
Jupiter Fund Management faces moderate buyer power, concentrated distributor channels and high regulatory barriers that limit new entrants, while scale and brand reduce substitute threats—yet fee pressure and digital platforms intensify competitive dynamics. This brief snapshot only scratches the surface. Unlock the full Porter's Five Forces Analysis to explore Jupiter Fund Management’s competitive dynamics, market pressures, and strategic advantages in detail.
Suppliers Bargaining Power
Star talent and PMs hold leverage
Experienced portfolio managers and analysts are scarce and mobile, giving them leverage over pay and resources; their exits have historically driven meaningful asset outflows and performance drift at Jupiter. The firm must offer competitive compensation, autonomy and culture to retain key teams. Non-competes and team-based processes mitigate but cannot eliminate this supplier power.
Data, benchmarks, and analytics vendors
Essential providers—Bloomberg (≈325,000 terminals in 2023) and a handful of index licensors and ESG analytics firms—operate concentrated markets with sticky, multi‑year contracts that can compress margins. Licensing fees and restrictive terms have risen, forcing multi‑sourcing and tougher negotiations, but switching costs and integration complexity remain significant. Vendor outages or methodology changes can materially disrupt investment and reporting workflows.
Custodians, administrators, and platforms
Fund administration, custody and transfer agency are concentrated among a few global players (eg BNY Mellon, State Street, Northern Trust, SS&C/BNY/others), so procurement remains competitive but supplier concentration gives influence. Operational risk and migration costs—often exceeding $10m and taking 12–18 months—raise switching barriers. Heightened service-level and regulatory reporting demands (eg CSDR, SFDR updates in 2024) increase dependency. Long-term contracts lower short-term price pressure but create lock-in.
Execution brokers and liquidity providers
Execution across equities and fixed income depends on broker networks and market makers for liquidity and research access; MiFID II unbundling (effective 2018) reduced bundled research pricing power but high-quality niche coverage remains scarce. In stressed markets liquidity providers widen spreads and can prioritize flow, while algorithmic and multi-broker routing mitigate but do not remove dependence.
- MiFID II: unbundling since 2018
- Stressed markets: wider spreads, flow prioritization
- Alg routing: reduces but not eliminates broker reliance
Technology infrastructure and cloud
Portfolio systems, risk engines and cloud hosting underpin Jupiter's operations and regulatory compliance, with leading cloud vendors holding ~33% (AWS), ~23% (Azure) and ~11% (GCP) market share in 2024.
A small number of dominant cloud and software vendors limit bargaining flexibility, and bespoke integrations increase vendor lock‑in.
Cybersecurity needs raise switching costs—average breach cost in 2024 was $4.45M—so strategic partnerships and modular architectures are used to rebalance power.
- Vendor concentration: top 3 ≈67%
- Switching costs: high due to custom integrations
- Risk cost: $4.45M average breach 2024
Concentrated vendors raise fees and lock-in; migration costs often exceed $10M
Suppliers hold meaningful leverage: scarce portfolio talent causes retention-driven outflows; key vendors (Bloomberg ≈325,000 terminals 2023) and cloud providers (AWS 33% Azure 23% GCP 11% 2024) are concentrated, raising fees and lock‑in. Fund admin and brokers exert influence via high migration costs (> $10m, 12–18 months) and stressed-market liquidity risk; avg breach cost 2024 $4.45M.
| Supplier | Metric | Value |
|---|---|---|
| Bloomberg | Terminals (2023) | ≈325,000 |
| Cloud | Market share (2024) | AWS 33% / Azure 23% / GCP 11% |
| Migration | Cost / duration | > $10m / 12–18m |
| Cyber | Avg breach cost (2024) | $4.45M |
What is included in the product
Detailed Word Document
Tailored Porter's Five Forces analysis for Jupiter Fund Management highlighting competitive intensity, buyer/supplier bargaining power, threat of new entrants and substitutes, and regulatory/innovation-driven disruptors shaping its profitability.
Customizable Excel Spreadsheet
One-sheet Porter's Five Forces for Jupiter Fund Management—condenses competitive pressure into an executive-ready summary for faster investment decisions. Customize force levels, swap in your data, and drop the chart into decks or dashboards without macros for instant strategic clarity.
Customers Bargaining Power
Institutional clients demand fees down
Institutional clients such as pension funds, insurers and endowments run structured RFPs and negotiate aggressively on fees and mandates, often demanding separate-account customization and tighter oversight. They can reallocate rapidly after performance shortfalls, raising retention risk for managers. Rising passive penetration—about 51% of US mutual fund and ETF assets in 2024—sustains sustained fee compression on active strategies.
Platforms and IFAs aggregate flow
Platforms and IFAs control c.£1.2tn of UK retail AUA in 2024, so shelf-space decisions and due diligence materially shape fund accessibility and pricing for Jupiter. Volume-based rebates and platform fees commonly compress net margins by tens of basis points. Maintaining distribution relationships is critical to secure net inflows.
Performance-sensitive retail investors
Performance-sensitive retail investors exert strong bargaining power over Jupiter: clients are brand- and return-driven with low switching costs on open-architecture platforms, so Morningstar ratings and league-table positions rapidly amplify inflows and outflows; industry patterns in 2024 show top-quartile funds capturing disproportionate net flows while underperformers face swift redemption waves. Clear communication and robust risk management can damp churn, but sustained underperformance triggers rapid redemptions.
Demand for ESG and transparency
Clients increasingly demand credible ESG integration, impact reporting and stewardship proof points, with global sustainable assets at about $35.3 trillion (GSIA 2023) underscoring scale and scrutiny in 2024.
Data-backed transparency on holdings, climate and transition risks, and all-in fees is now standard; failure to evidence outcomes has led to mandate losses across institutional panels.
This specificity elevates buyer power as mandates are awarded only to managers meeting precise ESG and reporting KPIs.
- ESG scale: $35.3 trillion (GSIA 2023)
- Requirements: impact reporting, stewardship proof, holdings transparency
- Consequence: mandate loss if outcomes not evidenced
- Buyer power: increased via prescriptive KPIs
Preference for outcome-oriented products
Buyers increasingly demand income, capital preservation and inflation hedging over pure asset-class exposure, pushing Jupiter into negotiations for tailored benchmarks and fee-for-outcome structures; a 2024 industry survey found 58% of institutional clients prefer outcome-based mandates.
Providers must co-design mandates, accept tighter KPIs and offer bespoke reporting, which increases implementation complexity and operational cost for Jupiter while strengthening client leverage.
- Outcome-first demand: 58% (2024 survey)
- Negotiation shift: tailored benchmarks, fee-for-outcome
- Provider response: co-designed mandates, tighter KPIs
- Effect: greater client bargaining power
Passive ~51% and $35.3tn sustainable AUM raise ESG mandates; 58% prefer outcomes
Institutional and retail clients exert high bargaining power through fee pressure, rapid reallocation after underperformance and platform shelf control (passive penetration ~51% US 2024; UK platforms c.£1.2tn AUA 2024). ESG and outcome KPIs raise entry thresholds (GSIA $35.3tn 2023; 58% outcome-preference 2024), forcing bespoke mandates and tighter reporting that compress margins and raise operational costs.
| Metric | Value |
|---|---|
| US passive penetration (2024) | ~51% |
| UK platform AUA (2024) | c.£1.2tn |
| Global sustainable AUM (GSIA 2023) | $35.3tn |
| Institutions preferring outcome mandates (2024) | 58% |
Same Document Delivered
Jupiter Fund Management Porter's Five Forces Analysis
This Jupiter Fund Management Porter’s Five Forces Analysis preview is the exact, fully formatted document you’ll receive upon purchase—no placeholders or mockups. It contains the complete strategic assessment and supporting insights, ready for immediate download and use. Purchase grants instant access to this same file.











