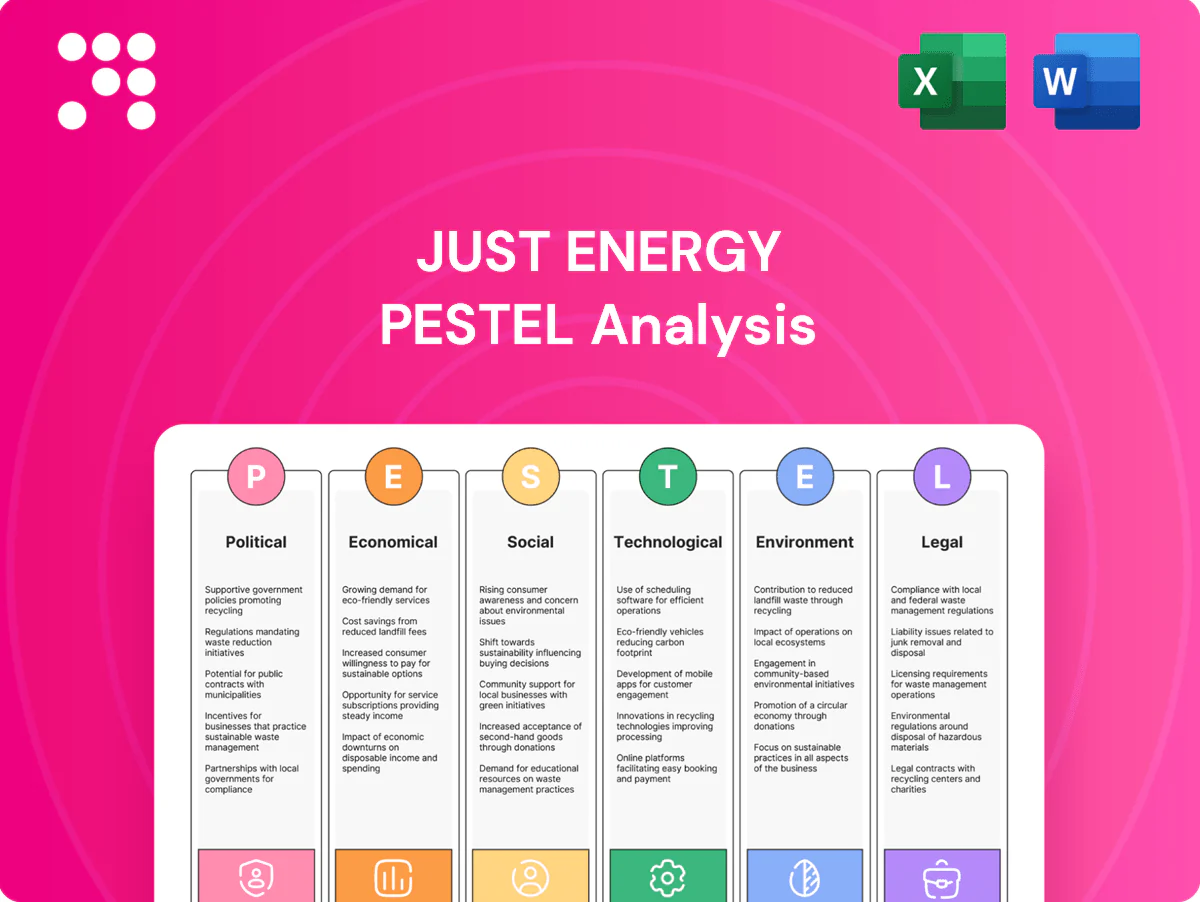
Just Energy PESTLE Analysis

Your Competitive Advantage Starts with This Report
Discover how political shifts, economic pressures, social trends, and technological change are reshaping Just Energy’s strategic landscape in our concise PESTLE snapshot. Gain actionable insights on regulatory risks, market opportunities, and environmental drivers to inform investment and strategy decisions. Buy the full PESTLE report for the complete, ready-to-use analysis and downloadable templates.
Political factors

Deregulation policy stability
Changes to state/provincial deregulation can rapidly expand or shrink Just Energy’s addressable market across over 20 jurisdictions in North America, affecting customer acquisition and book value. Tightened switching rules or stricter price-disclosure mandates can compress margins and require compliance costs; retail sales practices were already under greater scrutiny as renewables reached about 22% of US generation in 2023. Political turnover can swing policy toward or away from retail choice, while active stakeholder lobbying continues to reshape market design and default service structures.
Energy affordability agendas
Governments prioritizing affordability may cap rates or strengthen default supply, squeezing retailer margins and eroding differentiated value propositions. EIA June 2025 shows US average retail electricity near 17 cents/kWh and an average monthly residential bill around $145, making subsidy design consequential. Populist scrutiny of retail markups has spurred regulatory hearings and reforms, while public assistance programs such as LIHEAP typically require retailer participation and compliance.

Cross-border energy relations
US–Canada energy trade policy shapes wholesale and hedging for a bi‑national retailer: Canada exported roughly 6–7 Bcf/d of pipeline gas to the US in 2023–24, tightening or loosening hedging corridors. Transmission and intertie rules influence regional price convergence, with cross‑border electricity and gas flows smoothing local spreads. Political stances on LNG and pipelines (US LNG export capacity ≈13 Bcf/d in 2024) shift basis risk, while tariffs or permitting delays can raise supply costs and margin volatility.

Renewables and green incentives
- IRA tax credits expanded clean credits, boosting green plan demand
- 30+ states RPS ≈60% U.S. load — REC policy shifts impact cost
- Storage incentives lower system costs, reshape tariffs
- Public community solar funding enables partnership models
Municipal aggregation trends
Regulatory shifts reshape market; renewables ~22%, retail ~17¢/kWh
Regulatory shifts in state/provincial deregulation and switching rules can rapidly change Just Energy’s addressable market and compliance costs, with renewables ~22% of US generation in 2023 and IRA-driven green demand rising. Affordability politics and rate caps pressure margins; EIA Jun 2025 US avg retail ≈17¢/kWh, avg bill ≈$145. Cross‑border gas flows (Canada 6–7 Bcf/d to US in 2023–24) and US LNG capacity ≈13 Bcf/d (2024) alter hedging and basis risk.
| Metric | Value |
|---|---|
| US renewables (2023) | ~22% |
| Avg retail price (Jun 2025) | ~17¢/kWh |
| Avg residential bill (Jun 2025) | $145 |
| CCAs customers (2024) | >10M |
| Canada→US gas (2023–24) | 6–7 Bcf/d |
| US LNG capacity (2024) | ~13 Bcf/d |
What is included in the product
 Detailed Word Document
Explores how macro-environmental forces uniquely affect Just Energy across Political, Economic, Social, Technological, Environmental and Legal dimensions, with data-driven examples and trend analysis. Designed for executives and investors to identify regulatory risks, market opportunities and strategic responses.

 Customizable Excel Spreadsheet
A clean, summarized Just Energy PESTLE analysis for quick reference during meetings, visually segmented by category to support discussions on external risks and market positioning and easily dropped into PowerPoints or shared across teams.
Economic factors

Wholesale price volatility
Wholesale power and gas swings drive procurement costs and hedging demand; after 2022 Henry Hub peaks near 9/MMBtu, Henry Hub averaged about 3–4/MMBtu in 2023–24, pressuring suppliers to increase hedge activity. Spikes can erode fixed-price margins when hedges misalign with load, as seen in 2022–23 margin squeezes. Volatility forces higher collateral postings to ISOs and suppliers, raising working capital needs. Stable prices make customer acquisition easier by enabling predictable retail offers.
Interest rates and credit costs
Higher policy rates (Fed funds 5.25–5.50% as of June 2025) lift Just Energy’s working capital and hedging collateral needs, often adding 50–150 bps to funding costs. Higher discount rates compress lifetime value and force tighter contract pricing; IG corporate yields ~4.5–5.5% raise benchmark spreads. Tight credit markets can limit growth or push securitization of receivables. Conversely, falling rates enable refinancing and lower customer bills.

Consumer demand and churn
Macro conditions drive switching and payment performance for Just Energy; US unemployment averaged 3.9% in 2024 (BLS), tightening household budgets and prompting higher churn. Recessions raise price sensitivity and bad-debt risk, pressuring collections. Elevated market competition compresses margins and lifts customer-acquisition costs, while commercial load is cyclical, shifting portfolio mix and revenue seasonally.

FX exposure (CAD/USD)
Operating in both Canada and the US exposes Just Energy to CAD/USD volatility; CAD/USD averaged about 1.34–1.36 across 2024–H1 2025, creating translation and transaction risk on revenues and costs.
Exchange swings directly affect reported earnings and hedge mark-to-market outcomes; procurement and REC purchases settled in USD can compress Canadian margins when the dollar strengthens.
Hedging programs reduce spot exposure but introduce premium costs, collateral needs and hedge accounting complexity that can swing quarterly P&L.
- FX exposure: CAD/USD ~1.34–1.36 (2024–H1 2025)
- Impact: revenue translation and USD-denominated procurement pressure margins
- Mitigation: hedges reduce volatility but add cost and operational complexity
Commodity basis and congestion
Regional gas basis differentials and localized power congestion materially affect delivered costs, with past winter basis spikes exceeding 4/MMBtu in some Northeast hubs and seasonal peaks persisting into 2024. Mismatches between customer load and hedge nodes create basis exposure that can erode margins on fixed-price contracts. Persistent transmission constraints — seen in constrained PJM/NYISO pockets — force node-level pricing strategies and dynamic basis risk management.
- Basis spikes >4/MMBtu in Northeast (historical peak)
- Mismatched load vs hedge nodes = direct exposure
- Transmission constraints shape node pricing
- Active basis risk management essential for fixed-price products
Regulatory shifts reshape market; renewables ~22%, retail ~17¢/kWh
Wholesale gas swings (Henry Hub ~3–4/MMBtu in 2023–24; 2022 peaks near 9/MMBtu) drive procurement, hedging and collateral needs; Fed funds 5.25–5.50% (Jun 2025) raises funding costs and compresses LTV; macro (US unemployment 3.9% in 2024) lifts churn and bad-debt risk; CAD/USD ~1.34–1.36 (2024–H1 2025) creates translation and procurement margin pressure.
| Metric | Value |
|---|---|
| Henry Hub | 3–4/MMBtu (2023–24) |
| Fed funds | 5.25–5.50% (Jun 2025) |
| Unemployment | 3.9% (2024) |
| CAD/USD | 1.34–1.36 (2024–H1 2025) |
Same Document Delivered
Just Energy PESTLE Analysis
The Just Energy PESTLE Analysis provides a concise review of political, economic, social, technological, legal and environmental factors affecting the company, with actionable insights for investors and managers. The preview shown here is the exact document you’ll receive after purchase—fully formatted and ready to use. No placeholders, no teasers.

Your Competitive Advantage Starts with This Report
Discover how political shifts, economic pressures, social trends, and technological change are reshaping Just Energy’s strategic landscape in our concise PESTLE snapshot. Gain actionable insights on regulatory risks, market opportunities, and environmental drivers to inform investment and strategy decisions. Buy the full PESTLE report for the complete, ready-to-use analysis and downloadable templates.
Political factors
Deregulation policy stability
Changes to state/provincial deregulation can rapidly expand or shrink Just Energy’s addressable market across over 20 jurisdictions in North America, affecting customer acquisition and book value. Tightened switching rules or stricter price-disclosure mandates can compress margins and require compliance costs; retail sales practices were already under greater scrutiny as renewables reached about 22% of US generation in 2023. Political turnover can swing policy toward or away from retail choice, while active stakeholder lobbying continues to reshape market design and default service structures.
Energy affordability agendas
Governments prioritizing affordability may cap rates or strengthen default supply, squeezing retailer margins and eroding differentiated value propositions. EIA June 2025 shows US average retail electricity near 17 cents/kWh and an average monthly residential bill around $145, making subsidy design consequential. Populist scrutiny of retail markups has spurred regulatory hearings and reforms, while public assistance programs such as LIHEAP typically require retailer participation and compliance.
Cross-border energy relations
US–Canada energy trade policy shapes wholesale and hedging for a bi‑national retailer: Canada exported roughly 6–7 Bcf/d of pipeline gas to the US in 2023–24, tightening or loosening hedging corridors. Transmission and intertie rules influence regional price convergence, with cross‑border electricity and gas flows smoothing local spreads. Political stances on LNG and pipelines (US LNG export capacity ≈13 Bcf/d in 2024) shift basis risk, while tariffs or permitting delays can raise supply costs and margin volatility.
Renewables and green incentives
- IRA tax credits expanded clean credits, boosting green plan demand
- 30+ states RPS ≈60% U.S. load — REC policy shifts impact cost
- Storage incentives lower system costs, reshape tariffs
- Public community solar funding enables partnership models
Municipal aggregation trends
Regulatory shifts reshape market; renewables ~22%, retail ~17¢/kWh
Regulatory shifts in state/provincial deregulation and switching rules can rapidly change Just Energy’s addressable market and compliance costs, with renewables ~22% of US generation in 2023 and IRA-driven green demand rising. Affordability politics and rate caps pressure margins; EIA Jun 2025 US avg retail ≈17¢/kWh, avg bill ≈$145. Cross‑border gas flows (Canada 6–7 Bcf/d to US in 2023–24) and US LNG capacity ≈13 Bcf/d (2024) alter hedging and basis risk.
| Metric | Value |
|---|---|
| US renewables (2023) | ~22% |
| Avg retail price (Jun 2025) | ~17¢/kWh |
| Avg residential bill (Jun 2025) | $145 |
| CCAs customers (2024) | >10M |
| Canada→US gas (2023–24) | 6–7 Bcf/d |
| US LNG capacity (2024) | ~13 Bcf/d |
What is included in the product
Detailed Word Document
Explores how macro-environmental forces uniquely affect Just Energy across Political, Economic, Social, Technological, Environmental and Legal dimensions, with data-driven examples and trend analysis. Designed for executives and investors to identify regulatory risks, market opportunities and strategic responses.
Customizable Excel Spreadsheet
A clean, summarized Just Energy PESTLE analysis for quick reference during meetings, visually segmented by category to support discussions on external risks and market positioning and easily dropped into PowerPoints or shared across teams.
Economic factors
Wholesale price volatility
Wholesale power and gas swings drive procurement costs and hedging demand; after 2022 Henry Hub peaks near 9/MMBtu, Henry Hub averaged about 3–4/MMBtu in 2023–24, pressuring suppliers to increase hedge activity. Spikes can erode fixed-price margins when hedges misalign with load, as seen in 2022–23 margin squeezes. Volatility forces higher collateral postings to ISOs and suppliers, raising working capital needs. Stable prices make customer acquisition easier by enabling predictable retail offers.
Interest rates and credit costs
Higher policy rates (Fed funds 5.25–5.50% as of June 2025) lift Just Energy’s working capital and hedging collateral needs, often adding 50–150 bps to funding costs. Higher discount rates compress lifetime value and force tighter contract pricing; IG corporate yields ~4.5–5.5% raise benchmark spreads. Tight credit markets can limit growth or push securitization of receivables. Conversely, falling rates enable refinancing and lower customer bills.
Consumer demand and churn
Macro conditions drive switching and payment performance for Just Energy; US unemployment averaged 3.9% in 2024 (BLS), tightening household budgets and prompting higher churn. Recessions raise price sensitivity and bad-debt risk, pressuring collections. Elevated market competition compresses margins and lifts customer-acquisition costs, while commercial load is cyclical, shifting portfolio mix and revenue seasonally.
FX exposure (CAD/USD)
Operating in both Canada and the US exposes Just Energy to CAD/USD volatility; CAD/USD averaged about 1.34–1.36 across 2024–H1 2025, creating translation and transaction risk on revenues and costs.
Exchange swings directly affect reported earnings and hedge mark-to-market outcomes; procurement and REC purchases settled in USD can compress Canadian margins when the dollar strengthens.
Hedging programs reduce spot exposure but introduce premium costs, collateral needs and hedge accounting complexity that can swing quarterly P&L.
- FX exposure: CAD/USD ~1.34–1.36 (2024–H1 2025)
- Impact: revenue translation and USD-denominated procurement pressure margins
- Mitigation: hedges reduce volatility but add cost and operational complexity
Commodity basis and congestion
Regional gas basis differentials and localized power congestion materially affect delivered costs, with past winter basis spikes exceeding 4/MMBtu in some Northeast hubs and seasonal peaks persisting into 2024. Mismatches between customer load and hedge nodes create basis exposure that can erode margins on fixed-price contracts. Persistent transmission constraints — seen in constrained PJM/NYISO pockets — force node-level pricing strategies and dynamic basis risk management.
- Basis spikes >4/MMBtu in Northeast (historical peak)
- Mismatched load vs hedge nodes = direct exposure
- Transmission constraints shape node pricing
- Active basis risk management essential for fixed-price products
Regulatory shifts reshape market; renewables ~22%, retail ~17¢/kWh
Wholesale gas swings (Henry Hub ~3–4/MMBtu in 2023–24; 2022 peaks near 9/MMBtu) drive procurement, hedging and collateral needs; Fed funds 5.25–5.50% (Jun 2025) raises funding costs and compresses LTV; macro (US unemployment 3.9% in 2024) lifts churn and bad-debt risk; CAD/USD ~1.34–1.36 (2024–H1 2025) creates translation and procurement margin pressure.
| Metric | Value |
|---|---|
| Henry Hub | 3–4/MMBtu (2023–24) |
| Fed funds | 5.25–5.50% (Jun 2025) |
| Unemployment | 3.9% (2024) |
| CAD/USD | 1.34–1.36 (2024–H1 2025) |
Same Document Delivered
Just Energy PESTLE Analysis
The Just Energy PESTLE Analysis provides a concise review of political, economic, social, technological, legal and environmental factors affecting the company, with actionable insights for investors and managers. The preview shown here is the exact document you’ll receive after purchase—fully formatted and ready to use. No placeholders, no teasers.
Description
Your Competitive Advantage Starts with This Report
Discover how political shifts, economic pressures, social trends, and technological change are reshaping Just Energy’s strategic landscape in our concise PESTLE snapshot. Gain actionable insights on regulatory risks, market opportunities, and environmental drivers to inform investment and strategy decisions. Buy the full PESTLE report for the complete, ready-to-use analysis and downloadable templates.
Political factors
Deregulation policy stability
Changes to state/provincial deregulation can rapidly expand or shrink Just Energy’s addressable market across over 20 jurisdictions in North America, affecting customer acquisition and book value. Tightened switching rules or stricter price-disclosure mandates can compress margins and require compliance costs; retail sales practices were already under greater scrutiny as renewables reached about 22% of US generation in 2023. Political turnover can swing policy toward or away from retail choice, while active stakeholder lobbying continues to reshape market design and default service structures.
Energy affordability agendas
Governments prioritizing affordability may cap rates or strengthen default supply, squeezing retailer margins and eroding differentiated value propositions. EIA June 2025 shows US average retail electricity near 17 cents/kWh and an average monthly residential bill around $145, making subsidy design consequential. Populist scrutiny of retail markups has spurred regulatory hearings and reforms, while public assistance programs such as LIHEAP typically require retailer participation and compliance.
Cross-border energy relations
US–Canada energy trade policy shapes wholesale and hedging for a bi‑national retailer: Canada exported roughly 6–7 Bcf/d of pipeline gas to the US in 2023–24, tightening or loosening hedging corridors. Transmission and intertie rules influence regional price convergence, with cross‑border electricity and gas flows smoothing local spreads. Political stances on LNG and pipelines (US LNG export capacity ≈13 Bcf/d in 2024) shift basis risk, while tariffs or permitting delays can raise supply costs and margin volatility.
Renewables and green incentives
- IRA tax credits expanded clean credits, boosting green plan demand
- 30+ states RPS ≈60% U.S. load — REC policy shifts impact cost
- Storage incentives lower system costs, reshape tariffs
- Public community solar funding enables partnership models
Municipal aggregation trends
Regulatory shifts reshape market; renewables ~22%, retail ~17¢/kWh
Regulatory shifts in state/provincial deregulation and switching rules can rapidly change Just Energy’s addressable market and compliance costs, with renewables ~22% of US generation in 2023 and IRA-driven green demand rising. Affordability politics and rate caps pressure margins; EIA Jun 2025 US avg retail ≈17¢/kWh, avg bill ≈$145. Cross‑border gas flows (Canada 6–7 Bcf/d to US in 2023–24) and US LNG capacity ≈13 Bcf/d (2024) alter hedging and basis risk.
| Metric | Value |
|---|---|
| US renewables (2023) | ~22% |
| Avg retail price (Jun 2025) | ~17¢/kWh |
| Avg residential bill (Jun 2025) | $145 |
| CCAs customers (2024) | >10M |
| Canada→US gas (2023–24) | 6–7 Bcf/d |
| US LNG capacity (2024) | ~13 Bcf/d |
What is included in the product
Detailed Word Document
Explores how macro-environmental forces uniquely affect Just Energy across Political, Economic, Social, Technological, Environmental and Legal dimensions, with data-driven examples and trend analysis. Designed for executives and investors to identify regulatory risks, market opportunities and strategic responses.
Customizable Excel Spreadsheet
A clean, summarized Just Energy PESTLE analysis for quick reference during meetings, visually segmented by category to support discussions on external risks and market positioning and easily dropped into PowerPoints or shared across teams.
Economic factors
Wholesale price volatility
Wholesale power and gas swings drive procurement costs and hedging demand; after 2022 Henry Hub peaks near 9/MMBtu, Henry Hub averaged about 3–4/MMBtu in 2023–24, pressuring suppliers to increase hedge activity. Spikes can erode fixed-price margins when hedges misalign with load, as seen in 2022–23 margin squeezes. Volatility forces higher collateral postings to ISOs and suppliers, raising working capital needs. Stable prices make customer acquisition easier by enabling predictable retail offers.
Interest rates and credit costs
Higher policy rates (Fed funds 5.25–5.50% as of June 2025) lift Just Energy’s working capital and hedging collateral needs, often adding 50–150 bps to funding costs. Higher discount rates compress lifetime value and force tighter contract pricing; IG corporate yields ~4.5–5.5% raise benchmark spreads. Tight credit markets can limit growth or push securitization of receivables. Conversely, falling rates enable refinancing and lower customer bills.
Consumer demand and churn
Macro conditions drive switching and payment performance for Just Energy; US unemployment averaged 3.9% in 2024 (BLS), tightening household budgets and prompting higher churn. Recessions raise price sensitivity and bad-debt risk, pressuring collections. Elevated market competition compresses margins and lifts customer-acquisition costs, while commercial load is cyclical, shifting portfolio mix and revenue seasonally.
FX exposure (CAD/USD)
Operating in both Canada and the US exposes Just Energy to CAD/USD volatility; CAD/USD averaged about 1.34–1.36 across 2024–H1 2025, creating translation and transaction risk on revenues and costs.
Exchange swings directly affect reported earnings and hedge mark-to-market outcomes; procurement and REC purchases settled in USD can compress Canadian margins when the dollar strengthens.
Hedging programs reduce spot exposure but introduce premium costs, collateral needs and hedge accounting complexity that can swing quarterly P&L.
- FX exposure: CAD/USD ~1.34–1.36 (2024–H1 2025)
- Impact: revenue translation and USD-denominated procurement pressure margins
- Mitigation: hedges reduce volatility but add cost and operational complexity
Commodity basis and congestion
Regional gas basis differentials and localized power congestion materially affect delivered costs, with past winter basis spikes exceeding 4/MMBtu in some Northeast hubs and seasonal peaks persisting into 2024. Mismatches between customer load and hedge nodes create basis exposure that can erode margins on fixed-price contracts. Persistent transmission constraints — seen in constrained PJM/NYISO pockets — force node-level pricing strategies and dynamic basis risk management.
- Basis spikes >4/MMBtu in Northeast (historical peak)
- Mismatched load vs hedge nodes = direct exposure
- Transmission constraints shape node pricing
- Active basis risk management essential for fixed-price products
Regulatory shifts reshape market; renewables ~22%, retail ~17¢/kWh
Wholesale gas swings (Henry Hub ~3–4/MMBtu in 2023–24; 2022 peaks near 9/MMBtu) drive procurement, hedging and collateral needs; Fed funds 5.25–5.50% (Jun 2025) raises funding costs and compresses LTV; macro (US unemployment 3.9% in 2024) lifts churn and bad-debt risk; CAD/USD ~1.34–1.36 (2024–H1 2025) creates translation and procurement margin pressure.
| Metric | Value |
|---|---|
| Henry Hub | 3–4/MMBtu (2023–24) |
| Fed funds | 5.25–5.50% (Jun 2025) |
| Unemployment | 3.9% (2024) |
| CAD/USD | 1.34–1.36 (2024–H1 2025) |
Same Document Delivered
Just Energy PESTLE Analysis
The Just Energy PESTLE Analysis provides a concise review of political, economic, social, technological, legal and environmental factors affecting the company, with actionable insights for investors and managers. The preview shown here is the exact document you’ll receive after purchase—fully formatted and ready to use. No placeholders, no teasers.











