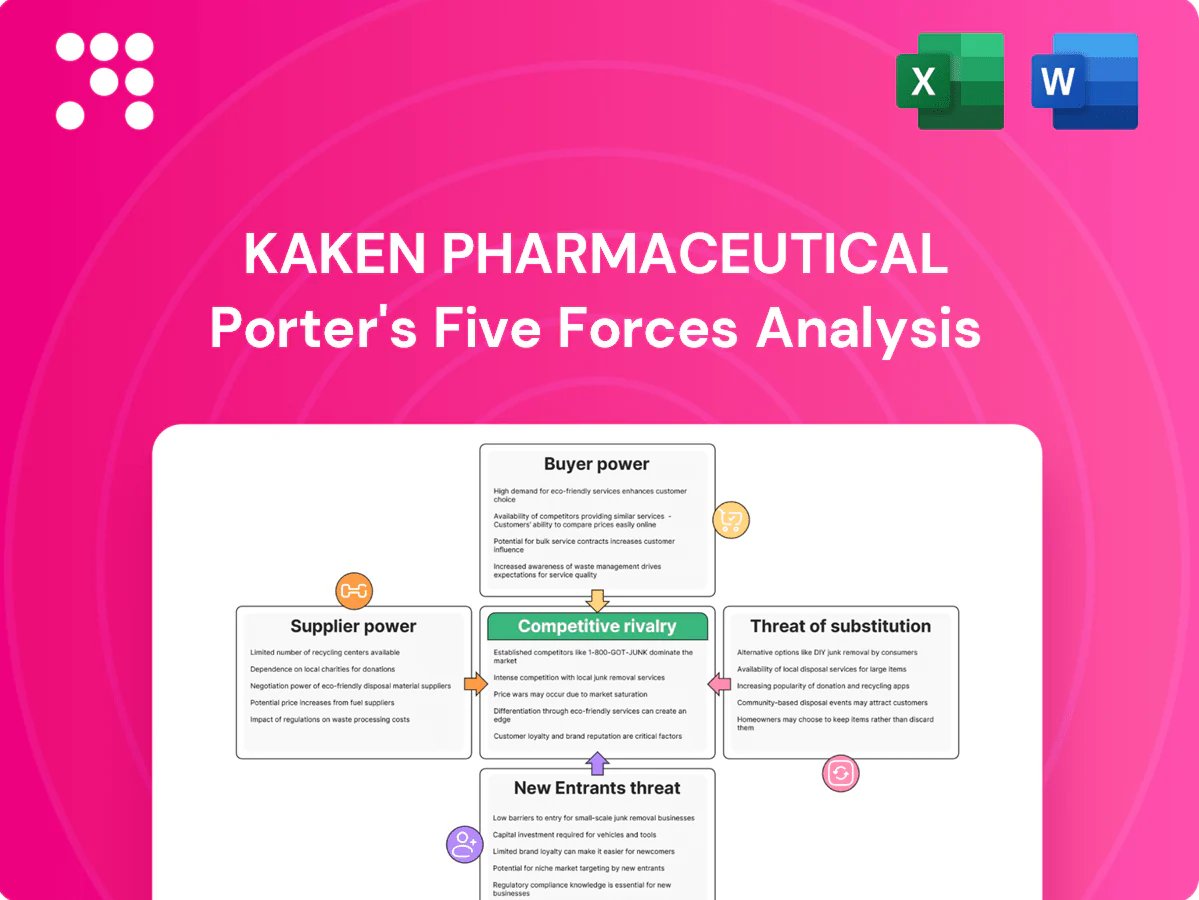
Kaken Pharmaceutical Porter's Five Forces Analysis

Don't Miss the Bigger Picture
Kaken Pharmaceutical faces intense competitive rivalry in generics and niche therapeutics, while supplier power is moderate due to specialized inputs and long-term contracts. Buyer power is rising as payers press for cost containment, and threats from substitutes and biosimilars are growing. This brief snapshot only scratches the surface. Unlock the full Porter's Five Forces Analysis to explore Kaken Pharmaceutical’s competitive dynamics in detail.
Suppliers Bargaining Power

Specialty APIs reliance
Many dermatology and anti-infective actives are niche, giving specialized API makers leverage on pricing and 6–12 month lead times; industry surveys in 2024 report specialty APIs account for ~20–25% of API spend in small pharma. Qualification and switching entail GMP audits and regulatory filings that typically take 6+ months and can cost low six figures. Supply shocks have delayed trials and launches historically, while dual-sourcing reduces risk but can increase COGS by an estimated 5–10% and add procurement complexity.
Biotech tools & reagents
R&D relies on patented assays, biologics reagents, and lab platforms supplied mainly by a few global vendors such as Thermo Fisher, Danaher and Merck, concentrating supplier power. Vendor lock-in from proprietary platforms raises switching costs and weakens Kaken’s negotiating leverage. Mid-cap pipelines see limited volume-discount bargaining, constraining cost reductions. Long-term supply agreements are used to stabilize pricing and availability.

CRO/CMO capacity tightness
Outsourced development and manufacturing face cyclical capacity constraints that shift negotiation leverage to CROs/CMOs, letting providers demand priority premiums and tighter contractual terms. Securing priority slots often means higher costs and firmer delivery commitments, while complex tech transfers and quality assurance issues deepen dependency on experienced partners. Long-term strategic partnerships can lock in capacity but reduce operational flexibility and bargaining options.

Clinical sites & KOLs
Access to high-enrolling dermatology and orthopedics sites is competitive, giving investigators leverage over protocol design and fees; top sites can supply a disproportionate share of patients, speeding readouts by months. Protocol misalignment and rising site fees compress sponsor negotiating power, while strong KOL relationships accelerate recruitment and regulatory interactions. Global site diversification (Asia, EU, US) reduces single-site leverage and contagion risk.
- High-enrolling sites: outsized enrollment share, faster readouts
- Site fees/protocol alignment: upward pressure on costs
- Global diversification: lowers single-site bargaining power
Packaging & sterile supplies
Packaging and sterile supplies are sourced from a narrow pool—typically 3–5 qualified vendors—so validation burdens (often 6–12 months and material validation costs) make supplier switching costly and slow; any QC deviation can force full-batch losses, creating high operational risk. Kaken mitigates via framework contracts and safety stocks (covering ~4–6 weeks) to temper disruptions in 2024.
- Supplier count: 3–5
- Validation time: 6–12 months
- Safety stock: ~4–6 weeks
- Framework contracts: majority coverage
Supplier power rises: Specialty APIs 20–25% spend, 6–12 month lead times
Suppliers hold moderate-to-high power: specialty APIs drive ~20–25% of API spend in 2024 with 6–12 month lead times, switching costs in low six figures, and COGS uplift of ~5–10% for dual-sourcing. Key lab vendors concentrate inputs; packaging suppliers number 3–5 with 6–12 month validation and ~4–6 weeks safety stock. Long-term contracts partially mitigate risk.
| Metric | 2024 Value |
|---|---|
| Specialty API spend | 20–25% |
| Validation time | 6–12 months |
| Packaging suppliers | 3–5 |
| Safety stock | 4–6 weeks |
| COGS uplift (dual-source) | 5–10% |
What is included in the product
 Detailed Word Document
Tailored Porter’s Five Forces analysis of Kaken Pharmaceutical uncovering competitive drivers, buyer and supplier power, entry barriers, substitute threats, and strategic implications for pricing and profitability. Includes identification of disruptive forces and protections that shape Kaken’s market position for use in investor decks, strategy reports, or academic work.

 Customizable Excel Spreadsheet
A concise, one-sheet Porter's Five Forces for Kaken Pharmaceutical—clarifies supplier/payer leverage, regulatory and R&D threats, and competitive intensity so teams can quickly identify strategic pain points and prioritize responses.
Customers Bargaining Power

Payers dictate access
Payers—insurers and national health systems—drive price-volume agreements, rebates and formulary placement, with the global pharma market at about $1.8 trillion in 2024 and US manufacturer rebates often exceeding 30%, pressuring margins. Rising cost-effectiveness demands in dermatology and infection care increase HTA scrutiny; HTA outcomes now materially shape adoption curves. Robust real-world evidence can strengthen Kaken’s bargaining position.
Hospital & clinic procurement
Hospital groups and dermatology chains pooling procurement raise price pressure, especially in Japan where there are about 8,300 hospitals, enabling bulk contracts that squeeze margins. Tender processes often commoditize categories as generics reach roughly 88% volume penetration (2022), driving price competition. Service levels and delivery reliability become tie-breakers, while demonstrated differentiated clinical outcomes allow firms like Kaken to resist pure discounting.

Distributors & wholesalers
Distributors and wholesalers strongly influence Kaken's shelf access and inventory turns, often pressing for higher trade margins to prioritize stocking. Ongoing consolidation among major Japanese distributors increases their negotiating leverage over pricing and placement. Chargebacks, returns and rebate terms materially compress net pricing and margin realization. Kaken's multi-channel sales and direct-to-pharmacy initiatives reduce dependency on any single distributor.

Physician preference
Prescribers prioritize efficacy, safety and convenience but can switch rapidly to alternatives; KOL advocacy and 2024 guideline updates significantly steer uptake for Kaken products. Targeted education and patient-support programs reduce switching and improve adherence, while adverse event signals can shift demand abruptly, triggering rapid prescription declines.
- Prescriber switching risk high
- KOLs/guidelines drive uptake
- Education/support lower churn
- Adverse events cause sudden demand drops
International markets
In international markets, country-level external reference pricing used by over 30 OECD members in 2024 and EU parallel trade can compress Kaken’s margins by an estimated 5–10%; local tender rules and registration timelines (commonly 6–24 months) add friction to market entry. Currency swings (USD/JPY volatility ~7% in 2024) erode affordability and netbacks, while regional distributors/partners typically capture 15–30% of value.
- OECD reference pricing: >30 countries (2024)
- Registration timelines: 6–24 months
- Distributor take: 15–30%; margin squeeze 5–10%
Payers/HTA rebates, hospital tenders and FX volatility squeeze pharma netbacks
Payers and HTA drive price/rebate pressure (global pharma ~$1.8T in 2024; US rebates >30%), hospitals and tenders compress margins, distributors demand higher trade margins, and prescribers/KOLs determine uptake while adverse events cause rapid switches. International reference pricing and FX volatility (~7% USD/JPY 2024) further erode netbacks.
| Metric | Value |
|---|---|
| Global pharma (2024) | $1.8T |
| US rebates | >30% |
| Japan hospitals | ~8,300 |
| Distributor take | 15–30% |
| USD/JPY vol (2024) | ~7% |
What You See Is What You Get
Kaken Pharmaceutical Porter's Five Forces Analysis
This preview shows the exact Porter's Five Forces analysis for Kaken Pharmaceutical you'll receive after purchase—no placeholders or mockups. The full, professionally formatted report covers competitive rivalry, supplier and buyer power, and threats of substitutes and entrants, and is ready for immediate download and use.

Don't Miss the Bigger Picture
Kaken Pharmaceutical faces intense competitive rivalry in generics and niche therapeutics, while supplier power is moderate due to specialized inputs and long-term contracts. Buyer power is rising as payers press for cost containment, and threats from substitutes and biosimilars are growing. This brief snapshot only scratches the surface. Unlock the full Porter's Five Forces Analysis to explore Kaken Pharmaceutical’s competitive dynamics in detail.
Suppliers Bargaining Power
Specialty APIs reliance
Many dermatology and anti-infective actives are niche, giving specialized API makers leverage on pricing and 6–12 month lead times; industry surveys in 2024 report specialty APIs account for ~20–25% of API spend in small pharma. Qualification and switching entail GMP audits and regulatory filings that typically take 6+ months and can cost low six figures. Supply shocks have delayed trials and launches historically, while dual-sourcing reduces risk but can increase COGS by an estimated 5–10% and add procurement complexity.
Biotech tools & reagents
R&D relies on patented assays, biologics reagents, and lab platforms supplied mainly by a few global vendors such as Thermo Fisher, Danaher and Merck, concentrating supplier power. Vendor lock-in from proprietary platforms raises switching costs and weakens Kaken’s negotiating leverage. Mid-cap pipelines see limited volume-discount bargaining, constraining cost reductions. Long-term supply agreements are used to stabilize pricing and availability.
CRO/CMO capacity tightness
Outsourced development and manufacturing face cyclical capacity constraints that shift negotiation leverage to CROs/CMOs, letting providers demand priority premiums and tighter contractual terms. Securing priority slots often means higher costs and firmer delivery commitments, while complex tech transfers and quality assurance issues deepen dependency on experienced partners. Long-term strategic partnerships can lock in capacity but reduce operational flexibility and bargaining options.
Clinical sites & KOLs
Access to high-enrolling dermatology and orthopedics sites is competitive, giving investigators leverage over protocol design and fees; top sites can supply a disproportionate share of patients, speeding readouts by months. Protocol misalignment and rising site fees compress sponsor negotiating power, while strong KOL relationships accelerate recruitment and regulatory interactions. Global site diversification (Asia, EU, US) reduces single-site leverage and contagion risk.
- High-enrolling sites: outsized enrollment share, faster readouts
- Site fees/protocol alignment: upward pressure on costs
- Global diversification: lowers single-site bargaining power
Packaging & sterile supplies
Packaging and sterile supplies are sourced from a narrow pool—typically 3–5 qualified vendors—so validation burdens (often 6–12 months and material validation costs) make supplier switching costly and slow; any QC deviation can force full-batch losses, creating high operational risk. Kaken mitigates via framework contracts and safety stocks (covering ~4–6 weeks) to temper disruptions in 2024.
- Supplier count: 3–5
- Validation time: 6–12 months
- Safety stock: ~4–6 weeks
- Framework contracts: majority coverage
Supplier power rises: Specialty APIs 20–25% spend, 6–12 month lead times
Suppliers hold moderate-to-high power: specialty APIs drive ~20–25% of API spend in 2024 with 6–12 month lead times, switching costs in low six figures, and COGS uplift of ~5–10% for dual-sourcing. Key lab vendors concentrate inputs; packaging suppliers number 3–5 with 6–12 month validation and ~4–6 weeks safety stock. Long-term contracts partially mitigate risk.
| Metric | 2024 Value |
|---|---|
| Specialty API spend | 20–25% |
| Validation time | 6–12 months |
| Packaging suppliers | 3–5 |
| Safety stock | 4–6 weeks |
| COGS uplift (dual-source) | 5–10% |
What is included in the product
Detailed Word Document
Tailored Porter’s Five Forces analysis of Kaken Pharmaceutical uncovering competitive drivers, buyer and supplier power, entry barriers, substitute threats, and strategic implications for pricing and profitability. Includes identification of disruptive forces and protections that shape Kaken’s market position for use in investor decks, strategy reports, or academic work.
Customizable Excel Spreadsheet
A concise, one-sheet Porter's Five Forces for Kaken Pharmaceutical—clarifies supplier/payer leverage, regulatory and R&D threats, and competitive intensity so teams can quickly identify strategic pain points and prioritize responses.
Customers Bargaining Power
Payers dictate access
Payers—insurers and national health systems—drive price-volume agreements, rebates and formulary placement, with the global pharma market at about $1.8 trillion in 2024 and US manufacturer rebates often exceeding 30%, pressuring margins. Rising cost-effectiveness demands in dermatology and infection care increase HTA scrutiny; HTA outcomes now materially shape adoption curves. Robust real-world evidence can strengthen Kaken’s bargaining position.
Hospital & clinic procurement
Hospital groups and dermatology chains pooling procurement raise price pressure, especially in Japan where there are about 8,300 hospitals, enabling bulk contracts that squeeze margins. Tender processes often commoditize categories as generics reach roughly 88% volume penetration (2022), driving price competition. Service levels and delivery reliability become tie-breakers, while demonstrated differentiated clinical outcomes allow firms like Kaken to resist pure discounting.
Distributors & wholesalers
Distributors and wholesalers strongly influence Kaken's shelf access and inventory turns, often pressing for higher trade margins to prioritize stocking. Ongoing consolidation among major Japanese distributors increases their negotiating leverage over pricing and placement. Chargebacks, returns and rebate terms materially compress net pricing and margin realization. Kaken's multi-channel sales and direct-to-pharmacy initiatives reduce dependency on any single distributor.
Physician preference
Prescribers prioritize efficacy, safety and convenience but can switch rapidly to alternatives; KOL advocacy and 2024 guideline updates significantly steer uptake for Kaken products. Targeted education and patient-support programs reduce switching and improve adherence, while adverse event signals can shift demand abruptly, triggering rapid prescription declines.
- Prescriber switching risk high
- KOLs/guidelines drive uptake
- Education/support lower churn
- Adverse events cause sudden demand drops
International markets
In international markets, country-level external reference pricing used by over 30 OECD members in 2024 and EU parallel trade can compress Kaken’s margins by an estimated 5–10%; local tender rules and registration timelines (commonly 6–24 months) add friction to market entry. Currency swings (USD/JPY volatility ~7% in 2024) erode affordability and netbacks, while regional distributors/partners typically capture 15–30% of value.
- OECD reference pricing: >30 countries (2024)
- Registration timelines: 6–24 months
- Distributor take: 15–30%; margin squeeze 5–10%
Payers/HTA rebates, hospital tenders and FX volatility squeeze pharma netbacks
Payers and HTA drive price/rebate pressure (global pharma ~$1.8T in 2024; US rebates >30%), hospitals and tenders compress margins, distributors demand higher trade margins, and prescribers/KOLs determine uptake while adverse events cause rapid switches. International reference pricing and FX volatility (~7% USD/JPY 2024) further erode netbacks.
| Metric | Value |
|---|---|
| Global pharma (2024) | $1.8T |
| US rebates | >30% |
| Japan hospitals | ~8,300 |
| Distributor take | 15–30% |
| USD/JPY vol (2024) | ~7% |
What You See Is What You Get
Kaken Pharmaceutical Porter's Five Forces Analysis
This preview shows the exact Porter's Five Forces analysis for Kaken Pharmaceutical you'll receive after purchase—no placeholders or mockups. The full, professionally formatted report covers competitive rivalry, supplier and buyer power, and threats of substitutes and entrants, and is ready for immediate download and use.
Description
Don't Miss the Bigger Picture
Kaken Pharmaceutical faces intense competitive rivalry in generics and niche therapeutics, while supplier power is moderate due to specialized inputs and long-term contracts. Buyer power is rising as payers press for cost containment, and threats from substitutes and biosimilars are growing. This brief snapshot only scratches the surface. Unlock the full Porter's Five Forces Analysis to explore Kaken Pharmaceutical’s competitive dynamics in detail.
Suppliers Bargaining Power
Specialty APIs reliance
Many dermatology and anti-infective actives are niche, giving specialized API makers leverage on pricing and 6–12 month lead times; industry surveys in 2024 report specialty APIs account for ~20–25% of API spend in small pharma. Qualification and switching entail GMP audits and regulatory filings that typically take 6+ months and can cost low six figures. Supply shocks have delayed trials and launches historically, while dual-sourcing reduces risk but can increase COGS by an estimated 5–10% and add procurement complexity.
Biotech tools & reagents
R&D relies on patented assays, biologics reagents, and lab platforms supplied mainly by a few global vendors such as Thermo Fisher, Danaher and Merck, concentrating supplier power. Vendor lock-in from proprietary platforms raises switching costs and weakens Kaken’s negotiating leverage. Mid-cap pipelines see limited volume-discount bargaining, constraining cost reductions. Long-term supply agreements are used to stabilize pricing and availability.
CRO/CMO capacity tightness
Outsourced development and manufacturing face cyclical capacity constraints that shift negotiation leverage to CROs/CMOs, letting providers demand priority premiums and tighter contractual terms. Securing priority slots often means higher costs and firmer delivery commitments, while complex tech transfers and quality assurance issues deepen dependency on experienced partners. Long-term strategic partnerships can lock in capacity but reduce operational flexibility and bargaining options.
Clinical sites & KOLs
Access to high-enrolling dermatology and orthopedics sites is competitive, giving investigators leverage over protocol design and fees; top sites can supply a disproportionate share of patients, speeding readouts by months. Protocol misalignment and rising site fees compress sponsor negotiating power, while strong KOL relationships accelerate recruitment and regulatory interactions. Global site diversification (Asia, EU, US) reduces single-site leverage and contagion risk.
- High-enrolling sites: outsized enrollment share, faster readouts
- Site fees/protocol alignment: upward pressure on costs
- Global diversification: lowers single-site bargaining power
Packaging & sterile supplies
Packaging and sterile supplies are sourced from a narrow pool—typically 3–5 qualified vendors—so validation burdens (often 6–12 months and material validation costs) make supplier switching costly and slow; any QC deviation can force full-batch losses, creating high operational risk. Kaken mitigates via framework contracts and safety stocks (covering ~4–6 weeks) to temper disruptions in 2024.
- Supplier count: 3–5
- Validation time: 6–12 months
- Safety stock: ~4–6 weeks
- Framework contracts: majority coverage
Supplier power rises: Specialty APIs 20–25% spend, 6–12 month lead times
Suppliers hold moderate-to-high power: specialty APIs drive ~20–25% of API spend in 2024 with 6–12 month lead times, switching costs in low six figures, and COGS uplift of ~5–10% for dual-sourcing. Key lab vendors concentrate inputs; packaging suppliers number 3–5 with 6–12 month validation and ~4–6 weeks safety stock. Long-term contracts partially mitigate risk.
| Metric | 2024 Value |
|---|---|
| Specialty API spend | 20–25% |
| Validation time | 6–12 months |
| Packaging suppliers | 3–5 |
| Safety stock | 4–6 weeks |
| COGS uplift (dual-source) | 5–10% |
What is included in the product
Detailed Word Document
Tailored Porter’s Five Forces analysis of Kaken Pharmaceutical uncovering competitive drivers, buyer and supplier power, entry barriers, substitute threats, and strategic implications for pricing and profitability. Includes identification of disruptive forces and protections that shape Kaken’s market position for use in investor decks, strategy reports, or academic work.
Customizable Excel Spreadsheet
A concise, one-sheet Porter's Five Forces for Kaken Pharmaceutical—clarifies supplier/payer leverage, regulatory and R&D threats, and competitive intensity so teams can quickly identify strategic pain points and prioritize responses.
Customers Bargaining Power
Payers dictate access
Payers—insurers and national health systems—drive price-volume agreements, rebates and formulary placement, with the global pharma market at about $1.8 trillion in 2024 and US manufacturer rebates often exceeding 30%, pressuring margins. Rising cost-effectiveness demands in dermatology and infection care increase HTA scrutiny; HTA outcomes now materially shape adoption curves. Robust real-world evidence can strengthen Kaken’s bargaining position.
Hospital & clinic procurement
Hospital groups and dermatology chains pooling procurement raise price pressure, especially in Japan where there are about 8,300 hospitals, enabling bulk contracts that squeeze margins. Tender processes often commoditize categories as generics reach roughly 88% volume penetration (2022), driving price competition. Service levels and delivery reliability become tie-breakers, while demonstrated differentiated clinical outcomes allow firms like Kaken to resist pure discounting.
Distributors & wholesalers
Distributors and wholesalers strongly influence Kaken's shelf access and inventory turns, often pressing for higher trade margins to prioritize stocking. Ongoing consolidation among major Japanese distributors increases their negotiating leverage over pricing and placement. Chargebacks, returns and rebate terms materially compress net pricing and margin realization. Kaken's multi-channel sales and direct-to-pharmacy initiatives reduce dependency on any single distributor.
Physician preference
Prescribers prioritize efficacy, safety and convenience but can switch rapidly to alternatives; KOL advocacy and 2024 guideline updates significantly steer uptake for Kaken products. Targeted education and patient-support programs reduce switching and improve adherence, while adverse event signals can shift demand abruptly, triggering rapid prescription declines.
- Prescriber switching risk high
- KOLs/guidelines drive uptake
- Education/support lower churn
- Adverse events cause sudden demand drops
International markets
In international markets, country-level external reference pricing used by over 30 OECD members in 2024 and EU parallel trade can compress Kaken’s margins by an estimated 5–10%; local tender rules and registration timelines (commonly 6–24 months) add friction to market entry. Currency swings (USD/JPY volatility ~7% in 2024) erode affordability and netbacks, while regional distributors/partners typically capture 15–30% of value.
- OECD reference pricing: >30 countries (2024)
- Registration timelines: 6–24 months
- Distributor take: 15–30%; margin squeeze 5–10%
Payers/HTA rebates, hospital tenders and FX volatility squeeze pharma netbacks
Payers and HTA drive price/rebate pressure (global pharma ~$1.8T in 2024; US rebates >30%), hospitals and tenders compress margins, distributors demand higher trade margins, and prescribers/KOLs determine uptake while adverse events cause rapid switches. International reference pricing and FX volatility (~7% USD/JPY 2024) further erode netbacks.
| Metric | Value |
|---|---|
| Global pharma (2024) | $1.8T |
| US rebates | >30% |
| Japan hospitals | ~8,300 |
| Distributor take | 15–30% |
| USD/JPY vol (2024) | ~7% |
What You See Is What You Get
Kaken Pharmaceutical Porter's Five Forces Analysis
This preview shows the exact Porter's Five Forces analysis for Kaken Pharmaceutical you'll receive after purchase—no placeholders or mockups. The full, professionally formatted report covers competitive rivalry, supplier and buyer power, and threats of substitutes and entrants, and is ready for immediate download and use.











