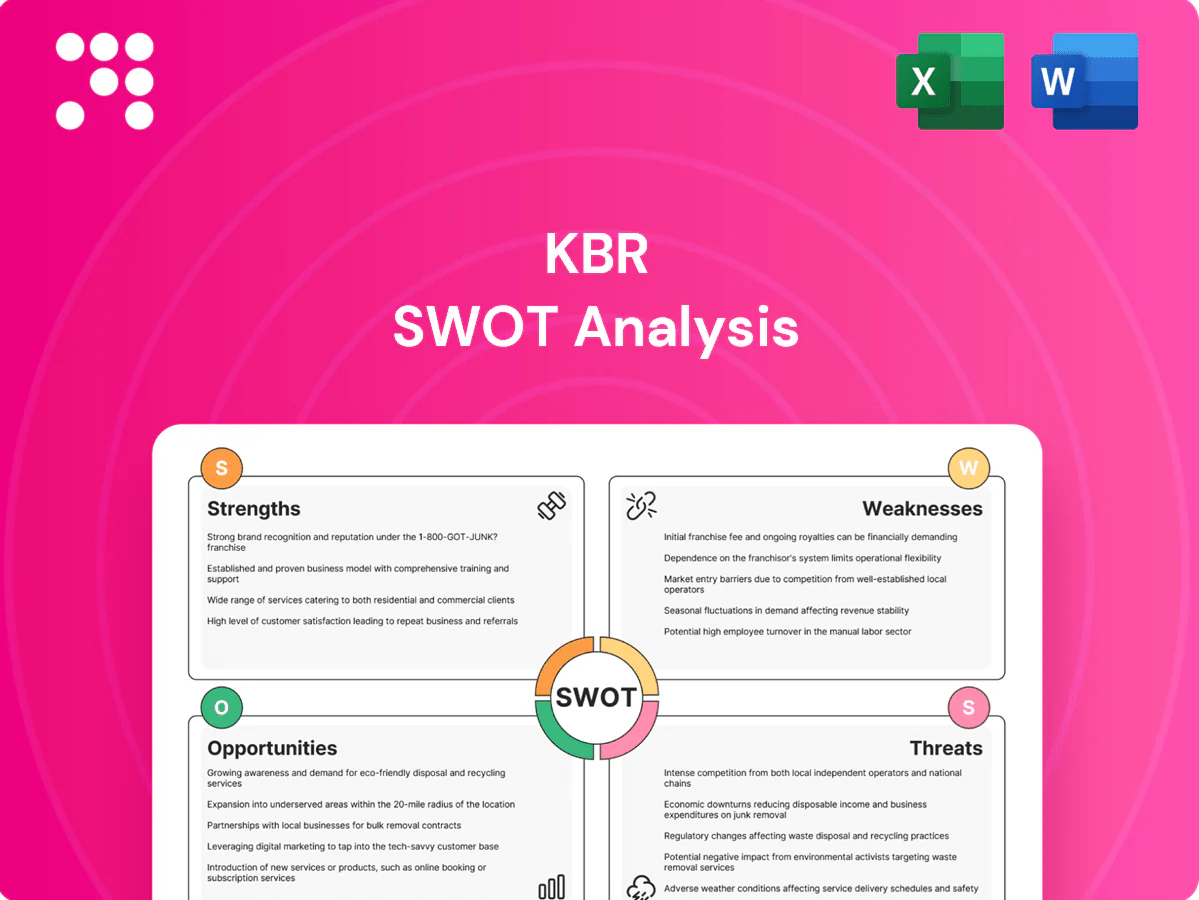
KBR SWOT Analysis

Go Beyond the Preview—Access the Full Strategic Report
KBR’s engineering pedigree, global government contracts, and growing digital services offer strong revenue visibility, while exposure to defense spending cycles, contract concentration, and integration risks pose strategic challenges. Our full SWOT unpacks these implications with financial context and actionable recommendations. Purchase the complete report for an editable Word and Excel package to plan, pitch, or invest with confidence.
Strengths

Diversified service portfolio
Operating across government, technology, and energy spreads revenue sources and reduces cyclicality; KBR reported approximately $6.9 billion revenue in 2024 with a multi-billion-dollar backlog supporting stability. The firm blends advisory, engineering, program management and O&M to capture full-lifecycle spend, enabling cross-selling and resilient utilization. Diversification hedges sector-specific downturns and preserves cash flow during cycles.
Large, sticky government contracts
Long-duration contracts with defense, space and civil agencies (e.g., FY2025 U.S. defense budget ~$858B, NASA ~$27B) give KBR multi-year backlog visibility and steady cash flow; hardened performance credentials and compliance raise switching costs and lift win rates via contract vehicles; this base cushions macro volatility in commercial markets.

Proprietary technologies and IP
KBR’s proprietary process technologies and digital solutions differentiate bids and expanded margins, with the company reporting approximately $5.9 billion in FY2024 revenue that increased tech-led contract wins. Tech licensing—delivered capital-light—scales profitably and contributed a growing share of recurring revenues. Integrating IP with engineering and services deepens client lock-in and bolsters pricing power versus commoditized EPC peers.

Global delivery and execution scale
Global delivery across 40+ countries enables rapid mobilization and multi-theater program delivery; established supply chains and partner ecosystems enhance cost and schedule control; scale supports standardized methodologies and quality assurance; clients value a single integrator for complex, multi-year missions.
- Global footprint: 40+ countries
- Integrated supply chains
- Standardized QA/methods
- Single integrator for multi-year programs
Strong program management and safety record
KBR's track record in mission-critical environments underpins credibility and supports a FY2024 revenue base of approximately $6.4 billion, reflecting stable program delivery. A mature PMO, governance and safety systems reduce execution risk and lower clients' total cost of ownership through predictability. Reputation compounds via high recompete rates and referrals, sustaining backlog.
- Track record: mission-critical delivery
- PMO & safety: lower execution risk
- Client benefit: reduced TCO via predictability
- Growth: compounded by recompetes/referrals
Diversified gov, tech & energy mix drove FY2024 $6.9B; multi-yr U.S. defense/NASA support
KBR’s diversified government, technology and energy mix drove FY2024 revenue of approximately $6.9B with a multi‑billion-dollar backlog, reducing cyclicality and enabling cross‑selling. Long‑duration U.S. government contracts (FY2025 defense ~$858B; NASA ~$27B) provide multi‑year visibility and steady cash flow. Proprietary tech, global delivery (40+ countries) and strong PMO/safety lower execution risk and boost recompete rates.
| Metric | Value |
|---|---|
| FY2024 Revenue | $6.9B |
| Geographic Footprint | 40+ countries |
| FY2025 US Defense Budget | $858B |
| NASA FY2025 | $27B |
What is included in the product
 Detailed Word Document
Delivers a strategic overview of KBR’s internal and external business factors, outlining strengths, weaknesses, opportunities and threats to assess its competitive position, growth drivers, operational gaps and future risks.

 Customizable Excel Spreadsheet
Provides a concise KBR-focused SWOT matrix for fast, visual strategy alignment and quick stakeholder-ready summaries.
Weaknesses

Contract and execution risk exposure
Complex, large-scale contracts expose KBR to scope creep, change orders and claims that can erode profitability if not recovered through contract adjustments; fixed-price or poorly hedged terms have in past projects compressed margins materially. Schedule slippage can trigger liquidated damages and reputational loss, while legacy project issues have previously distracted management and tied up capital needed for new bids and execution.
Labor-intensive model pressures margins
KBR’s labor‑intensive model leaves margins highly exposed: utilization dips, attrition, and wage inflation materially compress profitability. Scarcity of knowledge workers raises recruiting and retention costs, increasing SG&A and project resourcing charges. Under multi‑year contracts rate realization often lags rising labor costs, constraining near‑term margins. Sustainable margin expansion depends on shifting revenue mix toward higher‑margin technology and IP offerings.

Dependence on government budgets
Dependence on government budgets exposes KBR to award delays from appropriations cycles and political shifts, with continuing resolutions slowing tasking and ramp-ups. Government shutdowns, such as the 35-day U.S. shutdown in 2018, and sequestration-level cuts (about $85 billion in 2013) can shift revenue timing. Heavy portfolio concentration in defense and space increases KBRs policy sensitivity and cash-flow volatility.

Operational complexity across geographies
Operational complexity across geographies drives higher overhead and compliance risk for KBR, as multi-jurisdiction requirements demand extensive legal and reporting resources. Rigorous controls are needed to manage export controls, sanctions, and anti-bribery rules, increasing compliance costs and audit exposure. Currency volatility and layered tax regimes can compress margins, while supply chain reliability varies by region, raising schedule and cost risk.
- Multi-jurisdiction compliance: higher overhead
- Regulatory controls: export, sanctions, anti-bribery
- Financial pressure: currency and tax complexity
- Operational risk: variable regional supply chain reliability
Hydrocarbon legacy perception
Hydrocarbon legacy perception ties KBR to traditional energy, which can deter ESG-focused capital and slow access to green-transition funds despite growing clean-energy contracts.
Valuation multiples often lag pure-play government tech peers, reflecting investor bias toward digital/defense firms with clearer ESG credentials.
Talent attraction in ESG-centric markets can be harder; narrative transition requires consistent, auditable proof points across contracts and disclosures.
- ESG capital drag
- Lower relative multiples
- Recruiting challenges
- Need for verifiable transition metrics
Fixed-price margin pressure and government contract concentration raise operational and ESG risk
KBR remains margin‑vulnerable from large fixed‑price projects, labor cost inflation and schedule slippage, with government contract concentration amplifying timing risk and policy sensitivity. Multi‑jurisdiction compliance and legacy hydrocarbon exposure raise overhead and ESG capital friction, slowing multiple expansion and talent attraction. Persistent operational complexity increases audit, supply‑chain and FX risks.
| Metric | Value (2024) |
|---|---|
| Revenue | $6.0B |
| Govt. % of rev | ~60% |
| Backlog | $11B |
Preview the Actual Deliverable
KBR SWOT Analysis
This is the actual KBR SWOT analysis document you’ll receive upon purchase—no surprises, just professional quality. The preview below is taken directly from the full report, and the complete, editable version is unlocked after checkout. Buy now to access the full, detailed file.

Go Beyond the Preview—Access the Full Strategic Report
KBR’s engineering pedigree, global government contracts, and growing digital services offer strong revenue visibility, while exposure to defense spending cycles, contract concentration, and integration risks pose strategic challenges. Our full SWOT unpacks these implications with financial context and actionable recommendations. Purchase the complete report for an editable Word and Excel package to plan, pitch, or invest with confidence.
Strengths
Diversified service portfolio
Operating across government, technology, and energy spreads revenue sources and reduces cyclicality; KBR reported approximately $6.9 billion revenue in 2024 with a multi-billion-dollar backlog supporting stability. The firm blends advisory, engineering, program management and O&M to capture full-lifecycle spend, enabling cross-selling and resilient utilization. Diversification hedges sector-specific downturns and preserves cash flow during cycles.
Large, sticky government contracts
Long-duration contracts with defense, space and civil agencies (e.g., FY2025 U.S. defense budget ~$858B, NASA ~$27B) give KBR multi-year backlog visibility and steady cash flow; hardened performance credentials and compliance raise switching costs and lift win rates via contract vehicles; this base cushions macro volatility in commercial markets.
Proprietary technologies and IP
KBR’s proprietary process technologies and digital solutions differentiate bids and expanded margins, with the company reporting approximately $5.9 billion in FY2024 revenue that increased tech-led contract wins. Tech licensing—delivered capital-light—scales profitably and contributed a growing share of recurring revenues. Integrating IP with engineering and services deepens client lock-in and bolsters pricing power versus commoditized EPC peers.
Global delivery and execution scale
Global delivery across 40+ countries enables rapid mobilization and multi-theater program delivery; established supply chains and partner ecosystems enhance cost and schedule control; scale supports standardized methodologies and quality assurance; clients value a single integrator for complex, multi-year missions.
- Global footprint: 40+ countries
- Integrated supply chains
- Standardized QA/methods
- Single integrator for multi-year programs
Strong program management and safety record
KBR's track record in mission-critical environments underpins credibility and supports a FY2024 revenue base of approximately $6.4 billion, reflecting stable program delivery. A mature PMO, governance and safety systems reduce execution risk and lower clients' total cost of ownership through predictability. Reputation compounds via high recompete rates and referrals, sustaining backlog.
- Track record: mission-critical delivery
- PMO & safety: lower execution risk
- Client benefit: reduced TCO via predictability
- Growth: compounded by recompetes/referrals
Diversified gov, tech & energy mix drove FY2024 $6.9B; multi-yr U.S. defense/NASA support
KBR’s diversified government, technology and energy mix drove FY2024 revenue of approximately $6.9B with a multi‑billion-dollar backlog, reducing cyclicality and enabling cross‑selling. Long‑duration U.S. government contracts (FY2025 defense ~$858B; NASA ~$27B) provide multi‑year visibility and steady cash flow. Proprietary tech, global delivery (40+ countries) and strong PMO/safety lower execution risk and boost recompete rates.
| Metric | Value |
|---|---|
| FY2024 Revenue | $6.9B |
| Geographic Footprint | 40+ countries |
| FY2025 US Defense Budget | $858B |
| NASA FY2025 | $27B |
What is included in the product
Detailed Word Document
Delivers a strategic overview of KBR’s internal and external business factors, outlining strengths, weaknesses, opportunities and threats to assess its competitive position, growth drivers, operational gaps and future risks.
Customizable Excel Spreadsheet
Provides a concise KBR-focused SWOT matrix for fast, visual strategy alignment and quick stakeholder-ready summaries.
Weaknesses
Contract and execution risk exposure
Complex, large-scale contracts expose KBR to scope creep, change orders and claims that can erode profitability if not recovered through contract adjustments; fixed-price or poorly hedged terms have in past projects compressed margins materially. Schedule slippage can trigger liquidated damages and reputational loss, while legacy project issues have previously distracted management and tied up capital needed for new bids and execution.
Labor-intensive model pressures margins
KBR’s labor‑intensive model leaves margins highly exposed: utilization dips, attrition, and wage inflation materially compress profitability. Scarcity of knowledge workers raises recruiting and retention costs, increasing SG&A and project resourcing charges. Under multi‑year contracts rate realization often lags rising labor costs, constraining near‑term margins. Sustainable margin expansion depends on shifting revenue mix toward higher‑margin technology and IP offerings.
Dependence on government budgets
Dependence on government budgets exposes KBR to award delays from appropriations cycles and political shifts, with continuing resolutions slowing tasking and ramp-ups. Government shutdowns, such as the 35-day U.S. shutdown in 2018, and sequestration-level cuts (about $85 billion in 2013) can shift revenue timing. Heavy portfolio concentration in defense and space increases KBRs policy sensitivity and cash-flow volatility.
Operational complexity across geographies
Operational complexity across geographies drives higher overhead and compliance risk for KBR, as multi-jurisdiction requirements demand extensive legal and reporting resources. Rigorous controls are needed to manage export controls, sanctions, and anti-bribery rules, increasing compliance costs and audit exposure. Currency volatility and layered tax regimes can compress margins, while supply chain reliability varies by region, raising schedule and cost risk.
- Multi-jurisdiction compliance: higher overhead
- Regulatory controls: export, sanctions, anti-bribery
- Financial pressure: currency and tax complexity
- Operational risk: variable regional supply chain reliability
Hydrocarbon legacy perception
Hydrocarbon legacy perception ties KBR to traditional energy, which can deter ESG-focused capital and slow access to green-transition funds despite growing clean-energy contracts.
Valuation multiples often lag pure-play government tech peers, reflecting investor bias toward digital/defense firms with clearer ESG credentials.
Talent attraction in ESG-centric markets can be harder; narrative transition requires consistent, auditable proof points across contracts and disclosures.
- ESG capital drag
- Lower relative multiples
- Recruiting challenges
- Need for verifiable transition metrics
Fixed-price margin pressure and government contract concentration raise operational and ESG risk
KBR remains margin‑vulnerable from large fixed‑price projects, labor cost inflation and schedule slippage, with government contract concentration amplifying timing risk and policy sensitivity. Multi‑jurisdiction compliance and legacy hydrocarbon exposure raise overhead and ESG capital friction, slowing multiple expansion and talent attraction. Persistent operational complexity increases audit, supply‑chain and FX risks.
| Metric | Value (2024) |
|---|---|
| Revenue | $6.0B |
| Govt. % of rev | ~60% |
| Backlog | $11B |
Preview the Actual Deliverable
KBR SWOT Analysis
This is the actual KBR SWOT analysis document you’ll receive upon purchase—no surprises, just professional quality. The preview below is taken directly from the full report, and the complete, editable version is unlocked after checkout. Buy now to access the full, detailed file.
Original: $10.00
-65%$10.00
$3.50Description
Go Beyond the Preview—Access the Full Strategic Report
KBR’s engineering pedigree, global government contracts, and growing digital services offer strong revenue visibility, while exposure to defense spending cycles, contract concentration, and integration risks pose strategic challenges. Our full SWOT unpacks these implications with financial context and actionable recommendations. Purchase the complete report for an editable Word and Excel package to plan, pitch, or invest with confidence.
Strengths
Diversified service portfolio
Operating across government, technology, and energy spreads revenue sources and reduces cyclicality; KBR reported approximately $6.9 billion revenue in 2024 with a multi-billion-dollar backlog supporting stability. The firm blends advisory, engineering, program management and O&M to capture full-lifecycle spend, enabling cross-selling and resilient utilization. Diversification hedges sector-specific downturns and preserves cash flow during cycles.
Large, sticky government contracts
Long-duration contracts with defense, space and civil agencies (e.g., FY2025 U.S. defense budget ~$858B, NASA ~$27B) give KBR multi-year backlog visibility and steady cash flow; hardened performance credentials and compliance raise switching costs and lift win rates via contract vehicles; this base cushions macro volatility in commercial markets.
Proprietary technologies and IP
KBR’s proprietary process technologies and digital solutions differentiate bids and expanded margins, with the company reporting approximately $5.9 billion in FY2024 revenue that increased tech-led contract wins. Tech licensing—delivered capital-light—scales profitably and contributed a growing share of recurring revenues. Integrating IP with engineering and services deepens client lock-in and bolsters pricing power versus commoditized EPC peers.
Global delivery and execution scale
Global delivery across 40+ countries enables rapid mobilization and multi-theater program delivery; established supply chains and partner ecosystems enhance cost and schedule control; scale supports standardized methodologies and quality assurance; clients value a single integrator for complex, multi-year missions.
- Global footprint: 40+ countries
- Integrated supply chains
- Standardized QA/methods
- Single integrator for multi-year programs
Strong program management and safety record
KBR's track record in mission-critical environments underpins credibility and supports a FY2024 revenue base of approximately $6.4 billion, reflecting stable program delivery. A mature PMO, governance and safety systems reduce execution risk and lower clients' total cost of ownership through predictability. Reputation compounds via high recompete rates and referrals, sustaining backlog.
- Track record: mission-critical delivery
- PMO & safety: lower execution risk
- Client benefit: reduced TCO via predictability
- Growth: compounded by recompetes/referrals
Diversified gov, tech & energy mix drove FY2024 $6.9B; multi-yr U.S. defense/NASA support
KBR’s diversified government, technology and energy mix drove FY2024 revenue of approximately $6.9B with a multi‑billion-dollar backlog, reducing cyclicality and enabling cross‑selling. Long‑duration U.S. government contracts (FY2025 defense ~$858B; NASA ~$27B) provide multi‑year visibility and steady cash flow. Proprietary tech, global delivery (40+ countries) and strong PMO/safety lower execution risk and boost recompete rates.
| Metric | Value |
|---|---|
| FY2024 Revenue | $6.9B |
| Geographic Footprint | 40+ countries |
| FY2025 US Defense Budget | $858B |
| NASA FY2025 | $27B |
What is included in the product
Detailed Word Document
Delivers a strategic overview of KBR’s internal and external business factors, outlining strengths, weaknesses, opportunities and threats to assess its competitive position, growth drivers, operational gaps and future risks.
Customizable Excel Spreadsheet
Provides a concise KBR-focused SWOT matrix for fast, visual strategy alignment and quick stakeholder-ready summaries.
Weaknesses
Contract and execution risk exposure
Complex, large-scale contracts expose KBR to scope creep, change orders and claims that can erode profitability if not recovered through contract adjustments; fixed-price or poorly hedged terms have in past projects compressed margins materially. Schedule slippage can trigger liquidated damages and reputational loss, while legacy project issues have previously distracted management and tied up capital needed for new bids and execution.
Labor-intensive model pressures margins
KBR’s labor‑intensive model leaves margins highly exposed: utilization dips, attrition, and wage inflation materially compress profitability. Scarcity of knowledge workers raises recruiting and retention costs, increasing SG&A and project resourcing charges. Under multi‑year contracts rate realization often lags rising labor costs, constraining near‑term margins. Sustainable margin expansion depends on shifting revenue mix toward higher‑margin technology and IP offerings.
Dependence on government budgets
Dependence on government budgets exposes KBR to award delays from appropriations cycles and political shifts, with continuing resolutions slowing tasking and ramp-ups. Government shutdowns, such as the 35-day U.S. shutdown in 2018, and sequestration-level cuts (about $85 billion in 2013) can shift revenue timing. Heavy portfolio concentration in defense and space increases KBRs policy sensitivity and cash-flow volatility.
Operational complexity across geographies
Operational complexity across geographies drives higher overhead and compliance risk for KBR, as multi-jurisdiction requirements demand extensive legal and reporting resources. Rigorous controls are needed to manage export controls, sanctions, and anti-bribery rules, increasing compliance costs and audit exposure. Currency volatility and layered tax regimes can compress margins, while supply chain reliability varies by region, raising schedule and cost risk.
- Multi-jurisdiction compliance: higher overhead
- Regulatory controls: export, sanctions, anti-bribery
- Financial pressure: currency and tax complexity
- Operational risk: variable regional supply chain reliability
Hydrocarbon legacy perception
Hydrocarbon legacy perception ties KBR to traditional energy, which can deter ESG-focused capital and slow access to green-transition funds despite growing clean-energy contracts.
Valuation multiples often lag pure-play government tech peers, reflecting investor bias toward digital/defense firms with clearer ESG credentials.
Talent attraction in ESG-centric markets can be harder; narrative transition requires consistent, auditable proof points across contracts and disclosures.
- ESG capital drag
- Lower relative multiples
- Recruiting challenges
- Need for verifiable transition metrics
Fixed-price margin pressure and government contract concentration raise operational and ESG risk
KBR remains margin‑vulnerable from large fixed‑price projects, labor cost inflation and schedule slippage, with government contract concentration amplifying timing risk and policy sensitivity. Multi‑jurisdiction compliance and legacy hydrocarbon exposure raise overhead and ESG capital friction, slowing multiple expansion and talent attraction. Persistent operational complexity increases audit, supply‑chain and FX risks.
| Metric | Value (2024) |
|---|---|
| Revenue | $6.0B |
| Govt. % of rev | ~60% |
| Backlog | $11B |
Preview the Actual Deliverable
KBR SWOT Analysis
This is the actual KBR SWOT analysis document you’ll receive upon purchase—no surprises, just professional quality. The preview below is taken directly from the full report, and the complete, editable version is unlocked after checkout. Buy now to access the full, detailed file.











